THE CO-EXISTENCE OF HETEROTROPHS AND NITRIFIERS IN NITRIFYING BIOFILM
←
→
Page content transcription
If your browser does not render page correctly, please read the page content below
THE CO-EXISTENCE OF HETEROTROPHS
AND NITRIFIERS IN NITRIFYING BIOFILM
A study on the relationship between heterotrophic
 and nitrifying bacteria in a marine environment.
                                           Andreas Thymann
                 Interdisciplinary master's thesis in molecular and environmental biology

Supervisors:

Benni Winding Hansen

Håvard Jenssen

Department of Nature, Systems and models

Department of Environmental, Social and Spatial Change

Roskilde University, 2013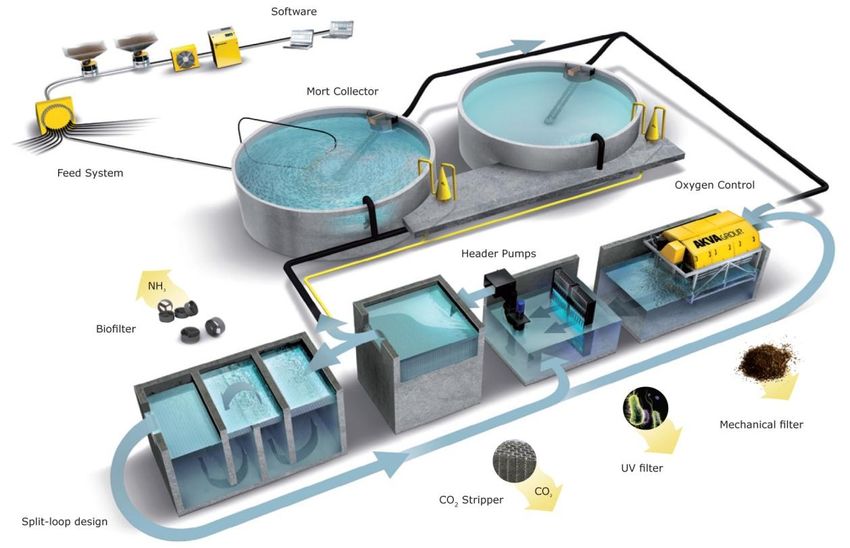
Page 2
Abstract

As world fish stock decrease the aquaculture industry becomes more and more lucrative.
Conventional aquacultures such as caged-based or flow-through systems can have a strong impact
on surrounding benthic environment by inorganic nutrient loading creating high anoxic conditions.
Closed recirculation aquaculture systems (RAS) has proven to be a more sustainable because a
major part of the organic waste is sorted out and undergone nitrification and de-nitrification
reducing the output of nitrate into the oceans. In RAS the utilization of nitrifying bacteria to reduce
and control concentration of ammonium NH4+ and ammonia NH3 referred to as total ammonia
nitrogen TAN is critical since these are highly toxic for fish. Ammonium is secreted from the gills
of the fish and from the decomposition of organic nutrients by a wide range of heterotrophic
bacteria naturally present in marine and freshwater. In bio filtration of a RAS nitrifying bacteria are
growing in biofilm on bio filters designed to increase the surface area making more room for the
nitrifiers to create biofilm. Biofilm can be described as a three-dimensional structure consisting of
different layers in which the microorganisms are embedded. Ammonium oxidation has a very low
energy yield and nitrifying bacteria are known to reproduce very slowly. It is therefore a common
problem in many bio filtration systems that nitrifying biofilm gets overgrown by heterotrophic
bacteria which leads to a decrease in ammonium conversion. Ammonia oxidation is catalyzed by
the enzyme ammonia monooxygenase (amoA) which has been used in a wide range of phylogenetic
studies describing different strains of ammonia oxidizing bacteria and as a biomarker for ammonia
oxidation. In this study the colonization of nitrifying biofilm of Nitrosomonas marina sp. 22 by the
marine heterotrophic bacteria Shewanella japonica was examined and how different surfaces may
influence the rate of colonization by S. japonica. The effect on the expression of amoA and
conversion rate of TAN by N. marina sp. 22 was described by the use of quantitative real-time PCR
and measurements of TAN decrease over a 12 day period. Results from qPCR and the effect on
TAN conversion was unfortunately inconclusive. The rate of biofilm production by S. Japonica
when grown on a surface coated with biofilm from N. marina sp. 22 and on a surface coated with a
synthetic biofilm of Bovine serum albumin (BSA) showed a significant increase in exponential
growth rate when compared to a uncoated surface, indicating that heterotrophic bacteria may be
stimulated to colonize nitrifying biofilm and biofilm like surfaces. A comparison of a live/dead
staining of a biofilm with both strains and one with only N. marina sp. 22 also indicated a
difference.

                                               Page 3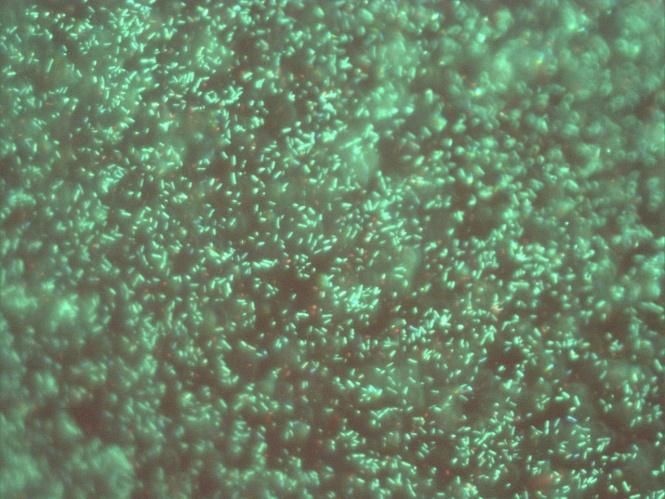
Danish summary (Dansk sammendrag)

Som verdens fiskebestand mindskes, bliver aquakultur industrien mere og mere lukrativ.
Konventionelle akvakulture så som bur-baserede eller gennemstrøms systemer kan have en kraftig
indvirkning på det omkringliggende bentiske miljø ved inorganisk nærings tilførelse, som skaber
kraftigt iltfattige vilkår. Lukkede recirculerings akvakultursystemer (RAS) har vist sig at være mere
bæredygtigt, da størstedelen af det organiske affald er sorteret fra og er undergået nitrification og
de-nitrification, hvilket reducerer afkastet af nitrat til havet. I RAS bruges nitrificerende bakterier til
at reducere og kontrollere koncentrationen af ammonium (NH4+) og ammoniak (NH3), også kaldet
Total Ammoniak Nitrogen (TAN), da dette er kritisk eftersom det er meget giftigt for fisk.
Ammonium secreres fra fisks gæller og fra forrådnet organisk materiale af en lang række naturligt
tilstedeværende marine heterotrophiske bakterier. I biofiltration i RAS gror de nitrificerende
bacteria på biofiltre, som er designet til at have stor overflade og derved øge arealet, hvorpå
nitrifcernde bakterier kan lave biofilm. Biofilm kan beskrives som en tredimensionel struktur
bestående af forskellige lag, hvori mikroorgansimer er indlejret. Ammonium oxidation har et meget
lavt energi udbytte, og nitrificerende bakterier er kendt for at vokse meget langsomt. Det er derfor et
meget almindeligt problem, at mange biofiltrationssystemer bliver overgroet af heterotrophe
bakterier, hvilket kan lede til en mindskning i TAN omsætning. Oxidation af ammonia er
katalyseret af enzymet ammonia monooxygenase (amoA), som er blevet brugt i en lang
rækkephylogenetiske studier af forskellige stammer af ammonia oxiderende bakterier og som en
biomarkør for ammonia oxidation. I det pågældende studie undersøges raten, hvorved biofilm fra
Nirosomonas marina sp. 22 coloniseres af den marine heterotrophe bakterie Shewanella japonica og
hvorvidt dette påvirker udtrykket af amoA og omsættelsen af TAN over en 12 dages periode. Ved
brug af quantitative real-time PCR blev effecten af amoA udtrykkelsen undersøgt. Resultater fra
qPCR og effekten på TAN omsætningen gav resultat. Vækst raten af biofilm production fra S.
japonica når den gror på en overflade, som er behandlet med biofilm fra N. marina sp. 22 og en
overflade behandlet med Bovine Serum Albumin (BSA) viste en significant forskel sammenlignet
med en ikke behandlet overflade. Dette kan indikere at heterotrophiske bacterier bliver stimuleret af
biofilm fra nitrificerende bakterier og biofilm lignende overflader. En sammenligning af en
live/dead farvning af biofilm med begge stammer og en med kun N. marina sp. 22 indikerede også
en forkel.

                                                 Page 4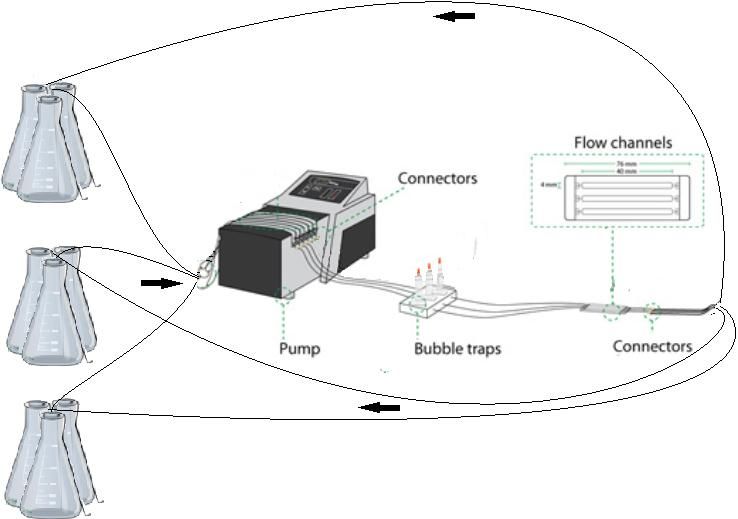
Preface

This thesis was written as a 60 ECTS point interdisciplinary master's thesis in molecular and
environmental biology. All experiments were conducted at Roskilde University in the laboratories
of Håvard Jenssen and Ole Skovgård and in the climate room of Benni Winding Hansen.

My supervisors for this project were Professor Benni Winding Hansen, Roskilde University,
Department of Environmental, Social and Spatial Change (ENSPAC), and Associate Professor
Håvard Jenssen, Roskilde University, Department of Nature, Systems and Models (NSM).

I would like to express my appreciation and sincere gratitude to my supervisors Professor Benni
Winding Hansen and Associate Professor Håvard Jenssen.

I also want to thank the laboratory technicians Kirsten Olesen, Helle Jensen, Anne Busk Faarborg
and Rikke Guttesen for assistence and guidance in the laboratory and PhD-student Per Meyer
Jepsen for guidance in statistical analysis.

The project would not have been the same without the presence of many wonderful people, Andreas
Skovgård Jacobsen, Troels Godballe, Anders Blomkild Lorentzen, Simon Lynge Hansen, Ronja
Windfeld, Biljana Mojsoska, and Britt Plough Hansen.

                                               Page 5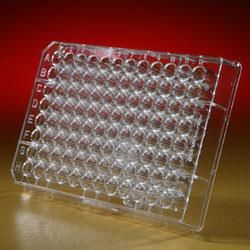
Contents
1. Introduction ...................................................................................................................................... 8
   1.1 Structure and nature of biofilm: ............................................................................................... 10
   1.2 The Nitrifying Community: ..................................................................................................... 13
   1.3 Heterotrophic bacteria in recirculation aqua system: ............................................................... 15
   1.4 Objective: ................................................................................................................................. 17
2 Materials and Methods .................................................................................................................... 18
   2.1 Strains, enrichment and storage: .............................................................................................. 18
       2.1.1 Bacterial strains: ................................................................................................................ 18
       2.1.2 Storage and enrichment of strains: .................................................................................... 18
   2.2 Doubling time of S. japonica. .................................................................................................. 19
   2.3 Effect of existing biofilm on colonization by S. japonica ....................................................... 20
   2.4 Nitrification development ........................................................................................................ 23
       2.4.1 Recirculating flow system setup ....................................................................................... 23
       2.4.2 RNA isolation ................................................................................................................... 26
   2.4.3 cDNA synthesis..................................................................................................................... 27
       2.4.4 quantitative real time PCR (qPCR) ................................................................................... 28
   2.5 Live/dead staining ................................................................................................................... 29
3 Results ............................................................................................................................................. 31
   3.1 Nitrification development ........................................................................................................ 31
   3.2 Estimation of S. japonica doubling time:................................................................................. 33
   3.3 Effect of existing biofilm on colonization by S. japonica ....................................................... 34
   3.4 Live/ dead staining: .................................................................................................................. 38
   3.5 Inhibition of nitrification:......................................................................................................... 38
       3.5.1 Ammonium measurements ............................................................................................... 38
       3.5.1 Quantitative real-time PCR ............................................................................................... 40
4. Discussion: ..................................................................................................................................... 44
5. Conclusion ..................................................................................................................................... 48
7. Future perspectives ........................................................................................................................ 49
References .......................................................................................................................................... 50

                                                                      Page 6
Page 7
1. Introduction
As the world's fish stocks are drastically decreasing and the demand for fish is constantly increasing
the aquaculture industry is growing rapidly. The use of aquacultures can have a serious impact on
the surrounding benthic environment by inorganic nutrient loading creating high anoxic conditions
(Holmer et al., 2003). Conventional aquacultures such as caged-based or flow-through systems have
no way of dealing with the bi-products that are created. Eutrophication from fish feed and feces can
lead to oxygen depletion in shallow waters and result in major fish kills if wastewater is not diluted
or treated (Wu, 1995, Holmer et al., 2003). This has become a major concern in many countries that
wish to avoid further organic pollution. A solution to this problem is to use more advanced closed
recirculation aquaculture systems (RAS) (fig1). The impact of RAS on the surrounding
environment is easier controlled and has proven to be a much more sustainable solution (Cytryn et
al., 2003). Besides being more eco-friendly there are many other advantages with using RAS when
compared to the caged-based or flow-through systems. For example up to 90-99% of the water in
RAS is re-circulated making it easier and cheaper to maintain at a fixed temperature, and food
conversion efficiency is much higher creating less food waste. In countries with high restrictions on
waste discharge RAS has proven to be well suited for intense fish farming because a major part of
the organic waste is sorted out and undergone nitrification and de-nitrification reducing the output
of nitrate into the oceans (Heinen et al., 1996, Losordo et al., 1998, Wolters et al., 2009). Having to
recycle water comes with its own challenges compared to the cage-based and flow-through systems.
Salinity, temperature, oxygen, pH, alkalinity and waste bi-products however are all parameters that
have to be controlled in order for the system to function. Salinity is fairly simple, since the water is
recycled and by minimizing evaporation it is considered constant. Temperature, pH, oxygen and
waste products have to be monitored and controlled thoroughly since these factors are crucial for
fish survival(Kim et al., 2000). Waste products such as dissolved ammonium are of primary
concern when dealing with waste in RAS. Ammonium exists in two aqueous forms, NH3 and NH4+
(eq. 1). Both are toxic for fish but the unionized form, ammonia (NH3) gets toxic at lower
concentrations. The equilibrium of the two

(1) H3O+ + NH3(aq) ↔ H2O + NH4+(aq)

are affected by pH, temperature and salinity (Chen et al., 2006). In seawater equilibrium is obtained
at pH 9.3 at 25 C˚ (Clegg and Whitfield, 1995). Lower pH moves the equilibrium to the left, and

                                               Page 8
higher pH moves the equilibrium towards the right (Chen et al., 2006). Since dissolved ammonium
exists in these two forms it is referred to as Total Ammonia Nitrogen (TAN) for the entire system.
Other waste products are nitrite-nitrogen (NO2-), nitrate-nitrogen (NO3-) and carbon dioxide (CO2).
They can also have an impact on fish health but are either easier managed or less toxic. TAN and
CO2 arise from protein metabolism and respiration of the fish and are secreted from the gills. It will
also be formed from the bacterial breakdown of fatty-acids, proteins and carbohydrates that are not
assimilated by the fish, and from fecal solids or uneaten feeds. It is therefore important to remove
all waste solids as soon as they appear (Losordo et al., 1998)
Figure 1: An illustration of a Recirculating Aqua System (Akvagroup.com). Water is passed from the fish tank to mechanical
filtration which removes all particles larger than 50 microns. The water is then passed through a UV filter, which radiates the
water, controlling the levels of pathogens and ecto-parasites. Hereafter the water is passed through a CO2 stripper where
gasses such as CO2, N2 and sulphide residues are removed. Approximately 70% will be transferred back to the fish tank.
Approximately 30% of the water is then transferred to the bio filtration, where ammonia will be oxidized into nitrite and
nitrogen, securing ammonia levels are below lethal levels. The water is then passed back to the UV chamber.
Even with thorough waste removal it is unavoidable that the concentration of TAN will increase in
the fish tank and if left unattended it will reach toxic levels. By utilizing microorganisms that are
able to perform nitrification, a two part reaction in which ammonium (NH4+) is oxidized to nitrate
as shown in eqs. (2) and (3), lethal levels of toxic bi-products from waste can be avoided. This is
referred to as bio-filtration (Kim et al., 2000).
Page 9(2) NH4+ + 1.5O2 → 2H+ + H2O + NO2-
(3) NO2- + 1.5O2 → NO3-
Nitrifying organisms and optimization of nitrifying properties has therefore become of great interest
in the field of aqua culturing. Nitrifying bacteria form biofilm on bio filters and oxidize ammonium
to nitrate. It is imperative that the conversion rate is high enough to keep TAN concentration below
approximately 30µM (Grommen et al., 2005). Many different strategies for optimal bio filters have
been tested. The main idea of most bio filters is to increase the surface area thereby permitting more
nitrifying biofilm to be formed to increase the level of nitrification (Malone and Pfeiffer, 2006)
1.1 Structure and nature of biofilm:
Microorganisms in nature do not live as pure cultures or dispersed single cells. Many have a
tendency to form polymicrobial aggregates known as biofilm. This phenomenon is very common
and is done by a wide range of microorganisms. Microorganisms within the biofilm make up for
less than 10% of the biofilm dry weight whereas the matrix itself consists of more than 90%
(Flemming and Wingender, 2010). The biofilm matrix is formed of a conglomeration of different
bi-polymers produced by the microorganisms. These are referred to as extracellular polymeric
substances (EPS) (Bales et al., 2013). The biofilm matrix is a three-dimensional structure consisting
of different layers in which the microorganisms are embedded. EPS are closely related to the cell
since they create the immediate environment in which the microbes exists (Decho, 2000). The
nature of different EPS is crucial for the structural maintenance of a multicellular biofilm, as well as
the three-dimensional structure such as pores and channels (Gamini et al., 2002). Concentration,
charge and sorption capacity are all properties that will determine the interaction with other
substrates and other cells. The nature of the surrounding EPS also determines the morphological
shape of the biofilm, whether it is rough, smooth, rigid or even sponge like. By forming a biofilm
the microorganisms enter a stationary phase and are no longer motile which means the life form is
completely changed from the planktonic phase. EPS enable microorganisms to create a micro-
environment within the biofilm which is suitable for them. Different cells in close proximity of one
another allows for cell to cell communication known as quorum sensing. This is done by the use of
specialized receptors and secreted proteins. Quorum sensing even takes place between different
species (Shrout and Nerenberg, 2012). By the use of quorum sensing and creation of micro-
environments a high biodiversity of a long-sustained multi cellular population is promoted.
Although the importance of EPS is clear the specific role of most EPS secreted is still very poorly
Page
10understood, but it is believed to have a key role in both cooperation and competition between
microbial species within a biofilm (Flemming and Wingender, 2010).
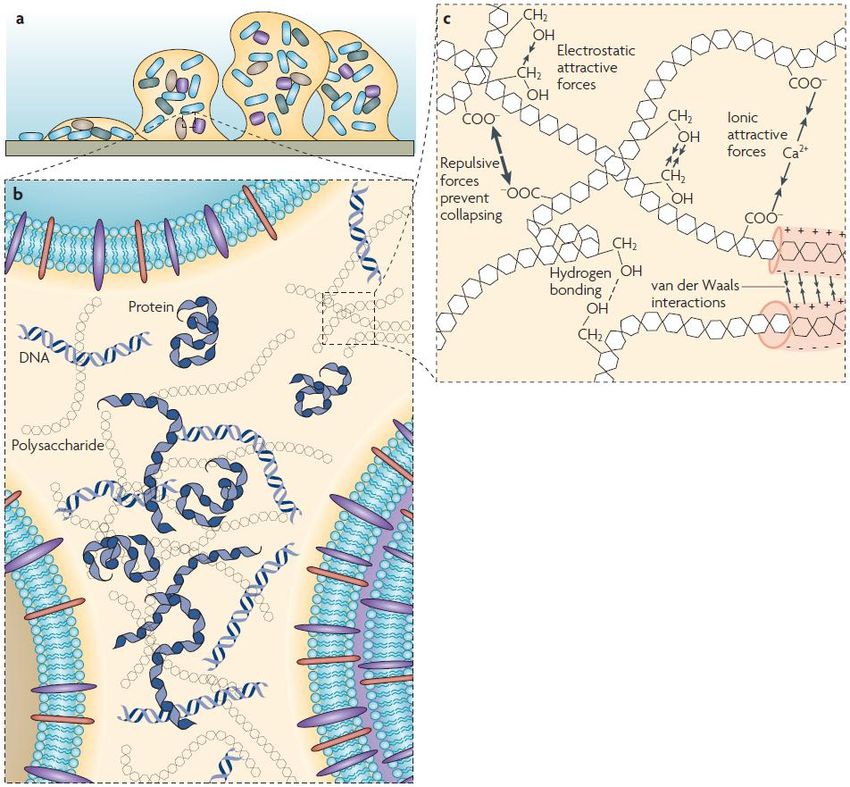
Figure 2: An illustration of Extracellular Polymeric Substances in a biofilm at different dimensions. a: The colonization of a
solid surface by a bacteria. It starts with the attachment of a single cell to a solid surface. It then multiplies and starts to form
the biofilm matrix, forming a micro-colony consisting of only a few cells. As the biofilm matures other cells may be recruited
and a more complex biofilm matrix is formed. b: The extracellular space inside the biofilm with different matrix components.
Polysaccharides, proteins and eDNA secreted by neighboring cells in a non-homogenic fashion. c: Physicochemical
interactions between different biopolymers that ensures the stability of the biofilm matrix (Flemming and Wingender, 2010).
The biofilm presents many advantages for the biofilm biota. Many extracellular enzymes function
as an external digestive system where external bi-polymers are broken down to low-mass molecules
which can then be taken up and utilized as carbon or as an energy source. Also cell components
from lysed cells are trapped in the matrix making neighboring cells able to recycle important
components such as nucleotides, lipids and even whole genes. Utilization of genes from lysed cells
creates an available gen-pool for horizontal gene transfer within the biofilm (Sutherland, 2001).
Page
11The biofilm also works as a shield protecting against many physical and chemical threats such as
desiccation, oxidizing, metallic cat ion, UV-radiation and even protozoan grazers (Elasri and Miller,
1999). In any natural environment changes are constant among available oxygen, organic/ inorganic
nutrients, temperature or pH. The microbial community within a biofilm is therefore under constant
selective pressure, and constant adaption to ecological changes and competition with rivaling cells
makes the biofilm community very dynamic (Sutherland, 2001).
A major part of the EPS matrix consists of extracellular polysaccharides. These are in general very
long molecules, both linear and branched, and have been demonstrated to be ubiquitous in the
biofilm matrix. Many have been observed being attached to cell surfaces forming complex networks
(Chen et al., 2013). Extracellular polysaccharides have shown to be very diverse even between
different strains of the same species. In P. aeruginosa 3 distinct extracellular polysaccharides was
described; alginate, psl, and pel. Different strains of P. aeruginosa was able to form functioning
biofilm with only one of the three (Ghafoor et al., 2011). All were very important for architectural
stability of the biofilm. Cells that are not able to form extracellular polysaccharides will not be able
to form a biofilm. Some can still attach to surfaces and form micro colonies, but will never mature
into a biofilm (Danese et al., 2000). It has been observed though, that in multispecies biofilms, these
extracellular polysaccharide mutants are still able to colonize and integrate into a biofilm, as long as
another species will form the matrix. That is why the amount of different extracellular
polysaccharides does not necessarily show how many species a specific biofilm contains, since
they do not contribute equally to the structure of a biofilm (Sutherland, 2001).
Extracellular proteins, primarily enzymes, are another important aspect when discussing biofilm.
Proteins are so abundant that they in some cases can exceed the total mass of extracellular
polysaccharide. Many extracellular enzymes are used in the degradation of different biopolymers
such as proteins, polysaccharides, nucleic acids, lipids, inorganic matter and organic matter trapped
in the biofilm. In some cases even chitin and cellulose. Some enzymes are also involved in
degrading structural EPS (Zhang and Bishop, 2003). In the case of environmental changes, nutrient
starvation or availability of a new nutrient, biofilm may be needed in order to adapt to the new
environment. Enzymes degrading the structural EPS are then released by cells in proximity of the
changes. This causes dispersion of sessile cells allowing new biofilm to be formed. Since most
naturally occurring biofilms are multispecies, many different EPS are formed depending on species
Page
12and possible mutations. For each new EPS, a new enzyme with matching binding site is required. A
universal enzyme that degrades all EPS is yet to be found (Wingender et al., 2001).
It is very costly for the cells to produce enzymes. It is therefore important for the cells to make sure
that they gain something in return. An efficient way of retaining enzymes in the matrix is to have
them form weak bonds with the structural extracellular polysaccharides thereby decreasing the
distance they diffuse from the cell that secreted them. This ensures that the reactions catalyzed by
the enzyme happens in close proximity of the cell that in the first place secreted them, making sure
it benefits from the work performed (Mayer et al., 1999, Skillman et al., 1999).
All proteins in the biofilm matrix are not enzymes. Structural proteins such as lectins are important
part of stabilizing the structural extracellular polysaccharides. Studies on Psuedomonas aerguginsa
further testament to this. Mutants with inhibition of a lectin called LecB (Johansson et al., 2008) or
LecA (Diggle et al., 2006) both showed dispersion of biofilm. Also when LecA was overproduced
so was the biofilm when compared to the wild-type (Diggle et al., 2006). However when the two
different strains with different mutations where introduced into the same biofilm, the lectins were
able to assemble outside the cells, thereby creating a functional biofilm, showing how different cells
may support each other (Johansson et al., 2008).
Ekstracellular DNA (eDNA) has been found to be important for the structural integrity of the matrix
for some species of bacteria. However the importance differs between different species. For some it
is vital, where in others it is less significant. eDNA have different structural roles when secreted
from different species. When eDNA was first discovered many believed it to be leftovers from
lysed cells. This however proved not to be true, since there is a fundamental difference in the
composition of nucleotids compared to genomic DNA (Frolund et al., 1996, Kaplan et al., 2011)
1.2 The Nitrifying Community:
The nitrifying bacteria are chemo litho autotrophic, and consist of two groups; the ammonia
oxidizing bacteria (AOB) and the nitrite oxidizing bacteria (NOB). With the exception of two
species, all known AOBs belong to the monophyletic group within the β-subclass of Proteobacteria
(Head et al., 1993, Aakra et al., 2001), where NOB belong to four groups within the α-subclass, γ-
subclass and δ-subclass of Proteobacteria (Grommen et al., 2005).
Page
13As mentioned earlier, in aquatic media ammonia consists of two forms. Unionized NH3 and ionized
NH4+. (Chen et al., 2006). The conversion of ammonia to nitrite and nitrite to nitrate is unique for
the nitrifying microorganisms.
A simplified reaction is depicted in eq. (5) and (6) and as illustrated in figure 3.
(5) NH4+ + 1,5O2 → 2H+ + H2O + NO2- (AOB)
(6) NO2- + 1,5O2 → NO3- (NOB)
Figure 3: A simplified illustration of the two steps in nitrification from a model AOB (Nitrosomonas) and NOB (Nitrobactor.
(Costa et al., 2006). It shows how the NOx cycle is catalyzed by the membrane bound enzyme ammonia monooxygenase
(AMO).
The energy yield from nitrification is fairly low compared to oxidation of sugars that happens in
most heterotrophic bacteria. This makes nitrifying bacteria grow very slowly and harder to isolate,
but also quite a hassle to work with.
Page
14The nitrifying community on bio filters is mainly categorized by AOB and NOB, all though in
recent years, ammonia oxidizing archaea (AOA) have also been reported to have a significant role
in the nitrifying community (Bollmann et al., 2011). Whether it is AOB or AOA that dominate the
biofilters in RAS seems to differentiate depending on where different studies are done (Foesel et al.,
2008, Sakami et al., 2012, Bollmann and Laanbroek, 2002). Many cases do point out that it is often
within the Nitrosomonas and Nitrospira linage that dominate the bacterial ammonia oxidizers in
marine RAS. In nature the Nitrospira linage has proven to be most common in marine
system(Ward, 2005) where Nitrosomonas dominate most estuaries and are often associated with
higher ammonia concentrations (Bollmann and Laanbroek, 2002). The present study will only focus
on AOBs.
The phylogenetic relationship between ammonia oxidizing bacteria (Nitrosospira lineage and
Nitrosomonas lineage), has been extensively studied, by the use of 16S rRNA PCR (Koops et al.,
1991, Head et al., 1993) and by amoA microarray (Purkhold et al., 2003, Abell et al., 2012). The
16S rRNA is highly conserved in most lineages, since mutations in the rRNA will induce changes
in all proteins synthesized. This also means that horizontal gene transfer is unlikely to happen.
Because of rRNA evolutionary stable nature different species can be catalogued through this. But
since rRNA is not an enzyme, it does not show the impact of the environment on the
microorganisms and does not show selective pressure (Ward, 2005). Synthesis of active enzymes,
like ammonia monooxygenase enzyme (amoA), generally has a higher rate of mutations and
isoforms are more common. amoA is more likely to depict in which environment the bacteria
thrives and thereby diversity within different lineages (O'Mullan and Ward, 2005). It has also been
shown that amoA mRNA may function as a biomarker of nitrification in wastewater management
(Aoi et al., 2004).
Since AOBs are very slow growing, fast growing heterotrophic bacteria will quickly outcompete
them, in means of space and available oxygen, if available organic nutrients are present.
Heterotrophic bacteria will colonize existing biofilm, gradually taking over, thereby strangling the
original nitrifying biofilm. This is believed to have a negative impact on the bio filters nitrifying
capability (Michaud et al., 2006).
1.3 Heterotrophic bacteria in recirculation aqua system:
The main focus on heterotrophic bacteria in recirculation aquaculture systems has only been on
pathogenic bacteria since these affects the direct health of the fish. The non pathogenic community
Page
15has therefore never been studied in full. The heterotrophic bacteria can consist of more than 80% of
the total bacterial population on bio filters (Hovanec and DeLong, 1996). Heterotrophic bacteria can
however have an indirect negative effect on the fish population. As mentioned earlier undigested
food pellets as well as fecal matter will be converted to ammonium. A constant problem in most
RAS is heterotrophic growth on the nitrifying biofilm, which leads to a decrease in ammonia
oxidation. UV radiation of water entering the bio filtration chambers decreases heterotrophic
growth but despite these efforts heterotrophic growth is still observed in bio filtration (Elasri and
Miller, 1999). When heterotrophic bacteria invade existing nitrifying biofilm, competition for
dissolved oxygen will intensify. The slow growing nitrifies will most likely be outcompeted by
faster growing heterotrophs. Access to the bulk water will also be limited, decreasing the access to
dissolved ammonia. A RAS with completely overgrown bio filters will be in serious threat of
reaching toxic levels of TAN (Michaud et al., 2006).
Page
161.4 Objective:
RAS depends on bacteria naturally present in the water to form nitrifying biofilm. Two biofilm are
never the same and the phylogenic relationship in a biofilm is often very different. This is partly due
to the dynamic nature of a biofilm. Very little is known on the actual development of a biofilm, and
how competing bacteria may influence the development and maintenance in a biofilm. Some strains
such as Nitrosomonas and Nitrobactor have been suggested to be the dominant nitrifiers in RAS
bio-filtration, but this again varies between studies. Observations from many different RAS describe
that bio filters will eventually become polluted and colonized by other heterotrophic bacteria, even
though the water is passed through UV-radiation. A detailed study on how the development of a
nitrifying biofilm is influenced by the heterotrophs is lacking. In this study the focus will be on the
development of a nitrifying biofilm and how heterotrophic interaction might disrupt nitrification,
and outcompete the nitrifiers in a simulated environment. The following questions will be sought to
be answered:
- How will heterotrophic bacteria influence the development of nitrifying biofilm?
- How will co-existence with heterotrophic bacteria influence the rate of nitrification and the
expression of the amoA gene in a nitrifying biofilm?
- Will pre-existing nitrifying biofilm increase the rate by which heterotrophic bacteria will
form biofilm?
Page
172 Materials and Methods
The inhibition of nitrification in RAS can be a serious problem. Observations suggest this is
because of heterotrophic bacteria growing on the bio filters. In order to examine this problem an
experiment to determine how nitrifying biofilm is affected by the presence of biofilm producing
heterotrophic bacteria. Nitrosomonas marina sp. 22 was used as a model nitrifying bacteria and
Shewanella japonica was used as a model heterotrophic bacteria. The difference in ammonium
oxidation will be measured as well as the expression of the amoA gene by the use of qPCR and if a
pre-formed biofilm will affect biofilm production of a heterotrophic bacterium. This chapter will
describe how different experimental procedures were designed and executed.
2.1 Strains, enrichment and storage:
2.1.1 Bacterial strains:
Bacterial strains were chosen in order to model the nitrifying community and the heterotrophic
community observed in RAS. Nitrosomonas marina sp. 22 (N. marina sp. 22) was chosen as a
model ammonia oxidizing bacteria due to its frequent association with marine biofilm. The strain
was kindly supplied by Professor A. Pommerening-Röser from University of Hamburg, faculty of
biology. Shewanella japonica (S. japonica) was used as a model aerobic heterotrophic bacterium
due to its biofilm forming capability. S. japonica was kindly supplied by PhD-student Agnete
Krabbe Katholm from Roskilde University, Department of Environmental, Social and Spatial
Change (ENSPAC).
2.1.2 Storage and enrichment of strains:
S. japonica and N. marina sp. 22 had to be stored in different ways. N. marina sp 22 was not suited
for freeze storage as with most bacteria and had to be stored as a continuous batch culture. S.
japonica was able to be stored as a freeze culture and inoculated when it was to be used.
Medium for enrichment of marine litoautotrophic ammonia-oxidizing bacteria was mixed as
described by Koops et al. (2006).
Growth media for litoautotrophic ammonia oxidizers was made by mixing artificial seawater with
different minerals in order to obtain optimal growth conditions for marine nitrifiers (table 1).
Page
18Table 1: Ingredients list for marine ammonium media. All media was adjusted to pH 8 with NaOH before it was auto-claved.
Phenol red acts as an indicator if ammonium oxidation by turning the media yellow when below pH 7. The mixed and ready
to use media was stored at 5˚ C.
Seawater 40 ‰ 1000 ml
(NH4)2SO4 1320 mg/l
MgSO4⋅ 7H2O 200 mg/l
CaCl2 ⋅ 2H2O 20 mg/l
K2HPO4 114 mg/l
Chelated iron (13% Geigy Chemical) 1 mg/l
Na2MoO4 ⋅ 2H2O 1 µg/l
MnCL2 ⋅ 4H2O 2 µg/l
COCl2 ⋅ 4H2O 2 µg/l
CuSO4⋅ 5H2O 20 µg/l
ZnSO4⋅ 7H2O 100 µg/l
Phenol red (0,05%) 1 ml/l
After mixing all the ingredients the pH was adjusted to pH 8 with NaOH. Phenol red was added to
indicate growth. When ammonium is oxidized to nitrite the pH value will decrease due to the acidic
effect of nitrite. Phenol red turns the media yellow when pH drops below pH 7 thereby indicating
ammonium oxidation. All media was auto-claved and stored at 5˚ C.
Batch cultures were made up of 8 Erlenmeyer flasks with 200 ml of ammonium media at 28˚ C.
Every 14th day each batch culture was resuspended in 200 ml fresh media. For each flask
resuspension was done by centrifugation of 4x50 ml batch culture at 4700 g for 15 minutes. The
pellets were then transferred to new Erlenmeyer flasks with 200 ml of fresh ammonium media.
Samples of S. japonica were plated on DifcoTM Marine Broth 2216 agar plates and incubated at
room temperature (20-24 ˚ C) overnight. A colony from the agar-plate was then inoculated in 5 ml
marine broth media in a shaking bath at 28˚ C overnight. 500 µl overnight culture and 500 µl 50%
glycerol solution was transferred to a cryotube and mixed by vortexing. The cryotube was
transferred to a -80˚ C freezer for storage.
2.2 Doubling time of S. japonica.
A sample of the freeze culture was platted on a DifcoTM Marine Broth 2216 agar plate and
incubated overnight at room temperature. A colony from the agar plate was selected and inoculated
in 5 ml marine broth in a shacking bath at 28˚ C overnight. The overnight culture was then diluted
Page
191/50 and 1 ml of the dilution was transferred to 100 ml marine broth in an Erlenmeyer flask in a
shacking bath at 28˚ C. Samples were taken out and measured at OD600 every half hour for a total
of 7 hours.
The doubling time was calculated for an exponential function as estimated from the
mean values.
2.3 Effect of existing biofilm on colonization by S. japonica
To answer how preformed biofilm might affect the colonization by heterotrophic bacteria an
experiment designed to investigate how different coated surfaces might influence the exponential
growth rate of a biofilm. A coating of living biofilm from N. marina sp. 22 would represent active
nitrifying biofilm. To test if it might be the structural matrix of a film that makes it easier for
planktonic bacteria to colonize, bovine serum albumin (BSA) and gelatin was chosen to mimic the
rugged surface of a biofilm. The experiment would be made by three different setups. In setup 1 the
wells were coated with a biofilm from N. marina sp. 22. In setup 2 and 3 synthetic biofilm was used
made from BSA or gelatin. Each setups would be made up of an optically clear flat-bottom 96-well
plate (fig 4) divided into a positive or negative group with 4 replicates in each. The positive groups
would be coated with a biofilm and the negative groups would not be coated.
Figure 4: Picture of an optically clear flat-bottom 96-well plate used in the experiments.
Rows A,B,C and D in the optically clear flat-bottom 96-well plate were the negative groups and
was not coated with biofilm in any of the setups. Rows E, F, G and H were the positive groups and
were coated with different biofilm depending on the setup (fig. 5, fig. 6, fig. 7). Setup 1 contained
Page
20pre-formed biofilm from N. marina sp. 22. Cells were harvested from 50 ml batch culture. The
bacteria were transferred to 4.5 ml of ammonium media. A volume of 90 µl sterile ammonium
media was transferred to all wells in row A, B, C and D. A volume of 90 µl of the suspended
bacteria was transferred to each well in row E, F, G and H. The plate was incubated at 28˚ C for 7
days (fig 5).
Figure 5: An illustration the optically clear flat-bottom 96-well plate used in setup 1. The ÷ indicates wells where no biofilm
was present at the start of the experiment. Nm22 indicates preformed-biofilm formed by N. marina sp. 22 incubated for 7
days at 28˚ C.
In setup 2. and 3. the wells were coated with a synthetic film mimicking the structure of a biofilm.
This was done by coating the wells with 90 µl of a 1% solution of either BSA (fig. 6) or gelatin (fig.
7). Each plate was incubated at room temperature for 2 hours. As with setup 1 only row E,F,G and
H were coated with a film of either BSA or gelatin (fig. 6, fig. 7).
Figure 6: An illustration of an optically clear flat-bottom 96-well plate used in setup 2. The ÷ indicates wells where no
biofilm was present at the start of the experiment. BSA indicates wells coated with a synthetic film formed by a 2 hour
incubation of a 1% bovine albumin serum solution.
Page
21Figure 7: An illustration of an optically clear flat-bottom 96-well plate used in setup 3. The ÷ indicates wells where no biofilm
was present at the start of the experiment. Gelatin indicates wells coated with a synthetic film formed by a 2 hour incubation
of a 1% gelatin solution.
For each of the setup an overnight culture of S. japonica was diluted 1/100 in DifcoTM Marine Broth
2216 media and 90 µl of the solution was added to column 2-12. Sterile DifcoTM Marine Broth 2216
media was added to column 1 which acted as a negative control. The negative controls indicate
where no biofilm is present and would measure the absorbance if the plastic. Sj indicate where only
S. japonica is present. Mix indicates where the preformed-biofilm from N. marina sp 22, BSA or
gelatin was present together with S. japonica (fig 8).
Figure 8: An illustration of how all of the 3 setups were performed. A volume of 90 µl 1/100 dilution of a S. japonica overnight
culture was added to each well in column 2-12. Sj indicate where S. japonica was incubated without any preformed-biofilm.
Mix indicate where S. japonica was incubated with preformed-biofilm of either N. marina sp 22, BSA or gelatin. S. japonica
was not added to any wells in column 1. Column 1 would act as a negative control.
After one hour incubation at 28˚ C the medium was removed from column 2 and all wells were
colored with 100 µl 0.1% crystal violet for ten minutes. All wells in column 2 were gently washed 5
times with milli-Q water to ensure only crystal violet bound to biofilm was left. This procedure was
repeated for all columns with a 30 minutes interval. At the very last column 1 was emptied and
colored as described for the other columns. After all wells had been colored, 200 µl of 96% ethanol
was added to all wells and incubated for 10 minutes. Then 125 µl was added from each well to a
corresponding well in a new optically clear flat-bottom 96-well plate. Readings were performed by
Page
22a Bio-Tek Synergy HT at OD600. The exponential growth expressed as f(t) = f(t0)⋅(1+r)t, where r is
the exponential growth rate, would be used as a rate of biofilm production. The negative controls
and preformed biofilm indicate the background absorbance and would be constant throughout the
experiment. Only the growth of S. japonica was of interest and the background absorbance would
interfere with this. In order to avoid this the OD600 value of each negative control in column 1 was
subtracted from all wells in its corresponding row thereby only the growth of S. japonica would be
expressed.
2.4 Nitrification development
In order to describe how nitrification is developed as seen in many RAS an experiment with the
purpose to describe ammonium oxidation of AOB was designed. This would be done by comparing
the rate of ammonium depletion and the increase of nitrite. Also by introducing heterotrophic
bacteria to the system the expected inhibition of nitrification was to be measured as well.
N. marina sp. 22 was used as a model AOB and S. japonica was used as a model heterotrophic
bacteria.
2.4.1 Recirculating flow system setup
Eight glass tanks with 25 L of 0.2 µm filtered autoclaved seawater were setup in random order in a
17˚ C walk in climate room. All tanks were supplied with filtered air from sandstone bubbling. One
hundred floating bio filter tablets of the brand RK BioElements were autoclaved and added to each
tank increasing the surface area with 0,2941 m2. The start concentration was set to be 2.0 mg/L
TAN by adding 0.14873g NH4Cl (eq. 7)
(eq. 7)
⋅
⋅
⋅ ⋅
Eight x 50 ml of N. marina sp. 22 batch culture were centrifuged at 4700g for 20 min, resuspended
in 10 ml filtered seawater and added to each of the tanks.
Four samples of 5ml were taken out from each tank at day 1, 3, 5, 7, 12, 15, 18, 22, 25 and 28. All
samples were stored at -20˚ C until.
Page
23Before the samples were measured they were defrosted at 22˚ C for 2 hours. Samples were
measured for NH4+, NO2 with a Spectroquant® NOVA 60 (Merck Millipore). Measurements of pH
were done with a Metronohm pH 827 pH Lab pH meter. Calculation for TAN were done using the
Vant Hoff equation to find the equilibrium constant Keq for NH3/NH4+ at 22˚ C .
( )
( ) ( )
With Keq for 22˚ C [NH3] was isolated from eq. (9)
[ ]
[ ][ ]
[ ]
to get [NH3] in mg L-1 following calculation was made
[ ] .
The calculated values of NH3 were added to values of NH4+ in order to get TAN
The experiment was repeated 3 times but because of incoherent results the experiment was
terminated before any heterotrophic bacteria were introduced.
The experiment was optimized so that it could be easier controlled. Each experimental replica
would consist of three Erlenmeyer flasks that would be connected with silicon tubes then pumped
through the system disconnected and pumped back into each flask (fig. 9). This would create the
necessary flow conditions needed by AOB.
The experiment would be made with two different systems; one containing only N. marina sp. 22
and one with both N. marina sp. 22 and S. japonica. By comparing the expression of the amoA
gene by qPCR the ammonium oxidation would be described. For each experiment three replicates
were done. The rate of ammonium oxidation and the expression of rRNA and amoA would then be
compared.
From observations on the batch cultures it had been observed that N. marina sp. 22 primarily
existed in biofilm formed on the bottom of the flasks and in very small concentrations. Samples
were very difficult to obtain without harvesting cells from the entire flasks. The experimental setup
Page
24had to consist of flasks that could be removed completely for each sample taken. To do this the
experiment had to contain a flask for each planned sample that would then be connected. This
ensured that an entire flask could be taken out as a sample without altering the total concentration of
bacteria or TAN in the system.
For each experiment three Erlenmeyer flasks containing 150 ml of minimum marine media with the
carbon to nitrogen ratio of 1 (table 2) were pumped by a peristaltic pump at a rate of 0,1 ml/min.
The tubes were then connected and run through a bubble trap and then on through a flow channel
chamber. The tube would then separate into 4 tubes and transported back into the 4 Erlenmeyer
flasks (fig 9).
Figure 9: An illustration of one setup. The 4 Erlenmeyer flask are connected and the liquid passed through the peristaltic
pump onto the bubble traps. Here potential bubbles will be trapped, and no bubble will pass on to the flow channels. In the
flow channels biofilm can be viewed in a microscope. The tubes are then led back and split into 4 tubes which are then led
back into the Erlenmeyer flasks.
Samples were harvested by scraping the bottoms with a plastic scraper. The 150 ml was then
divided into three 50 ml tubes. Bacterial samples were harvested by centrifuge at 4700g for 20 min.
Page
25Measurements of NH4+ and NO2 were done on the supernatants using a Spectroquant® NOVA 60
(Merck Millipore). pH measurements were done on a Metronohm pH 827 ph Lab pH meter.
Table 2: Marine minimum media used for nitrogen inhibition experiment. Ratio of (NH4)SO4 and C12H22O11 was modified
from (Koops et al., 2006)in order to get the ratio Carbon/Nitrogen=1. Calculation of C/N=1 was done as described in (Zhu
and Chen, 2001)
Seawater 40 ‰ 1000 (ml)
NH4Cl 6 (µg/l)
C12H22O11 4 (µg/l)
MgSO4⋅ 7H2O 200 (mg/l)
CaCl2 ⋅ 2H2O 20 (mg/l)
K2HPO4 114 (mg/l)
Chelated iron (13% Geigy Chemical) 1 (mg/l)
Na2MoO4 ⋅ 2H2O 1 (µg/l)
MnCL2 ⋅ 4H2O 2 (µg/l)
COCl2 ⋅ 4H2O 2 (µg/l)
CuSO4⋅ 5H2O 20 (µg/l)
ZnSO4⋅ 7H2O 100 (µg/l)
Phenol red (0,5%) 1 (ml/l)
2.4.2 RNA isolation
RNA is very sensitive and unstable compared to DNA. Samples are easily contaminated if not
treated correctly. Because of this all equipment used for RNA isolation was treated with Sigma
RNaseZAP and the isolation was done under a fume hood
Because of the relatively low amount of N. marina sp. 22 cells harvested from each sample. This
protocol was adapted from the original TRI reagent protocol from Sigma Aldrich to insure a higher
output of RNA. This was done by increasing time of centrifugation and by modifying the wash with
75% ethanol.
50 ml samples were centrifuged for 20 minutes at 4700 rpm. Each pellet was collected and
resuspended in a 1.5 ml sterile Eppendorf tube with 500 µl TRI reagent and vortexed for 15
seconds. The homogenate of each sample was centrifuged at 12.000g for 10 min at 4˚ C. The
supernatant from each sample was transferred to new sterile Eppendorf tubes and left at room
temperature for 10 min. 200 µl of chloroform was added to the Eppendorf tubes and they were each
vortexed for 15 seconds and incubated for 15 min at room temperature. Each tube was then
centrifuged at 12.000g for 25 min at 4˚ C. The samples would then separate into three phases. The
bottom phase called the organic phase containing lipids and proteins, the interphase containing
Page
26DNA and the aqueous phase containing RNA. The aqueous phase was transferred to new sterile
Eppendorf tubes and 500 µl isopropanol was added to each. The samples were incubated for 10 min
at room temperature and centrifuged at 12.000g for 20 min at 4˚ C. The supernatant was removed
from each sample and the pellets were washed by storing them in 500 µl 75% ethanol at -20˚ C
overnight. The samples were then vortexed and centrifuged at 7.500 g for 5 min at 4˚ C. The
supernatant was removed from each sample and the eppendorf tubes were air dried for 10 min in a
fume hood without drying them completely since this would decrease solubility. The pellets were
then resuspended in 30 µl RNAase free H2O. 1 µl of each sample was measured for concentration
of RNA on a NanoDrop ND-1000 at 260 nm. Ratio of 260/280 nm did not exceed 1,7. This insured
that there was no DNA present.
2.4.3 cDNA synthesis
For cDNA synthesis First strand cDNA synthesis kit from Sigma-Aldrich was used.
All samples and other components were stored on ice at all times.
The following description is for one sample
0,5-1 µg of RNA (volume depends on the concentration of RNA for the specific sample) was added
to RNAase free H2O, and 1 µl of random hexamer primer to a total volume of 11 µl.
4 µl 5x Reaction Buffer, 1 µl RiboLock RNase Inhibitor (20 u/µl), 2 µl 10mM dNTP Mix, 2 µl M-
MuLV Reverse Transcriptase (20 u/µl) are mixed and added to the RNA. To a total volume of 20 µl
The sample was then placed in a T3000 Thermocycler with the following program
25˚ C 5 min Initiation of primer
42˚ C 60 min cDNA synthesis
70˚ C 5 min Termination of reaction
4˚ C ∞ min Storage
The finished cDNA was stored at -20˚ C
Page
272.4.4 quantitative real time PCR (qPCR)
To describe in what magnitude different genes are expressed specific primers designed from the
target gene are run in PCR. The general idea of how qPCR works is by having a fluorescent dye
included in the PCR reaction. The PCR product formed from each cycle of the reaction is then able
to be measured. As the reaction proceeds through each cycle, more and more product is formed
making the fluorescent signal stronger. The fluorescent dye SYBR green binds to the minor groove
of double stranded DNA and fluoresces 1000 times brighter when bound than when unbound. As
the PCR generates more double stranded product the SYBR Green signal increases.
The primers used in the present study would comprise of a primer targeting the cDNA from 16S
rRNA of S. japonica, a primer targeting the cDNA from 16S rRNA of N. marina sp. 22 and a
primer targeting the amoA cDNA of N. marina sp. 22. qPCR run on 16S rRNA would give a
reading of how strong a presence N. marina sp. 22 or S. japonica has. The primer targeting the
amoA gen was to determine how intense ammonia nitrifying was happening in N. marina sp. 22.
Primers:
Primers were designed using the primer design tool, Primer-Blast from NCBI.com
Each primer was optimized in order to find the optimal temperature for primer melting points.
A standard curve for each primer was made with the dilution factors described in table 2. Duplicate
analysis was done for each sample.
Table 3: Dilution factors of cDNA used for the qPCR standard curves.
Nm 22 rDNA 1/1 1/5 1/10 1/15 1/20 1/25 0(Control)
Nm 22 amoA 1/1 1/5 1/10 1/15 1/20 1/25 0(Control)
Sj rRNA 1/10 1/15 1/20 1/25 1/30 1/35 0(Control)
Page
28A mastermix was made by mixing 5 µl SYBR-green/ROX qPCR Master Mix (2X), 1 µl Forward
primer, 1 µl Reverse primer, 2 µl nuclease-free H2O for each sample.
Each sample was added 9 µl and 1 µl cDNA template. The controls were added 1 µl DNase free
H2O. Total volume for each sample was 10 µl. All samples were transferred to a 20 µl lightcycler
capillary. Each capillary was placed in a 4˚ C aluminum lightcycler centrifuge adapter and
centrifuged for 5 sec at 1000g before being placed in a Roche Lightcycler 2.0 for qPCR.
The Roche Lightcycler 2.0 was programmed to use the following programs:
Denaturation/Activation 95˚ 10 min
Amplification 45 cycles 95˚ 15 sec
PCR 64˚ 20 sec
72˚ 20 sec
Melting curves 95˚ 15 sec
60˚ 20 sec
95˚ 0 sec
Cooling/End 40˚ ∞
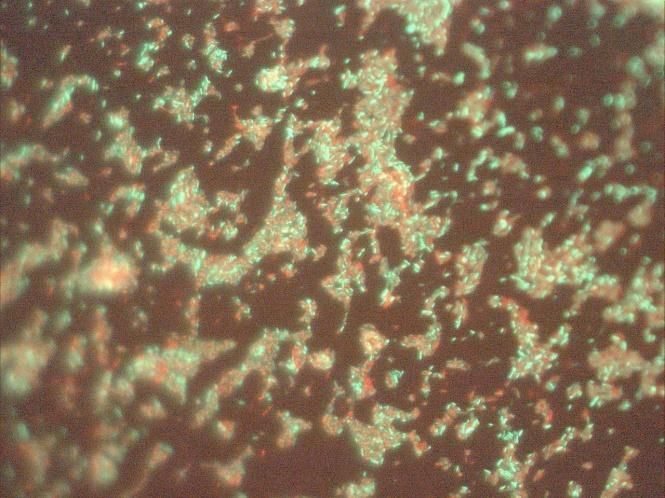
2.5 Live/dead staining
In order to visualize how biofilm from N. marina sp 22 is affected by S. japonica a live/dead
staining was done on biofilm formed in batch cultures containing N. marina sp 22 and on biofilm
from a batch culture containing N. marina and S. japonica. The LIVE/DEAD® BacLight ™
Bacterial Viability Kit, L70 2, was applied to both samples to visualize how S. japonica may have
strangled N. marina sp 22. The kit contains two dyes. SYTO®9 green-fluorescent nucleic acid strain
and the red -flourescent nucleic acid strain, propidium iodide. They differ in both their spectral
characteristics and in their ability to penetrate the membranes of healthy cells. SYTO®9 is able to
penetrate the membrane of living bacteria and bacteria with damaged membranes. Propidium iodide
is only able to penetrate damaged membranes. In healthy cells only SYTO®9 will be present giving
the healthy cells a green flourescnence. In cells with damaged membranes both SYTO®9 and
propidium iodide will be present. When both dyes are present red fluorescence from propium iodide
overpowers the green fluorescence from SYTO®9 giving damaged cells a red glow. This means that
Page
29when the dyes are used in conjunction healthy living cells will grow green and damaged seemingly
dead cells will glow red.
2 x 200 ml of N. marina sp. 22 batch culture was centrifuged at 4700g for 15 min. The pellets were
resuspended in 200 ml fresh ammonium media. One was inoculated with a 1/100 diluted S.
japonica overnight culture at 28˚ C for 24 hours. Both were then centrifuged at 4700g for 15 min
and the pellets were transferred to 100 μl 0,9% ice cold NaCl to remove interfering media
components. 1 μl of staining solution was added to both samples and incubated for 15 min in the
dark. Both samples were then loaded onto agarose slips on a microscope slide. Microscope slides
were prepared with 1% agarose solution. The staining solution was prepared by adding 5 μl of 3.34
mM SYTO®9 dye in DMSO (Compound A) and 5 μl of 20 mM prodpidium iodide in DMSO
(Compound B) to 20 μl sterile water. Samples were inspected using a Leica DM5000B microscope
with a mercury lamp. A filter cube with excitation filters 436, 535 and 630 nm was used to be able
to detect healthy and damaged bacteria.
Page
303 Results
3.1 Nitrification development
The ammonium oxidation was monitored by measuring the NH4+ and NO2 values for 28 days in
order to find the rate by which ammonium would be converted to NO2. As NH4+ was converted
NO2 levels should increase in a similar fashion. In order to describe ammonium oxidation total
ammonia nitrogen (TAN) had to be calculated. The mean values ± SD of NH4+, TAN, NO2 and pH
are shown in table 4.
Table 4: Data from the Nitrification development experiment. Values for NH4+, TAN, NO2 and pH for the entire experiment
(0-28 days) are shown as mean values ± SD. TAN has been calculated from measurements of NH4+, temperature and pH.
Time Mean NH4+ Mean TAN Mean NO2 Mean pH
[days] [mg L-1 ± SD] t0-28 d [mg L-1 ± SD] t0-28 d [mg L-1 ± SD] t0-28 d [pH ± SD] t0-28 d
0 1.9875 ± 0.1458 2.1730 ± 0.1592 0.0088 ± 0.0035 8.02 ±0.07
3 1.6400 ± 0.2922 1.7725 ± 0.3193 0.0175 ± 0.0084 7.95 ±0.09
5 1.3688 ± 0.4987 1.4873 ± 0.5405 0.0300 ±0.0141 7.99 ±0.05
7 1.0575 ± 0.4089 1.1326 ± 0.4338 0.0313 ±0.0125 7.91 ±0.10
12 0.8887 ± 0.3334 0.9644 ± 0.3625 0.0338 ±0.0151 7.98 ±0.06
15 0.8525 ± 0.3448 0.9205 ± 0.3691 0.0350 ±0.0160 7.96 ±0.05
18 0.4625 ± 0.2386 0.5169 ± 0.2404 0.0350 ±0.0160 7.91 ±0.08
22 0.3775 ± 0.2522 0.4052 ± 0.2681 0.0350 ±0.0160 7.93 ±0.07
25 0.4750 ± 0.2659 0.5098 ± 0.2829 0.0350 ±0.0160 7.92 ±0.08
28 0.0863 ± 0.0741 0.0921 ± 0.0792 0.0350 ±0.0160 7.90 ±0.07
3,0 2,5
Replicate 1 Mean TAN ± SD n=8
2,5 Replicate 2 f =2.1540*exp^(-0.0721*x)
2,0
Replicate 3
Replicate 4
2,0 Replicate 5
Replicate 6 1,5
TAN mg/L
TAN mg/L
Replicate 7
1,5 Replicate 8
1,0
1,0
0,5
0,5
0,0 0,0
0 5 10 15 20 25 30 0 10 20 30
Days
Days
Figure 10: To the left all the calculated TAN values are plotted as a scatter plot for all 8 replicates. To the right the calculated
mean value of TAN ± SD (n=8) is plotted
Page
31The calculated values of TAN are plotted as a scatter plot and as mean values ± SD (fig. 10). The
standard deviations are very large on most samples making it hard to make a definitive description
of TAN decay. The plotted mean values did however show an overall trend of exponential decay.
0,06 0,06
Replicate 1
Replicate 2
mean NO2 ± SD n=8
0,05 Replicate 3
Replicate 4
0,05
Replicate 5
Replicate 6
0,04 Replicate 7
Replicate 8 0,04
NO2 mg/L
NO2 mg/L
0,03
0,03
0,02
0,02
0,01
0,01
0,00
0,00
0 5 10 15 20 25 30 0 5 10 15 20 25 30
Days Days
Figure 11: To the left are all measured values for NO2 plotted as a scatter plot for all 8 replicates. To the right are the mean
values ± SD has been plotted.NO2 was expected to increase proportional with the decrease of TAN but only a small rise was
observed se figure 11. The standard deviations of NO2 are very large and the increase in concentration very small. This might
indicate the NO2 is converted to something else directly after being produced.
Page
32You can also read