The Contribution of Traditional Meat Goat Farming Systems to Human Wellbeing and Its Importance for the Sustainability of This Livestock Subsector
←
→
Page content transcription
If your browser does not render page correctly, please read the page content below
sustainability

Article
The Contribution of Traditional Meat Goat Farming
Systems to Human Wellbeing and Its Importance for
the Sustainability of This Livestock Subsector
Eduardo Morales-Jerrett 1 , Juan Manuel Mancilla-Leytón 2 , Manuel Delgado-Pertíñez 1                   and
Yolanda Mena 1, *
 1    Departamento de Ciencias Agroforestales, Escuela Técnica Superior de Ingeniería Agronómica,
      Universidad de Sevilla, 41013 Sevilla, Spain; jerrett@us.es (E.M.-J.); pertinez@us.es (M.D.-P.)
 2    Departamento de Biología Vegetal y Ecología, Facultad de Biología, Universidad de Sevilla,
      41012 Sevilla, Spain; jmancilla@us.es
 *    Correspondence: yomena@us.es; Tel.: +34-954486449

 Received: 17 December 2019; Accepted: 4 February 2020; Published: 6 February 2020

 Abstract: Traditional meat goat farming systems are characterized by rearing autochthonous breeds
 and using natural resources through grazing, often within protected natural areas. In a context of
 reduction of the number of farms, due to the low income derived from the sale of kids, the role of
 those systems as suppliers of presently non-remunerated ecosystem services becomes more relevant.
 The objective of this article is to analyze the current situation of those systems, focusing on their
 connection with human wellbeing, and to formulate proposals that can contribute to guaranteeing
 their profitability and continuity. A technical-economic and environmental study of a sample of farms
 and an analysis of the limiting factors affecting the subsector were carried out. As a result, a set of
 multifactorial problems was identified, with the lack of acknowledgement and remuneration of some
 services—mainly environmental and cultural—provided by those systems and the low selling price
 of kids standing as the main threats. The consideration of meat goat farms as “producers of meat of
 high functional quality and providers of ecosystem services”, which should be properly quantified
 and remunerated, would contribute to their preservation and guarantee the provision of benefits
 associated with the activity.

 Keywords: autochthonous goat breeds; ecosystem services; pastoralism; Natura 2000 network;
 profitability; carbon footprint

1. Introduction
      The main objective of any civilization or form of government should be to achieve and secure
people’s welfare—the essential components of which are: Access to material wellbeing; health, social
relationships; security; and freedom of choice and action [1]. Achievement of this objective is contingent
on the availability and quality of the social capital, technology, and institutions of that society—but also,
and very intimately, on the services provided by its ecosystems [2]. The former are easily identified,
but this is not the case with the latter, which are usually disregarded, especially in economically
developed societies, despite the fact that the whole system is built upon nature. On the one hand,
ecosystems are the source of all the materials and energy that are processed and transformed into
consumption goods and services. On the other, they are the sink for all the waste generated by economic
activities [3]. Therefore, ecosystems may be analyzed from an economic-ecological perspective as
natural capital, a term that was coined in the 1990s and represents the goods and services provided by
ecosystems that help improve people’s quality of life [4]. Understanding ecosystems as natural capital,

Sustainability 2020, 12, 1181; doi:10.3390/su12031181                         www.mdpi.com/journal/sustainability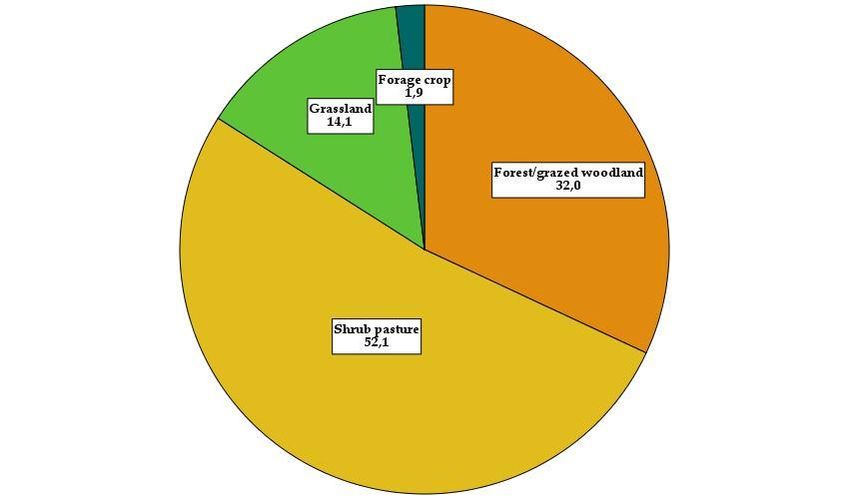
Sustainability 2020, 12, 1181                                                                          2 of 23

Gómez-Baggethun and De Groot [3] define the “products of their structure and functioning that have
a potential or real incidence on human wellbeing” as ecosystem functions and services. Functions
are elements that are potentially capable of generating services that contribute to the improvement of
people’s quality of life. Services are specific benefits with a real impact on the citizens.
      According to De Groot et al. [5], mainstreamed by the Millennium Ecosystem Assessment,
ecosystem services (ES) are classified into four categories: Provisioning, regulating, supporting,
and cultural. Provisioning services are products directly obtained from the ecosystems (for instance,
food, fresh water, wood, cellulose or genetic resources). Regulating services are benefits indirectly
obtained from ecosystem processes (for instance, climate regulation, flood control or water purification).
Cultural services are immaterial and intangible contributions made by the ecosystems to human
experience (for instance, spirituality, recreation and tourism, esthetic enjoyment, education, sense of
identity or cultural heritage). Supporting services category has been questioned because it could lead
to double counting since its value is reflected in the other three types of services.
      The various contributions of the ecosystems to human wellbeing are not adequately acknowledged
or valued; consequently, they are not considered in commercial circuits or political decision-making
processes [6]. This fact is an enormous competitive disadvantage for those activities that create
frameworks—in this specific case, agroecosystems—favoring the provision of beneficial services to
people. These services are neither remunerated in the market or via policies, nor included in the cost
structure of other less sustainable activities.
      In the last decades, the disappearance of many pastoral uses of the territory has revealed the
importance of sustainable livestock management for environmental conservation. The abandonment or
progressive decline of pastoralism has had negative consequences for biodiversity and ES, especially in
marginal areas traditionally used for that activity [7]. In many ecosystems, with a deep-rooted grazing
tradition, the complete exclusion of livestock rearing has brought about changes in the richness and
diversity of species, favoring an increase of woody vegetation, and consequently, biomass fuel [8–10].
In addition, the abandonment of livestock farming has led to the modification of certain interspecies
interactions (affecting, for instance, pollinators, herbivorous insects, parasitoids, etc.) [8,11–13]. In this
sense, a recent report of the European Commission pointed to the decline of traditional grazing
activities as one of the main threats, in large areas of Europe, to the objectives of the Natura 2000
network concerning the conservation of agricultural habitats [14]. There is an increasing number of
studies showing that good management practices in livestock husbandry are key for the resilience,
sustainability and preservation of biodiversity in pastoral ecosystems, especially in rural and mountain
areas, where goat production plays a relevant role.
      Goat husbandry has had its own evolution in this period. This livestock subsector did not
participate in the first great revolution in European agriculture and livestock farming, which took place
in the 19th century. During this period, agricultural activities were intensified in order to meet the
demands of the growing urban population. Milk and dairy products were mainly supplied by dairy
cow farms, while the goat sector remained active in marginal and usually poorer areas [15]. In these
regions, many of which (including Andalusia) were located in the Mediterranean basin, where arable
land is quite limited, food derived from livestock production was very important [16]. Goat rearing,
based on grazing and the use of natural resources, was essentially limited to the production of one
30–40 kg kid, as well as cheese for self-consumption [17].
      From the 1980s onwards, interest in the production of goat milk increased, especially in developed
countries, such as France and Spain. However, a series of socioeconomic and legislative changes took
place following Spain’s and other Mediterranean countries entry into the European Common Market,
in order to adapt to the European framework. In fact, the strict European legislation on food quality
and food security issues and the concern of obtaining growing volumes of milk per farm led to the
intensification of production and the decline of grazing livestock systems [17]. As a result, despite the
fact that pastoral goat husbandry is nowadays the main feasible economic and productive activity in
Mediterranean mountain areas of Spain and elsewhere, where the climatic and soil conditions hinder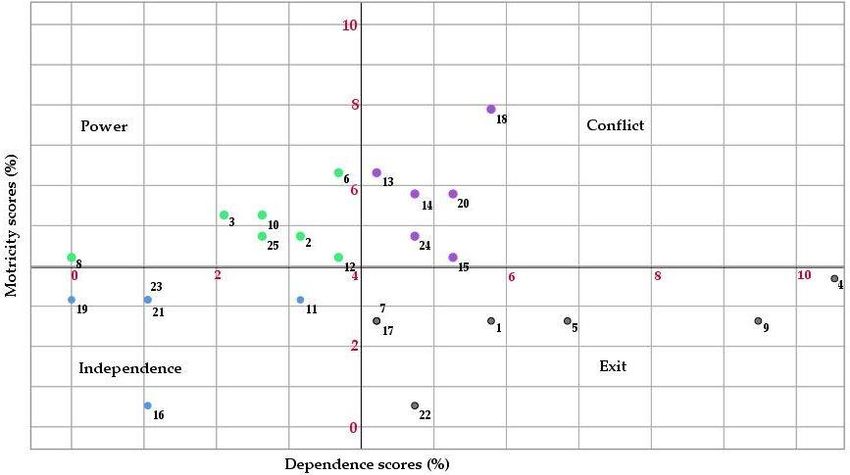
Sustainability 2020, 12, 1181                                                                          3 of 23

the development of other agricultural and/or livestock-rearing activities, the above-mentioned process
of milk specialization has progressively broken the link between this sector and the territory where it
is based. For example, the findings of Mena et al. [18], indicated that, in the 1990s, most of the goat
farming systems in central-western Andalusia were highly extensive, but Castel et al. [19] affirmed
that in 2010 up to 47% of the farms were intensively or semi-intensively managed. On the other hand,
Pulina et al. [20] have revealed that the grazing livestock population in Spain has dropped by almost
50% in the last 25 years.
      One part, albeit small, of the goat-rearing sector in Andalusia has not undergone the milk
specialization or management intensification processes. This part is represented by the traditional
meat-producing systems, based on the use of very rustic endangered breeds that are less apt for
milking than the rest of the autochthonous Andalusian breeds. Among these breeds, the Blanca Serrana
Andaluza or Serrana (hereinafter Blanca Serrana), the Negra Serrana or Castiza (hereinafter, Negra
Serrana), and to a lesser extent, the Blanca Celtibérica deserve to be highlighted [17]. In Andalusia,
most meat goat farms are located in areas that belong to the Andalusian Network of Protected Natural
Areas, mainly in the sierras of Jaen, Granada and Huelva. Many of them are managed following a
certified organic production model.
      These goat farms are faced with a serious problem concerning the commercialization of its main
product: The kid, which has to compete in the market with kids from dairy goat breeds. The total
per capita consumption of fresh meat in Spain amounted to 33.8 kg in 2018 [21]. However, domestic
consumption of fresh sheep and goat meat (which are combined in the statistics) is still the sector’s
primary challenge. This segment has performed quite poorly in recent years. In 2008, the per capita
consumption reached 3.4 kg, but ten years later, in 2018, it had dropped to 1.36 kg. As regards kid meat,
the estimated per capita consumption is 0.3–0.5 kg. Lamb/kid meat is considered expensive (6.8 on a 0
to 10 scale), and is mostly consumed on family gatherings at special occasions [22]. Suckling kid meat
is the preferred goat carcass in Spain; it originates from animals fed only on milk and slaughtered aged
35–45 days at 8-10 kg live weight [23–25].
      In contrast to the loss of importance as meat suppliers, pastoral meat-oriented goat farms
are considered important providers of “environmental services”. However, this has rarely been
the object of study by the scientific community. The literature devoted to describing the activity,
analyzing its contribution to the conservation and management of the territory, identifying its challenges,
and proposing specific actions, is very limited. The low selling price of kids and the lack of remuneration
of other ecosystem services has resulted in a lack of profitability, and in the progressive reduction of
the number of livestock farms implementing traditional meat production models. In addition, there
are other complex and multifactorial problems contributing to the disappearance of this livestock
subsector. In brief, the main objective of this work is to analyze the general situation of traditional
meat goat systems in Andalusia, focusing on their relationship with human wellbeing, and to define
proposals that can contribute to guaranteeing profitability and continuity. For the achievement of this
general objective, the article suggests to fill the existing void of information through: (i) The description
of the subsector, including the identification of the main environmental services provided by it; (ii) the
analysis and hierarchization of the factors limiting the activity; and (iii) the proposal of specific actions
aimed at obtaining the acknowledgement of these breeds as “environmental”.

2. Materials and Methods

2.1. Study Area and Breeds
     Andalusia, the southernmost autonomous region in Spain (36◦ N–38◦ 440 N and 3◦ 500 W–0◦ 340 E),
covers an area of 87,600 km2 and is structured around four geomorphological units: The Guadalquivir
river valley; the coast; Sierra Morena-Los Pedroches; and the Baetic mountains and valleys [26].
The Baetic depression has fertile soils and is characterized by its high agricultural production.
The mountains comprise a heterogeneous system with different states of ecological maturity and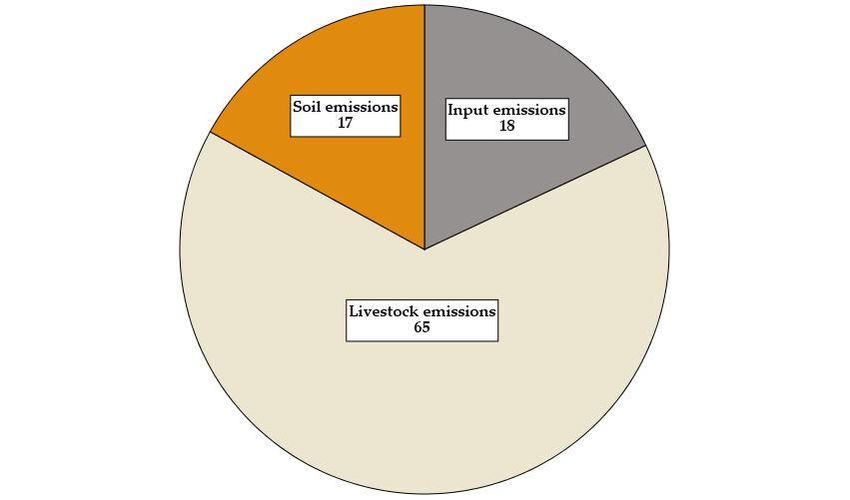
Sustainability 2020, 12, 1181 4 of 23
grazing as its main economic activity. Andalusia has a population of 8.4 million, 23% of which is
considered rural. This percentage, which is higher than the national average of 16%, has significantly
decreased during the last decade [27].
Sustainability 2020, 12, 1181 4 of 23
Up to 32% of the Andalusian area (2,670 km2 ) belongs to the Natura 2000 network (European
Habitats UpDirective,
to 32% ofCouncil Directivearea
the Andalusian 92/43/EEC)
(2,670 km and 2) includes
belongs to 243 protected
the Natura 2000areasnetwork
(Figure 1), which are
(European
the outcome
Habitats of an intricate
Directive, Councilrelationship between and
Directive 92/43/EEC) social and ecological
includes systems
243 protected areas[28]. Many
(Figure 1), of those
which
protected
are the outcome of an intricate relationship between social and ecological systems [28]. Many of thosethe
areas are located in mountain and difficult access areas, which are the natural habitat of
goat breeds areas
protected studied arein this work.
located The Negra
in mountain andSerrana
difficultbreedaccessisareas,
exclusively
which arefound
the in the province
natural habitat of ofthe
Jaen,
particularly
goat breeds within
studiedtheinSierras de Cazorla,
this work. Segura
The Negra y Lasbreed
Serrana VillasisNatural Park.found
exclusively The Blanca
in the Serrana
provincebreed of
is Jaen,
distributed
particularly within the Sierras de Cazorla, Segura y Las Villas Natural Park. The Blanca Serrana in
throughout Andalusia, but lives preferably in mountain areas [29]. Thus, it is found
the Dehesa
breed de Sierra Morena
is distributed throughoutBiosphere Reserve,
Andalusia, the Sierras
but lives de Cazorla,
preferably in mountainSegura y Las
areas Villas
[29]. Thus, Natural
it is
Park,
foundandinin theneighboring areas Morena
Dehesa de Sierra of the province
Biosphere of Reserve,
Granada,the such as, for
Sierras de instance, the Sierra
Cazorla, Segura y Las deVillas
Castril
Natural
Natural Park,
Park and in1).
(Figure neighboring areas of the province of Granada, such as, for instance, the Sierra
de The
Castril Natural
Sierras Park (Figure
de Cazorla, 1). y Las Villas Natural Park (province of Jaen, southeastern Spain) is
Segura
The Sierras
characterized degreat
by its Cazorla, Segura (2143
extension y Las km 2 ) and
Villas Natural Park
a wide (province
variety of Jaen, southeastern
of landscapes: River valleysSpain)and
is characterized by its great extension (2143 km 2) and a wide variety of landscapes: River valleys and
meadows, mid-mountain areas, high plateaus and high mountain areas [30]. Extension and diversity
meadows,
also condition mid-mountain
the climaticareas, high plateaus
variability within theandpark highandmountain
its highareas [30]. Extension
rainfall levels, whichand are
diversity
among
thealso condition
highest in the the climatic
south variability
of the within the park
Iberian Peninsula. andsecond
It is the its highnatural
rainfallpark
levels,
in which
Europeare in among
terms of
the highest
plant in thebeing
biodiversity, souththeof the
homeIberian
of 35Peninsula. It is theand
endemic species second
110 natural parkAndalusian
exclusively in Europe inspecies
terms of [31].
The tree story is mostly made up of pinewood (Pinus nigra), but there are relics of Mediterranean[31].
plant biodiversity, being the home of 35 endemic species and 110 exclusively Andalusian species forest
The tree story is mostly made up of pinewood (Pinus nigra), but there are relics of Mediterranean
and formations of singular deciduous species (Corylus avellana, Quercus faginea, Q. rotundifolia and
forest and formations of singular deciduous species (Corylus avellana, Quercus faginea, Q. rotundifolia
Q. pyrenaica). Plant communities are generally dominated by sclerophyllous woody plants with an
and Q. pyrenaica). Plant communities are generally dominated by sclerophyllous woody plants with
herbaceous or shrubby understory [32], the exploitation of which is especially important to maintain
an herbaceous or shrubby understory [32], the exploitation of which is especially important to
goat farming.
maintain goat farming.
Figure1. 1.Natura
Figure Natura2000
2000network
network (dark
(dark areas)
areas) and
and distribution
distributionof
ofthe
thearea
areaofofstudy
study(highlighted
(highlightedwith
with
lines) in Andalusia (Spain).
lines) in Andalusia (Spain).
The Dehesas de Sierra Morena Biosphere Reserve (4244 km2) (southwestern Spain) comprises
the Aracena and Picos de Aroche Natural Park (in the province of Huelva), the Sierra Norte Natural
Park (in the province of Seville), and the Sierra de Hornachuelos Natural Park (in the province of
Córdoba). The most representative and common landscape of the reserve is the dehesa, a uniqueSustainability 2020, 12, 1181 5 of 23
The Dehesas de Sierra Morena Biosphere Reserve (4244 km2 ) (southwestern Spain) comprises
the Aracena and Picos de Aroche Natural Park (in the province of Huelva), the Sierra Norte Natural
Park (in the province of Seville), and the Sierra de Hornachuelos Natural Park (in the province of
Córdoba). The most representative and common landscape of the reserve is the dehesa, a unique model
of sustainable development and an example of popular wisdom, which over the centuries has provided
access to multiple natural resource uses—combining in a harmonious and balanced way agricultural
uses with stockbreeding, hunting and forestry [33]. The reserve includes large areas of chestnut forests
(Castanea sativa) and cork oak forests (Q. ilex and Q. suber), surrounded by pastures, meadows
and Mediterranean scrub, creating an exceptional mosaic of landscapes [34,35]. These landscapes
contain very high biodiversity, including some of the most emblematic species of the Mediterranean
ecosystems, such as the Iberian Lynx, the Spanish Imperial Eagle, or the Eurasian Black Vulture [36,37].
The current Andalusian population of the Negra Serrana breed is 814 animals (46.6% of the total
population in Spain), according to the herd-book. They are distributed among seven farms (all of them
within the province of Jaen), with average flocks of 117 goats. As regards the Blanca Serrana breed, its
population in Andalusia is estimated at 7176 goats (93% of the total national population), distributed
among 38 farms with average flocks of 176 animals [29].
2.2. Technical-Economic Characterization of the Monitored Farms and Calculation of the Carbon Footprint
From the above-mentioned 45 meat goat farms based in Andalusia (Negra Serrana and Blanca
Serrana breeds), a sample of five (10% of the total farms) was selected: Three of them rearing the
Blanca Serrana breed and the other two rearing Negra Serrana flocks. The selection of those farms was
made according to the following criteria: (i) Representativeness of the production model, management
practices and variety of ecosystems; (ii) data gathering and registration routine; (iii) training of the
farm’s manager; and (iv) good disposition and collaborative spirit.
According to the authors’ previous experience [38–40], the farms selected were monitored monthly
during 2018 in order to collect technical-economic and environmental information, as well as to
calculate relevant indicators. Among the indicators, the following two deserve highlighting: (i) Net
margin: Incomes for market plus coupled aid minus Total cost excluding family labor cost; and (ii) Net
Economic Margin: Net margin minus family labor cost. For their estimation, neither the income from
decoupled aid nor the differences in the inventory of the current stock were taken into account.
The carbon footprint was determined in the way described by Gutiérrez-Peña et al. [40]. For the
calculation of greenhouse gas (GHG) emissions, the scope of the study was defined as “from cradle
to gate”, and all the emissions produced at the farm, including livestock emissions, managed soil
emissions, etc., were considered. The emissions associated with the manufacturing and transportation
of every input of the system (fertilizers, feed, etc.) were also taken into account. Machinery, buildings,
medicines and other minor stable supplies were excluded from the assessment. The IPCC [41]
guidelines have been followed. The emissions are expressed in CO2 equivalents calculated using the
IPCC 100-year global warming potentials (GWP) for CH4 and N2 O, which are, respectively, 25 and 298.
In addition to GHG emissions, the carbon sequestration by the vegetation of pastoral ecosystems was
calculated with the methodology developed by Petersen et al. [42], which takes into account a 100-year
perspective to allocate soil C changes, as well as the GWP of the livestock emissions. The values have
been calculated for two different functional units: (i) One kilogram of live weight at slaughter (LWS)
for kid goats; and (ii) 1 ha of usable land for grazing (ULG) at the goat farm [40]. The principles of
allocation applied were economic, based on the sale of kids of around one month of age and 10 kg live
weight. No other income sources were evident within the scope of the study (animals and manure
sale), and the allocation of the carbon footprint to meat varied by farm and year from 88% to 100%,
with an average of 97%.
For the technical-economic and carbon footprint variables, descriptive statistics (mean, minimum
and maximum values) were determined using SPSS software for Windows (version 26.0, IBM Corp.,
Armonk, NY, USA).Sustainability 2020, 12, 1181 6 of 23
2.3. Structural Analysis of the Problems Affecting the Meat-Oriented Goat Subsector
For the purpose of developing a problem resolution methodology in an orderly and efficient
manner, a structural analysis of a set of factors limiting the activity has been carried out following the
proposal elaborated by Godet [43] and adapted by Mojica [44]. Structural analysis is a tool designed
to structure collective reflection. It offers the possibility of describing a system with the help of a
matrix that relates all the problems (hereinafter referred to as variables) to each other. Based on that
description, the method aims at revealing the main influential and dependent variables, i.e., those that
are essential to the evolution of the system. According to Godet [45], the analytical method is divided
into the following phases: (i) Elaboration of a list of variables; (ii) description of the relationship
between variables; and (iii) identification of the key variables. The implementation and development
of those phases in relation to the present work are described below:
(i) In order to identify the variables, a focus group was conducted in Cordoba (Spain) as part of
a training workshop organized by ABLANSE (National Association of Blanca Serrana Goat
Breeders) under the title “Analysis of the Evolution of Breeds and Future Prospects”. A round
table and a group dynamic were included in the program and joined by a small group of people
(20): Academic staff of the University of Seville and the University of Cordoba, as well as
technicians and farmers belonging to ABLANSE and ANCCA (National Association of Negra
Serrana Castiza Goat Breeders). The discussion focused on the identification and analysis of the
factors limiting meat goat husbandry and conditioning its continuity. A selection of the factors
considered to be most relevant was then made. In parallel, consultations were held with expert
operators within the subsector.
(ii) For the description of the relationship between the different variables, the direct effects that some
of them have on others were identified. Treating each variable independently, they were all
confronted with the rest. If an influence was observed, the variable was assigned the value 1;
otherwise, it was assigned the value 0. Thus, a binary table was created where the variables were
confronted, and the scoring was registered.
(iii) Finally, the key variables of the system were identified through the calculation of the motricity
index (MI, indicating the number of times one variable has influenced the others), and the
dependence index (DI, indicating the number of times one variable has been affected by the
others). These key variables were grouped into four areas or types of problems (Power, Conflict,
Exit and Independence). Later on, a chart was designed to show the distribution of the variables
on the plane. The chart was divided into four zones limited by the average value, calculated using
the 100/n formula, n = 25 being the number of variables considered. Each quadrant corresponded
to a type of problem or limiting factor:
• Power Zone: This zone comprises factors that have an influence on the rest, but are not
affected by them. They are hardly vulnerable, but their resolution would have a positive
impact on the whole system (MI > 4% > DI).
• Conflict Zone: The problems included herein have an influence on the others, but are also
very dependent on them. They are influential, as well as vulnerable. As stated by Mojica
(44), any variation in these factors would have a great impact on the exit problems, but also
on themselves (MI > 4% < DI).
• Exit Zone: The problems in this zone will only be reduced or solved if actions are taken in
relation to the two previous categories. They are the outcome of those two groups, and are
therefore, dependent on them (MI < 4% < DI).
• Independence Zone: These are autonomous factors that are not clearly part of the system.
They have very little influence or dependence on the rest. Their resolution may be important,
but will have no effect on the system (MI < 4% > DI).Sustainability 2020, 12, 1181 7 of 23
Once this classification was made, the key variables (hierarchized limiting factors) that need to be
analyzed for the development of action plans were identified.
3. Results
3.1. Technical-Economic and Environmental Analysis of the Sample of Farms
Table 1 reflects the general characteristics of the farms analyzed. The size of the flocks varies by
farm: In two of the farms, it is below the average set by the corresponding association of breeders
(117 goats for the Blanca Serrana breed, and 176 goats for the Negra Serrana breed), while in the
remaining three it is above that average. The amount of work associated with the activity is small and
established for these five farms at an average of 0.43 annual work units (AWU), which, if expressed in
the number of goats, corresponds to 546/AWU. It is important to underline that there are no women
working on these farms and that most of the labor is provided by the family (69.3%), while hired labor
is mainly used temporarily during the kidding season.
Table 1. General characteristics of the monitored farms.
Item Mean Minimum Maximum
Goats (No.) 217 118 366
Area used by the goats (ha) 285.4 51.0 630.0
1 Goat stocking density (LSU ha−1 ) 0.25 0.09 0.78
2 Work associated with the activity (AWU) 0.43 0.15 0.67
Kids born goat−1 0.86 0.66 1.07
1 LSU: Livestock standard unit, one goat equals 0.15 LSU; 2 AWU: Annual work unit.
Livestock density is low (0.25 LSU ha−1 ), and the presence of other species on the farm is frequent,
mainly sheep and cattle, sometimes also pigs. In these systems, the main source of feed is grazing.
The area of natural vegetation is large, with an average of 1.29 ha goat−1 , most of which are covered by
shrub pasture (52%) (Figure 2). The surfaces devoted to crops destined to feed the goats are small.
Oats and vetch or clover are usually grown in those areas, as a supplement for the summer, when the
availability of natural resources is limited. Two of the monitored farms do not have such areas, and the
other three only grow crops to be grazed, rather than to produce grains or fodder to be consumed
indoors. The goats graze the natural resources, especially those in the shrubby understory, under
extensive conditions and throughout the year. In the forest story, the presence of oaks (Quercus ilex L.)
is to be highlighted, while the shrubby understory, which is the most important one, consists of a wide
range of species (rockrose, mastic tree, myrtle, narrow-leaved mock privet, etc.). In order to facilitate
the monitoring and avoid the damage caused by predators, the goats have their grazing limited a
few days before kidding and during the lactation period. Consequently, during this period, the goats
receive a supplement of concentrates, compound feed, and/or fodder of varying quality.
The sale of kids is the main, and in many cases, the only market income of meat-oriented pastoral
goat farms. These kids are aged 35–45 days and their maximum average weight is 10 kg live weight.
Despite their importance in the results account, the average number of kids born per doe is low (0.86,
Table 1), while the average number of kids sold per doe present on the farm is even lower, 0.62.
Table 2 shows the main economic indicators of goat farming. Despite the fact that these farms are
raising pure-breed animals registered in the corresponding herd-book, the sale of animals for further
rearing is important for only two of the monitored farms, and not at all for another three. On average,
during 2018, the income per goat and year earned from the sale of live animals for replacement was
only 7.4 euros. If the aid is excluded, the remaining amount is considered residual income (Table 2).Sustainability 2020, 12, 1181 8 of 23
Table 2. Main economic indicators of the monitored farms.
Euros Goat−1 Euros ha−1
Item
Mean Minimum Maximum Mean Minimum Maximum
Income from the activity
Sale of goat kids 25.44 9.60 37.20 38.36 7.50 125.49
Sale of animals for further rearing 7.40 0.00 29.80 5.62 0.00 23.33
Other income 2.94 0.00 6.60 3.82 0.00 9.80
Total market income 35.78 30.80 42.30 47.82 20.19 135.29
Income from coupled aid 26.89 12.49 41.94 39.86 6.92 120.39
Income from market+ coupled aid 62.67 54.80 81.34 87,68 30.30 255.70
Income from decoupled aid 18.39 0.00 44.06 35.07 0.00 129.39
Total income (market + aid) 81.06 54.80 125.80 122.75 30.28 385.09
Cost of the activity
Feed (purchased + crops) 18.96 0.00 38.40 25.28 0.00 64.41
Health 2.00 0.80 4.70 4.95 0.46 20.70
Energy 5.38 0.00 9.80 7.98 0.00 23.53
Hired labor 13.04 0.00 32.80 9.81 0.00 30.55
Other costs 16.28 4.90 46.10 21.29 4.44 55.90
Family labor 19.02 4.20 34.50 33.57 2.43 120.47
Amortization 0.64 0.00 2.00 1.91 0.00 8.82
Total costs 75.32 44.30 101.70 104.79 24.53 293.84
Economic indicators
1 Net margin 6,37 −27.40 34.30 16.46 −25.52 81.74
2 Net Economic Margin −12,65 −32.50 10.50 −17.11 −39.05 5.81
1 Net Margin: (Income form market + Income from coupled aid)—(Total cost - Family labor cost); 2 Net Economic Margin: Net margin—Family labor cost. For their estimation, neither the
income from decoupled aid nor the differences in the inventory of the current stock were taken into account.Sustainability 2020, 12, 1181 9 of 23
Sustainability 2020, 12, 1181 8 of 23
Figure 2. Distribution of the area devoted to feeding the goats (%).
The
Table percentage
2 shows the of income derived indicators
main economic from aid varies
of goatfrom 23% to
farming. 69% ofthe
Despite thefact
total:
thatItthese
shows the
farms
high dependence
are raising of these
pure-breed farms on
animals EU aid (Table
registered in the 2). These incomes
corresponding come mainly
herd-book, from:
the sale of(i) The Basic
animals for
Payment
further rearingScheme is (decoupled
important for payment
only two from First Pillar of
of the monitored the Common
farms, and not atAgricultural
all for another Policy, CAP);
three. On
(ii) aid to during
average, livestock farming
2018, in mountain
the income per goatareasand
(coupled paymentfrom
year earned fromthe thesale
FirstofPillar
live of the CAP);
animals for
(iii) maintenance
replacement wasof endangered
only 7.4 euros.pure autochthonous
If the aid is excluded, breeds (measure 10.1.2
the remaining amount of the Rural Development
is considered residual
Program,
income (Table RDP, 2). of Andalusia); (iv) maintenance of ecological agriculture and husbandry practices and
methods (measure 11.2.1
The percentage of thederived
of income Andalusianfrom RDP); andfrom
aid varies (v) aid
23%to to
areas
69%with natural
of the total: Itorshows
other thespecific
high
constraints (measure 13 of the Andalusian RDP). In addition,
dependence of these farms on EU aid (Table 2). These incomes come mainly from: (i) The Basic one of the farms receives a subsidy
from
Payment the provincial administration
Scheme (decoupled payment of Jaen.
fromTable 2 differentiates
the First between revenue
Pillar of the Common fromPolicy,
Agricultural coupled and
CAP);
decoupled aid.
(ii) aid to livestock farming in mountain areas (coupled payment from the First Pillar of the CAP);
(iii) Within
maintenance the costofstructure,
endangered the little
purerelative importance
autochthonous of feed
breeds expenditure,
(measure 10.1.2whichof the includes
Rural
purchased
Development feedProgram,
and crops,RDP, is to beof noticed (Table(iv)
Andalusia); 2). The average is of
maintenance 25.2%, although
ecological the variability
agriculture and
among
husbandry the five farms and
practices analyzed
methods is high. The expenses
(measure 11.2.1 ofassociated with health
the Andalusian RDP);treatments
and (v) aid andto energy
areas withare
low,
naturalas isorthe costspecific
other of amortization.
constraintsThe few infrastructures
(measure requiredRDP).
13 of the Andalusian and the Inlow level of
addition, oneinvestment
of the farms in
the activity
receives explainfrom
a subsidy this fact.
the provincial administration of Jaen. Table 2 differentiates between revenue
fromThe mainand
coupled economic
decoupledindicators
aid. of the activity are also included in Table 2. It is to be highlighted
that, for theirthe
Within estimation, neither the income
cost structure, from decoupled
little relative importance aidofnorfeed
the differences
expenditure, in the
whichinventory
includes of
the current feed
purchased stockand were takenisinto
crops, account.
to be noticedExcept
(Tableon 2).one
Thefarm,
averagethe indicator
is 25.2%, “Net Economic
although Margin”
the variability
among
is negative.the five farms analyzed is high. The expenses associated with health treatments and energy
are low,
As for as the
is the cost of of
calculation amortization. The few infrastructures
the carbon footprint, total emissions required
are shown andin the
Table low levelthe
3, and of
investment inper
contribution thepolluting
activity explain
source isthisalsofact.
available.
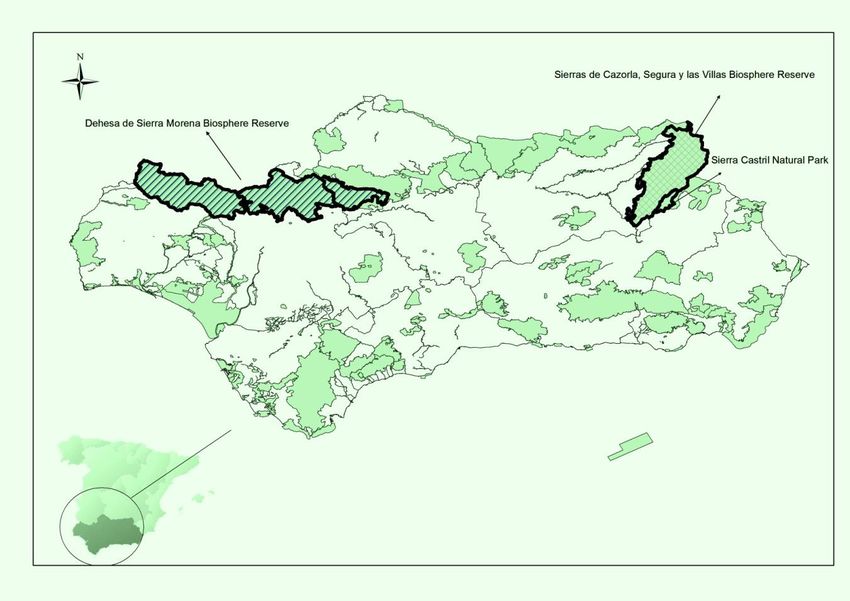
The main
The mainsource
economic of GHGindicators
emissionsof theonactivity
the farms arestudied
also included in Table
is the animals’ 2. It is toactivity
metabolic be highlighted
(mainly
that,to
due forenteric
their estimation,
fermentation), neither the income
which accountsfrom decoupled
for 65% of the aid northe
total; therest
differences
are inputin(18%)the inventory
and soil
of the current
emissions (17%)stock were
(Figure 3). taken into account.
The results Except
of this study show onthat
onethefarm, the indicator
inclusion of carbon “Net Economic
sequestration
Margin”
by vegetationis negative.
reduced the total GHG emissions of these pastoral farms by 38–45%, depending on the
functional unit used (Table 3). The mean carbon footprint of the farms analyzed ranged from 23.7 to
220.2 kg CO2 -eq, depending on the functional unit used, and was negative in one of the farms (Table 3).Table 3. Contribution to the carbon footprint from different sources and annual carbon I sequestration
of the monitored farms.
1 kg CO2-eq kg LWS−1 1 kg CO2-eq ha ULG−1
Item
Mean Minimum Maximum Mean Minimum Maximum
Sustainability 2020, 12, 1181
Total emissions 52.9 23.7 102.1 359.7 108.3 10 of 23
979.7
Livestock emissions 33.3 18.7 68.6 235.6 85.3 676.5
Soil emissions 8.8 4.9 18.8 62.4 21.4 181.2
Table 3. Contribution to the carbon footprint from different sources and annual carbon I sequestration
Input emissions 10.7 0.1 23.2 61.7 0.49 121.9
of the
Total monitored farms. 23.7
C sequestration 9.1 42.4 139.5 30.89 318.6
By vegetation 18.1 1 4.7 37.9 90.4 1 kg CO -eq ha ULG−1 163.9
22.8
kg CO2 -eq kg LWS−1 2
Item
By manure 5.6 4.4 6.7 49.1 8.1 154.7
Carbon footprint Mean
29.2 Minimum
−3.54 Maximum
72.9 Mean
220.2 Minimum
32.9 Maximum
746.3
1 Total emissions 52.9 23.7 102.1 359.7 108.3
Calculations have been made with two different functional units: (i) One kilogram of live weight at 979.7
Livestock
slaughteremissions 33.3 and (ii) 118.7
(LWS) for kid goats; 68.6for grazing
ha of usable land 235.6
(ULG). 85.3 676.5
Soil emissions 8.8 4.9 18.8 62.4 21.4 181.2
Input emissions 10.7 0.1 23.2 61.7 0.49 121.9
The main source of GHG emissions on the farms studied is the animals’ metabolic activity
Total C sequestration 23.7 9.1 42.4 139.5 30.89 318.6
(mainly Bydue to enteric fermentation),
vegetation 18.1 which4.7 accounts for
37.965% of the total; the rest
90.4 22.8are input (18%)
163.9 and
soil emissions
By manure (17%) (Figure 5.6 3). The results
4.4 of this6.7study show 49.1 that the8.1inclusion of carbon
154.7
Carbon footprint
sequestration by vegetation29.2
reduced the −3.54
total GHG 72.9
emissions of 220.2 32.9 farms by746.3
these pastoral 38–45%,
depending on the
1 Calculations functional
have been madeunit
with used (Tablefunctional
two different 3). The units:
mean(i)carbon footprint
One kilogram ofweight
of live the farms analyzed
at slaughter
(LWS)
ranged fromfor kid
23.7goats; and (ii)
to 220.2 kg1 ha
COof2-eq,
usable land for grazing
depending (ULG).
on the functional unit used, and was negative in one
of the farms (Table 3).
Figure 3. Contribution
Figure 3. Contribution to
to total
total emissions
emissions (%)
(%) from
from different sources.
different sources.
3.2. Structural Analysis
3.2. Structural Analysis of
of the
the Problems
Problems Affecting
Affecting the
the Activity
Activity
During
During the
the development
development of of the
the focus
focus group,
group, aa total
total of
of 41
41 variables
variables or
or limiting
limiting factors
factors affecting
affecting the
the
activity were identified. These were assigned a score between 0 (no importance) and 3 (very
activity were identified. These were assigned a score between 0 (no importance) and 3 (very important), important),
and
and aa final
final selection
selection of
of 25
25 factors
factors was
was made
made toto be
be used
used for
for the
the structural
structural analysis
analysis (Table
(Table 4).
4). The
The low
low
selling price of kids was the variable that received the highest score, while the lack of research applied
to the industry received the lowest. From the 25 variables, 28% were grouped in the power zone, 24%
in the conflict zone,
zone, 28%
28% in
in the
the exit
exitzone,
zone,and
and20%
20%in inthe
theindependence
independencezone zone(Table
(Table4).
4).Sustainability 2020, 12, 1181 11 of 23
Table 4. Selection of problems/limiting factors, score obtained, and classification according to the structural analysis.
Number Limiting Factors/Problems Score 1. Location Zone
1 Low selling price of kids 3.00 Exit
2 Inadequate design of CAP aids 3.00 Power
3 Little knowledge of or regard for the environmental services provided by the meat-oriented goat subsector 3.00 Power
4 Lack of generational renewal in farming families 2.83 Exit
5 Little professional and social acknowledgement of the activity 2.83 Exit
Little knowledge of or regard for the socioeconomic and cultural contributions of the meat-oriented
6 2.83 Power
goat subsector
7 Lack of regularity and delays in the reception of aid 2.67 Exit
8 Presence of suckling kids from dairy farms conditioning the market 2.50 Power
9 High average age of farmers 2.50 Exit
10 Bureaucracy and relationship with the corresponding administrations 2.50 Power
11 Excessive or complicated specific demands associated with the location of the farms in protected areas 2.40 Independence
12 Current preferences of kid meat consumers 2.33 Power
13 Disappearance of local slaughter and skinning facilities 2.33 Conflict
14 Little knowledge of or regard for the differential characteristics of grazing goat kid meat 2.33 Conflict
15 Limited availability of the product in local catering businesses 2.17 Conflict
16 Difficulty in finding skilled labor 2.17 Independence
17 Difficulty in meeting agri-environmental commitments, and consequent economic reductions 2.17 Exit
18 Lack of joint marketing initiatives 2.00 Conflict
19 Geographic dispersion of the farms hindering the development of joint marketing initiatives 2.00 Independence
20 Limited availability of the product in the distribution channels 2.00 Conflict
21 Excessive seasonality of kid prices 1.83 Independence
22 Limited market for goat meat and/or low value of the product 1.83 Exit
23 Lack of adaptation of the sanitary norms and requirements to pastoralism 1.83 Independence
24 Difficulties in carrying out the activities of the associations of breeders 1.83 Conflict
25 Lack of research applied to meat-oriented goat subsector 1.83 Power
1 Power: Factors that have an influence on the rest, but are not affected by them (MI > 4% > DI); Conflict: Problems that have an influence on the rest, but are also very dependent on them
(MI > 4% < DI); Exit: Problems that will only be solved if actions are taken in relation to the two previous categories (MI < 4% < DI); Independence: autonomous factors that are not clearly
part of the system. They have very little influence or dependence on the rest (MI < 4% > DI).Sustainability 2020, 12, 1181 12 of 23
Sustainability 2020, 12, 1181 11 of 23
Figure 4 represents the motricity and dependence index scores obtained for each variable.
As suggested
Figure 4by Mojica [44]
represents the and Godet
motricity and[43,45], the natural
dependence indexsequence of action
scores obtained forwould be to address,
each variable. As
first of all, the
suggested problems
by Mojica located
[44] and Godetin [43,45],
the power zone, and
the natural subsequently,
sequence thosebe
of action would intothe conflict
address, zone.
first
of all, the
Among theproblems
problems located in thewithin
identified power zone, and subsequently,
the power zone, two are those in the conflict
intimately linked zone. Among
to the lack of
the problems identified
acknowledgement within the
of the ecosystem powerprovided
services zone, two by thearesector:
intimately linked
(i) Little to the oflack
knowledge of
or regard
acknowledgement of the ecosystem services provided by the sector: (i) Little knowledge
for its environmental services; and (ii) little knowledge of or regard for its socioeconomic and cultural of or regard
for its environmental
contributions. services;
The limited and (ii) little
knowledge ofknowledge of or regard
the differential for its socioeconomic
characteristics of grazing and goatcultural
kid meat,
contributions. The limited knowledge of the differential characteristics of grazing
a factor related to the provision of supply services, is placed in the conflict zone. It is also interesting goat kid meat, a to
factor related to the provision of supply services, is placed in the conflict zone.
underline the importance, within the power zone, of the inadequate design of CAP aids, which may be It is also interesting to
underline
directly the importance,
connected with the within the power
ineffectiveness ofzone,
public ofaid
the when
inadequate
it comesdesign of CAP aids, the
to guaranteeing which may of
viability
be directly connected with the ineffectiveness of public aid when it comes to guaranteeing the
this activity.
viability of this activity.
Figure4.4.Graphic
Figure Graphic representation
representation of
of the
thestructural
structuralanalysis
analysisofofthe problems/limiting
the factors
problems/limiting listed
factors in in
listed
Table 4. Motricity (y-axis): Higher values indicate greater influence; Dependence (x-axis):
Table 4. Motricity (y-axis): Higher values indicate greater influence; Dependence (x-axis): Higher Higher
valuesindicate
values indicategreater
greater dependence.
dependence.
4. Discussion
4.1. Pastoral Goat Farming as Provider of Ecosystem Services
In addition to food, agro-forest-pastoral systems with the presence of goats can provide a wide
range of benefits and services to society. However, as argued by Cooper et al. [46], given that those
services have no market price, farmers have little or no incentive to produce them, regardless of the high
societal demand. Rodríguez-Ortega et al. [47] and Cooper et al. [46] identified five of those ecosystem
services (ES) among the most relevant non-market functions of European agriculture: Maintenance of
sustainable agricultural landscape, biodiversity conservation, forest wildfire prevention, regulation of
climate change through carbon sequestration, and production of local quality products.
4.1.1. Provisioning Services
The results of our study show that 71% of the market income of the farms analyzed comes from
the sale of kids for slaughter. This service is virtually the only remunerated one among those supplied
by the farms, but it is insufficient to guarantee the profitability of the activity. This is mainly due
to three causes: (i) The low productivity per animal; (ii) the current marketing model, focused onSustainability 2020, 12, 1181 13 of 23
the commercialization of undifferentiated suckling kids; and (iii) the low selling price of kids during
most of the year, which does not cover the costs of production. In Greece, Hadjigeorgiou et al. [48]
found values for kids produced by goat and year ranging between 0.89 and 1.09, i.e., higher than those
obtained in the five farms monitored in this study (0.86). In 2007, Luque [49] found, for a sample of
57 extensive goat farms in Castilla La Mancha and Andalusia (Spain), that the number of kids sold per
doe reached 1.19, a much higher value than that of 0.62 established in this work.
In Spain, the market preference is for suckling kids, rather than larger animals. In 2018, 1.06 million
suckling kids with an average weight of 5.17 kg carcass−1 were slaughtered, in contrast with only
67,410 larger kids weighing an average of 12.98 kg carcass−1 [50]. The sale of kids at 9.7 kg live weight,
which is the average of the farms studied, hinders the creation of the value added, associated with
raising a larger kid, as well as the development of the differential characteristics, mainly functional
quality and organoleptic properties, that are typical of pasture-raised goat meat. The idea that the
quality of a product needs to be taken into account in order to properly appreciate the value of an
agricultural system for society is finding increasing support [51]. In this sense, kid meat is a first-rate
provisioning ES, which contributes to people’s wellbeing. According to the Spanish Database of Food
Composition [52], the meat of suckling ruminants in Spain contains high protein, phosphorus, zinc and
vitamins B6 and B12 ; it is also a source of potassium, selenium and vitamin B3 , and has a low content of
sodium. Lately, there is an increasing demand for food that provides human health benefits through the
presence of certain compounds, like fats. Unsaturated fatty acids (FA), such as n-3 FAs and conjugated
linoleic acid (CLA), and fat-soluble antioxidants (e.g., α-tocopherol, carotenoids) are claimed to have
benefits for human health [53,54]. In addition, some recommendations have been made on the basis of
the n-6/n-3 polyunsaturated fatty acids (PUFA) ratio: An n-6/n-3 ratio of up to 4 is recommended in the
human diet to help maintain good cardiovascular health [55]. The meat of Spanish autochthonous goat
breeds reared in grazing-based production systems has a low content of fat and a healthier profile of
FAs, especially in relation to the content of PUFAs and the n-6/n3 PUFA ratio [56–58]. Circumstantial
evidence supports the hypothesis that phytochemical richness of herbivore diets that are high in plants
(such as the farming systems studied in this work) enhances the biochemical richness of meat and
dairy, which is linked with human health [59]. Among many roles they play in health, phytochemicals
in herbivore diets protect meat and dairy from protein oxidation and lipid peroxidation that causes
low-grade systemic inflammation implicated in heart disease and cancer in humans. However, future
studies should elucidate how plant diversity influences biochemical richness of meat and dairy and
how to affect the health of people [59].
The additional problem is that it is not easy for the consumer to identify and have access to
differentiated pasture-based products. All this has an influence on the low selling price of the product
and the little acknowledgement given to it by the consumers.
The experts who were consulted include the low selling price of kids as one of the three main
problems affecting this sector, although this factor is located in the exit zone and its resolution would
require previously addressing the problems within the power zone that are directly related to it:
(i) Competition with suckling kids reared in dairy farms; (ii) the preferences of live goat kid purchasers;
and (iii) the lack of knowledge of or regard for the healthier lipid profile of grazing goat kids, among
other positive characteristics of this kind of meat.
Another ES supplied by goat husbandry is the preservation of animal genetic resources. Despite
the fact that the five farms analyzed belong to the corresponding association of pure-bred breeders and
that their animals are registered in the herd-book of each breed, the sale of live animals is a commercial
option developed by only two of those farms, probably because the income derived from it is small
(an average of 7.4 € goat−1 ). There is nevertheless an enormous potential in it, so the sale of live animals
should be increased, as an additional source of income on farms.Sustainability 2020, 12, 1181 14 of 23
4.1.2. Regulating Services
Pastoral goat farming also plays an important role as a supplier of ecosystem regulation and
maintenance services, in addition to provisioning ES. As described above, the goat breeds studied
are mainly fed with natural resources, a management practice that decreases the number of external
inputs and promotes closed systems in relation to energy and matter flows. These are completely
extensive management systems where grazing is possible all year long, and in many cases, practiced
on a transhumance basis, thus, enormously contributing to the management and maintenance of
ecosystems with a high environmental value [8,60]. There is increasing scientific evidence that grazing
in mountain areas is a key tool for the resilience, sustainability and conservation of biodiversity [61–64].
Through good practices in pastoral goat farming, appropriate management of the ecosystems is
possible. These practices include: Control of accumulated biofuel, dispersion of Mediterranean species,
decomposition of plant litter, the balance between native and invasive species, and preservation of the
landscape [8,60,65,66].
Blanca Serrana and Negra Serrana goat flocks graze on wide extensions of Mediterranean mountain
land, which are usually protected and would otherwise be exposed to abandonment. In addition to
making good use of shrubby vegetation [67], the presence and activity of goats improve the access
of other species to herbaceous pastures and increase the productivity of the latter. As stated by
Osoro et al. [68] and Mena et al. [39], goats could easily complement the grazing activity of sheep and
cattle in certain ecosystems where the shrubland is predominant, increasing the global productivity per
hectare. This, linked to the fact that traditional meat-producing systems require less labor (which can,
therefore, be employed in other activities), explains the abundance of multi-species farms. The farms
monitored in this work have a ratio of 546 goats AWU−1 , in contrast with the 210 goats AWU−1 of the
dairy goat farms of the Sierra de Grazalema, in the province of Cádiz (Spain), found by Mena et al. [39].
Prevention of forest fires is a well-acknowledged regulating ES. Unfortunately, the frequency and
intensity of forest fires in the Mediterranean basin are increasing and the interval between years of
large wildfire events is shortening [67], a fact very much related to the abandonment of stockbreeding
in those ecosystems. In recent years, there has been a shift in focus on long-term prevention policies:
The processing of combustible biomass is now considered a key factor for their implementation.
Preventive silviculture, and as part of it, supervised goat and sheep grazing are especially relevant
tools [67].
Climate change, caused by an increment in the concentration of greenhouse gases (GHG), is another
serious social concern. In this sense, the importance of evaluating farming systems in terms of GHG
emissions has never been greater [51]. Pastoral goat husbandry is a production system that can
positively contribute to the implementation of mitigation strategies, although some authors advocate
the intensification of farming as the best solution, favoring specialized and more productive breeds
rather than the rustic and traditional ones [69]. They argue that intensive systems have a smaller carbon
footprint (CF), even though the evidence provided is partial because it only takes into consideration
GHG emissions. When intensive and extensive stockbreeding are compared, carbon sequestration
in ecosystems with the presence of livestock is generally disregarded. However, Batalla et al. [70]
for sheep and Gutiérrez-Peña et al. [40] for goats have found that, when carbon sequestration is
included in the estimation of the CF of extensive systems, the value obtained is similar to that of more
intensive systems. Another element potentially distorting the results is that the CF is often calculated
in relation to the output (number of kilograms produced), thus, significantly reducing the value in the
most productive livestock farms. Finally, the deforestation resulting from the cultivation of crops for
intensive livestock farms, located thousands of kilometers away, is not—although it should be—taken
into account.
As grazing animals basically feed on forage, most GHG emissions come from the methane
produced through enteric fermentation [71]. However, as observed in the farms studied, the emissions
of CO2 and N2 O are reduced to the minimum and represent, respectively, 18.4% and 16.9% of the
total GHG emissions. Consequently, the GHG emissions per hectare are low (220.2 kg CO2 -eq ha−1 ),Sustainability 2020, 12, 1181 15 of 23
in fact, substantially lower than those of the intensive grazing systems (8629.57 kg CO2 -eq ha−1 )
analyzed by Gutiérrez-Peña et al. [40]. On the other hand, the value of the CF in the pastoral farms
monitored in this work is, when expressed in emissions per kilogram of meat produced, distorted by
the methodology employed for the calculation. In the case of farms that only sell kids, all the GHG
emissions are allocated to the meat product, and given the above-mentioned low productivity rate, the
value obtained is relatively high (52.9 kg CO2 -eq kg−1 LWS), compared to the 25.9 kg CO2 -eq kg−1
LWS for grazing lamb meat estimated by Ripoll-Bosch et al. [72]. No CF values have been found in the
scientific literature for meat goat livestock.
Therefore, in order to obtain results that are closer to the reality of extensive meat goat farming,
it is necessary: (i) To include carbon sequestration in the estimation of the CF, which will reduce
the value of the total GHG emissions by 38.8% to 44.8%, depending on the functional unit used;
and (ii) to quantify other services provided by the farms and make the correct allocation to each of
them, as suggested by Ripoll-Bosch et al. [72]. Just like in farms producing both meat and milk these
products are allocated their share of GHG emissions, which is calculated according to their economic
value [40], in pastoral goat farms like the ones here studied, the regulating and cultural ES provided
should also be economically valued and allocated their share of the GHG emissions generated by the
production system.
Another challenge for the sustainability of the current agrifood model is the high use of
non-renewable energy sources despite the actual threat of oil depletion [73], and the pollution
associated with them. From this point of view, low-input pastoral goat farms have several advantages.
In contrast to intensive models, the practices implemented in grazing systems translate into important
reductions in the use of non-renewable energy, because this type of energy is mainly related to the
production and transportation of feed concentrates. Pérez-Neira et al. [74] made a comparative analysis
of various pastoral dairy goat farms in the Sierra de Cádiz (Andalusia, Spain), and revealed the
potential environmental benefits derived from land-based stockbreeding, and more specifically, grazing
activities. Those benefits include gains in energy efficiency, reduction of dependence on non-renewable
energy, and avoidance of the environmental costs associated with the use of energy in other types
of grazing systems. In addition, the low consumption of animal health and phytosanitary products
completes the picture of low dependence on external inputs in these farms, thus, confirming that
grazing is an effective, nearly carbon-neutral, and therefore, cost-effective, non-toxic and non-polluting
weed control technique [67].
Even though traditional meat-producing systems have a high degree of feed autonomy, which
is one of their strengths, it is also true that the area devoted to growing crops for animal feed
should be moderately increased when the circumstances allow it. This would provide a supplement
for the animals in times of natural pasture shortage, which would, in turn, have an effect on the
above-mentioned low productivity rates.
4.1.3. Cultural Services
Access to a pleasant environment and to leisure activities is another service offered by the farms
monitored in this study. Many cultural services are associated with traditional agriculture landscape,
and there is strong evidence that their biodiversity plays a positive role in enhancing human well-being,
especially in the case of agro-tourism, eco-tourism and educational activities inspired by the local
ecosystems and taking place in the landscape [75].
Despite the negative effects that the pressure of tourism may have on the primary sector in certain
mountain areas, some subsectors have made the most of the implementation of this kind of activities.
The FAO [76] has argued that a holistic approach to food production in protected areas is required to
achieve a successful integration of agriculture, livestock husbandry and ecosystem conservation. This
idea underlines the importance of cultural landscapes within protected areas as food suppliers playing
a significant role in food security [26]. In Andalusia, for instance, the so-called “oil tourism” is an
opportunity to explain the true relevance of olive oil and to create a channel for economic diversificationYou can also read