The cost of poor housing in England by tenure - 2023 Briefing paper: Tenure-based analysis
←
→
Page content transcription
If your browser does not render page correctly, please read the page content below
The cost of poor housing in England
by tenure

2023 Briefing paper: Tenure-based analysis
Helen Garrett, Susie Margoles, Molly Mackay and Simon Nicol

Executive Summary
For the first time, BRE is reporting on the cost of poor housing by tenure. This tenure-based research uses
the same methodology developed for our previous research on the cost burden to the National Health
Service (NHS) of the poorest quality homes. The findings for this report use 2018 and 2019 combined year
(reference date 2019) English Housing Survey data and the NHS treatment costs used in our previous
research inflated to 2019 prices.

‘Poor housing’ is defined as ‘a dwelling that fails to meet the statutory minimum standard of housing in
England’, i.e., a dwelling that contains one or more Category 1 Hazards under the Housing Health and
Safety Rating System (HHSRS). The HHSRS, used in environmental health assessments and enforcement,
identifies 29 housing hazards which may pose a risk to the health and safety of occupants. If a hazard is
a serious and immediate risk to a person’s health and safety, this is known as a Category 1 hazard. The
English Housing Survey, used for this research, assesses 26 of the 29 hazards.

In 2019, around 1.6 million (10%) owner occupied homes had a Category 1 hazard that, if left unmitigated,
would result in an annual cost to the NHS of £783 million. The average (mean) cost to make an individual
home safer was £3,434. If the total investment required to mitigate all these hazards occurred at once then,
based only on the saving to the NHS for first year treatment costs, the investment would pay back in 7
years.

Around 619,000 (13%) private rented homes had a Category 1 hazard that, if left unmitigated, would result
in an annual cost to the NHS of £290 million. The average cost to make these homes safer was £4,039. If
the total investment required to mitigate all these hazards occurred at once then, based only on the saving
to the NHS for first year treatment costs, the investment would pay back between 8 and 9 years.

Around 217,000 (5%) social rented homes had a Category 1 hazard that, if left unmitigated, would result in
an annual cost to the NHS of £65 million. The average cost to make these homes safer was £3,784. If the
total investment required to mitigate all these hazards occurred at once then, based only on the saving to
the NHS for first year treatment costs, the investment would pay back between 12 and 13 years.

The two most prevalent Category 1 hazards in the English housing stock are excessive cold and falls
associated with stairs.

BREG ROUP.COM                                                     © B uil din g Re s e a rch Establ ish me nt Limite d   2

Excessive cold

                                    Number of homes with Category 1           Percentage of homes with
Tenure
                                    excessive cold hazard                     Category 1 excessive cold hazard

 Owner occupied                     518,168                                   3.3%

 Private rented                     178,541                                   3.8%

 Social rented                      22,615                                    0.6%

In both owner occupied and privately rented homes, the largest poor-housing-related cost burden to the
NHS is ill-heath caused by cold, experienced by people living in very energy inefficient homes. A home with
an HHSRS Category 1 excessive cold hazard aligns roughly with an Energy Performance Certificate (EPC)
Energy Efficiency Rating band of F or G.

Around 518,000 (3%) of owner occupier and 179,00 (4%) of private rented homes homes are F or G
banded. Raising the energy efficiency of these homes is critical to health and wellbeing, in situations where
homes are cold either because they do not have adequate heating systems to provide required warmth or
where homes are so inefficient that residents cannot afford to heat them.

Since 1 April 2020, private landlords have not been allowed to let or continue to let properties covered by
the Domestic Minimum Energy Efficiency Standard (MEES) regulations if they have an EPC rating below
E, unless they have a valid exemption in place. If a landlord cannot improve the rental property to this rating
for £3,500 or less, the landlord can register an ‘all improvements made’ exemption.

The average cost to improve homes so they are no longer excessively cold (i.e., raise above an EPC rating
band of F) is £6,690 and £6,835 for homeowners and private landlords respectively. If private landlords
adhered strictly to the MEES price cap, £3,500 would remedy between 30% to 40% of these excessively
cold homes.

Falls associated with stairs

                                                                              Percentage of homes with
                                    Number of homes with Category 1
Tenure                                                                        Category 1 falls associated with
                                    excessive falls hazard
                                                                              stairs hazard

 Owner occupied                     682,763                                   4.4%

 Private rented                     251,348                                   5.3%

 Social rented                      80,262                                    2.0%

The risks of falls associated with stairs continues to be the most common cause of poorer housing.
Around 1 million (4%) homes across all tenures have a Category 1 fall hazard. Falls are a common, but often
overlooked, cause of injury. While many falls will not result in a serious injury, there is always a risk that a
fall could lead to broken bones, or worse. Falls hazards are often relatively inexpensive to prevent, typically
costing under £500. Mitigating these hazards, and other types of risks from falls, provides a relatively quick
return for the NHS.

BREG ROUP.COM                                                        © B uil din g Re s e a rch Establ ish me nt Limite d   3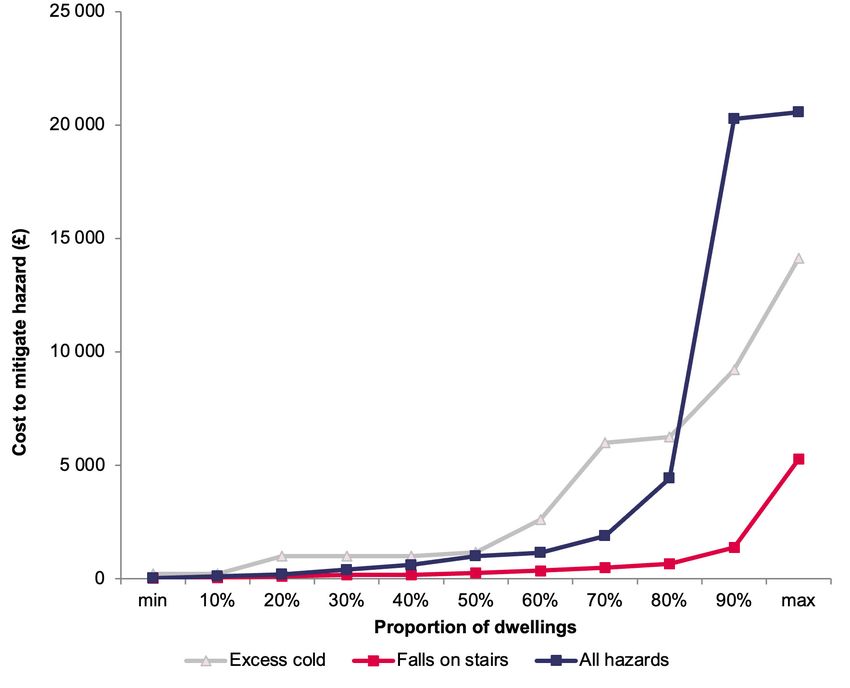
Overall costs of tackling poor housing

Our research confirms that, while the cost to make a home safe can vary considerably, simple home safety
measures such as installing handrails on dangerous stairs or installing hard-wired smoke detectors are
relatively inexpensive but very cost-effective.

We understand there are challenges for many homeowners, private and social landlords in tackling
our poorest housing; these are well publicised and not repeated in this report. One key challenge is
understanding where poor housing exists, as it can often remain under the radar. Many people may be
unaware of the existence of a serious hazard in their home and how it may have an impact on their health,
safety and wellbeing. Once identified, finding the money to mitigate the hazard may also be a challenge,
especially for poorer homeowners.

The data in this report suggests that, given the direct savings to the NHS, let alone wider benefits, there
is a strong case for government investment in the improvements required to mitigate Category 1 hazards.
There is also a strong case for investment in additional data-gathering on the homes where the hazards
exist.

Previous BRE research has looked at the cost-benefit of earlier improvement programmes. Since the
early 2000s, the Decent Homes Standard has set the minimum standards that social homes are required
to meet. The earlier BRE research looked at social sector homes, examining how the improvement and
remedial work required to meet specified standards of decency resulted in a reduction in serious health
and safety hazards.

The principal period of government investment in social housing to bring homes to the Decent Homes
Standard was from 2001 to 2010: our research estimated that total savings to the NHS as a result of
improving social sector homes between 2001 and 2010 was £392 million per annum 1.

Forthcoming: 30-year cost-benefit analysis
This report’s tenure-based analysis demonstrates the critical importance of housing to health and
wellbeing and shows that small investment costs can result in considerable reductions in the most serious
health and safety hazards, as well as generating savings to the NHS. The wider benefits to society of
improving the poorest housing go well beyond those that just relate to the health of occupants. They
include reduced energy costs and carbon emissions, higher residual asset values, and local job creation
opportunities. These wider benefits will be explored in a further piece of BRE Cost of Poor Housing
research to be issued later in 2023 providing a 30-year cost benefit analysis, looking over 30 years, of the
costs and benefits of improving the poorest homes.

1 Garrett H, Davidson M, Roys M, Nicol S and Mason V, Quantifying the health benefits of the Decent Homes programme, BRE FB64.

 Bracknell, IHS BRE Press, 2014

BREG ROUP.COM                                                                  © B uil din g Re s e a rch Establ ish me nt Limite d   4

Table of contents
Introduction                                                                  4
Methodology                                                                   5
Owner occupied homes                                                          9
Private rented homes                                                          11
Social rented homes                                                           12
Case study                                                                    12

BREG ROUP.COM          © B uil din g Re s e a rch Establ ish me nt Limite d        5

Introduction

In 2021 BRE published ‘The cost of poor housing in England’ briefing paper 2 to update its earlier 2016
research on ‘The full cost of poor housing to the NHS’ 3. The 2021 briefing paper was widely quoted in
studies that look at the relationship between health and housing and the benefits of improving the worse
quality housing in England. The 2021 research found that the annual cost to the NHS of leaving people
in the poorest housing was around £1.4 billion. In addition, when wider societal costs are included, it was
estimated that the full cost to society of poor housing was £18.5 billion per annum.

We are building on our 2021 publication in two ways.
- Firstly, this report which, for the first time, investigates the cost of poor housing (COPH) in each tenure
- Secondly, a 30-year cost benefit analysis on the cost of all poor housing to the NHS and wider society,
   to be published later in 2023.

The methodology for analysing the cost of poor housing by tenure replicates that used in our 2016 and
2021 publications and so will not be described in full in this report.

We have applied this methodology to owner occupied, private rented and social rented homes using the
latest publicly available English Housing Survey (EHS) data (2018 and 2019 combined years, reference
date 2019) on health and safety hazards in the home and costs to mitigate them. In addition, NHS treatment
cost data has been updated to 2019 prices.

This new briefing paper summarises the cost of poor housing methodology before discussing the main
findings for each tenure. It focuses on the cost to treat falls associated with stairs and excessively cold
homes 4, the two most common causes of poor housing. The concluding section provides a case study
of poor housing due to the serious risk of falling on stairs and the costs and benefits of making the home
safer.

Our research continues to demonstrate the critical importance of housing to health and wellbeing and
shows that small investment costs can result in considerable reductions in the most serious health and
safety hazards as well as generating savings to the NHS. The wider benefits to society of improving
the poorest housing go well beyond those that just relate to the health of their occupants. They include
reduced energy costs and carbon emissions, higher residual asset values, and local job creation
opportunities. These wider benefits will be explored in greater detail in our forthcoming 30-year cost
benefit analysis.

2 The 2021 Briefing paper used the English Housing Survey 2017 and 2018 combined year data, reference date 2018.
3 Roys M, Nicol S, Garrett H and Margoles S (2016), The full cost of poor housing, BRE FB 81. Bracknell, IHS BRE Press
4 For the EHS and this research, a home is excessively cold where the energy efficiency (SAP rating) is below 37.6 (roughly equivalent
 to an Energy Efficient Rating Band of F or G)

BREG ROUP.COM                                                                      © B uil din g Re s e a rch Establ ish me nt Limite d   6
Methodology

Poor housing

‘Poor housing’ can be defined in many ways, but for the BRE cost of poor housing research it has always
been defined as ‘a dwelling that fails to meet the statutory minimum standard of housing in England’, i.e.,
a dwelling that contains one or more Category 1 Hazards under the Housing Health and Safety Rating
System (HHSRS). This is the same as the minimum condition measure of the Decent Homes Standard 5.

In 2019, the EHS estimated that 2.4 million (10%) 6 of England’s homes had at least one Category 1 hazard
and were considered to be ‘poor’. The most common hazards identified in every tenure were those relating
to falls on stairs and excessive cold.

Cold homes exacerbate a range of health problems such as chronic obstructive pulmonary disease
(COPD) and arthritis, as well as increasing the risk of an acute episode like a stroke or heart attack.
Conversely, some hazards are so rare (such as the risk from explosions) that none were picked up in the
2019 EHS.

For each tenure, the BRE cost of poor housing model uses the following data, which is presented in Tables
2, 3 and 4.
1. The number of homes with each type of Category 1 hazard and the total number of homes with at least
    one of these hazards 7 8.
2. The average and total repair cost of making these homes acceptable (so that the risk of harm is no
    higher than average), modelled using EHS data.
3. The costs to the NHS of leaving the hazards unmitigated.
4. The NHS payback period of mitigating the hazards now.

Data on the HHSRS Category 1 hazards is collected by the English Housing Survey (EHS). Where a
Category 1 hazard is identified in the EHS, the surveyor reports the work that would be required to mitigate
the risk of harm so that, where feasible, the risk is no worse than the national average for the age and type
of dwelling. This work is costed through the EHS ‘cost to make safe’ model at 2019 prices 9.

5 English Housing Survey: technical advice - GOV.UK (www.gov.uk)
6 English Housing Survey 2019 to 2020 Headline report, Annex Table 2.4 English Housing Survey 2019 to 2020: headline report -

 GOV.UK (www.gov.uk)
7 Homes can have multiply Category 1 hazards; this is the number of homes with one or more Category 1 hazards
8 The HHSRS likelihood of harm and harm outcome scores available from the EHS are also used in the cost of poor housing model.
9 English Housing Survey: technical advice - GOV.UK (www.gov.uk)

BREG ROUP.COM                                                                   © B uil din g Re s e a rch Establ ish me nt Limite d   7
To estimate the cost of poor housing to the NHS, the research uses data from publicly available NHS
treatment cost data, predominantly the National Schedule of Reference Costs for 2017-18 (NHS Trusts
and NHS Foundation Trusts) which have been inflated to 2019 prices 10. Every health incident in the home
will have a unique outcome. The cost of poor housing method summarises and simplifies this to provide
representative costs for four types of outcomes considered for an HHSRS Category 1 hazard assessment
(Table 1). These outcomes range in their seriousness and therefore required cost of treatment.
Table 1: Representative cost to the NHS values
Cost value Class I (£) Class II (£) Class III (£) Class IV (£)
Representative cost (2019) 127,250 35,630 5,090 204
For each tenure, the payback period is estimated by dividing the cost of remedial work by the savings to
the NHS if the hazard is mitigated. For example, if all remedial work was undertaken now to Category 1
hazards in owner occupied homes, it is estimated that it would pay back the NHS treatment costs alone
within 7 to 8 years.
The data in this report suggests that,
given the direct savings to the NHS,
let alone wider benefits, there is a
strong case for government investment
in the improvements required to
mitigate Category 1 hazards. There
is also a strong case for investment
in additional data-gathering on the
homes where the hazards exist.
10 The inflation factor used Bank of England inflation calculator- https://www.bankofengland.co.uk/monetary-policy/inflation/
inflation-calculator
BREG ROUP.COM © B uil din g Re s e a rch Establ ish me nt Limite d 8Owner occupied homes
Owner occupation is the largest tenure, representing 64% of all homes (15.6 million) in 2018-19. 20% of
homes were built before 1919 and a further 18% built between 1919 and 1945. Some 10% of homes have
been built since 2002. Most of the stock comprises of houses (91%). 11
Around 1.6 million (10%) owner occupied homes had a Category 1 hazard that, if left unmitigated, would
result in an annual cost to the NHS of £783 million, with the largest share of this cost due to treating ill
health arising from living in an excessively cold home, as shown in Table 2. The most prevalent cause
of poor housing (affecting 4% of owner occupier homes) was related to falls on stairs, representing the
second highest cost to the NHS of £145 million per annum.
It is important to bear in mind that the average age of all owner occupiers is 58 years (68 years for outright
owners) 12. Over a third (36%) of homeowners are aged 65 years or over 13. For both excessive cold and falls
on the stairs hazards, older people (aged 65 and 60 years respectively) are the most vulnerable age group.
Figure 1 shows the distribution of the costs to make owner occupied homes safe and how these costs are
not evenly distributed, a pattern also observed for the rented tenures. Our other key findings are:
- The average cost to mitigate all hazards in owner occupied homes was £3,434.
- For less than £1,000, 40% of all poor housing could be remedied.
- 60% of poor housing could be remedied with an investment of around £2,100.
- The average cost to treat excessively cold homes was £6,690 but the most expensive 10% of cold
homes required an investment of between £11,225 and £35,800.
- For around £2,600 some 40% of excessively cold homes could be treated.
- Half of the most serious risks of falls on stairs hazards could be mitigated for less than £500.
- If all hazards were mitigated now, the payback to the NHS would be realised in around 7 years.
Local housing authorities have a general duty to monitor and carry out appropriate enforcement action,
should they become aware of unsatisfactory housing conditions in their area. However, the most serious
health and safety hazards in owner occupied homes often remain ‘under the radar’ as many councils do
not have the funding capacity (or the data) to identify poorer housing in this tenure. Even where a serious
hazard is identified that poses a risk to either occupants or others in the vicinity of the dwelling, in most
instances owners would not be required to carry out work to their own home.
There are also challenges and barriers to incentivising owners to remedy serious defects to their home,
including undertaking energy improvements. These are well documented in other research and not
covered in detail here, but include cost, concern about upheaval to the home, lack of knowledge of the
work required and its potential benefits, and lack of qualified professionals to undertake retrofit work.
11 EHS 2019 to 2020 Headline report, https://www.gov.uk/government/statistics/english-housing-survey-2019-to-2020-headline-
report, Section 2, housing stock tables, Annex Table 2.1
12 EHS_19-20_Home_ownership_report_FINAL.pdf (publishing.service.gov.uk), Annex Table 1.2
13 EHS 2019 to 2020 Headline report, https://www.gov.uk/government/statistics/english-housing-survey-2019-to-2020-headline
report, Section 1, household tables, Annex Table 2.1
BREG ROUP.COM © B uil din g Re s e a rch Establ ish me nt Limite d 9£2,100
60% of poor housing could be
remedied with an investment of
around £2,100
£500
Half of the most serious risks of falls
on stairs hazards could be mitigated
for less than £500
7 years
If all hazards were mitigated now,
the payback to the NHS would be
realised in around 7 years
BREG ROUP.COM © B uil din g Re s e a rch Establ ish me nt Limite d 10Table 2: Summary of costs and benefits, with Category 1 hazards ordered by NHS savings per annum if
the hazard was mitigated, in owner occupied homes, 2019
Number of Average cost Total cost to Savings to the NHS
Payback
Hazard Category 1 per dwelling mitigate hazard per annum if hazard
(years)
hazards (£) (£) mitigated (£)
Excess cold 518 168 6 690 3 466 741 060 382 936 715 9,05
Falls on stairs 682 763 1 377 940 130 857 145 118 074 6,48
Falls on the level 259 669 1082 280 965 256 77 567 256 3,62
Hot surfaces 31 820 1 749 55 648 225 72 878 988 0,76
Falls between
150 785 1 454 219 305 695 43 227 978 5,07
levels
Fire 77 356 2 461 190 336 914 12 376 709 15,38
Lead 56 879 2 141 121 764 618 12 334 847 9,87
Radon 66 595 1 446 96 283 265 7 855 429 12,26
Damp and mould
13 243 2 365 31 323 796 6 899 558 4,54
growth
Collision and
11 102 741 8 226 248 4 816 089 1,71
entrapment
Food safety 17 963 3 279 58 898 925 3 806 365 15,47
Pests (Domestic
11 121 3 766 41 876 719 2 304 415 18,17
hygiene)
Entry by intruders 4 510 1 150 5 185 539 2 241 873 2,31
Ergonomics 9 403 633 5 953 769 2 021 809 2,94
Sanitation
9 403 513 4 822 891 1 993 854 2,42
(Personal hygiene)
Structural collapse 9 199 2821 25 950 884 1 449 700 17,90
Carbon monoxide 5 403 638 3 448 423 1 029 125 3,35
Noise 1 653 1 456 2 407 278 822 717 2,93
Overcrowding 2 405 20 561 49 448 598 330 075 149,81
Excess heat 2 439 633 1 544 320 326 546 4,73
Electrical
1 011 112 112 948 215 552 0,52
problems
Falls - baths 0 0 0 0 0
Water supply 0 0 0 0 0
Uncombusted fuel
0 0 0 0 0
gas
Lighting 0 0 0 0 0
Explosions 0 0 0 0 0
Total with any
1 610 899 3 434 5 610 376 229 782 553 674 7,17
Category 1 hazard
BREG ROUP.COM © B uil din g Re s e a rch Establ ish me nt Limite d 11Table 2 Notes:
1. The total sum of all dwellings with Category 1 hazards will be less than the sum of the individual hazards
as some dwellings will have more than one Category 1 hazard.
2. The total sum required to remedy all Category 1 hazards is less than the total number of Category 1
hazards multiplied by the average costs; this is because the modelling avoids the double counting of
costs where repair work/energy improvements mitigate more than one hazard.
3. Sample sizes for some Category 1 hazards are very small and are included for quantification purposes
only. For some, like explosions, no cases were identified in the survey. There will, therefore, be a degree
of uncertainty around these estimates because any calculations relating to cost benefits and payback
periods are very sensitive to the mix of hazards present in England.
4. Three of the 29 HHSRS hazards are not measured in the EHS (asbestos, biocides, volatile organic
compounds) because they require an intrusive inspection, which is not practicable in a sample survey.
Figure 1: Decile costs to mitigate Category 1 hazards, excess cold, falls on stairs and all Category 1
hazards, in owner occupied homes, 2019
1 The HHSRS likelihood of harm and harm outcome scores are also used in the COPH model.
BREG ROUP.COM © B uil din g Re s e a rch Establ ish me nt Limite d 12Private rented homes Private rented homes represent around 19% of homes (4.7 million) 14 but comprised around a quarter of all poor housing (25%) and its associated cost to the NHS (26%). Around a third of homes (32%) in the private rented sector were built before 1919 15, and so are more likely to suffer from more serious disrepair and, in terms of retrofitting options, tend to be more problematic (including more expensive) to treat. Some 40% of private rented homes are flats; including 11% of converted flats 16 which commonly date from pre 1919 and are more likely to have Category 1 hazards compared with all other types of dwellings 17. Private renters tend to be younger than homeowners, with just 8% aged 65 years or over 18. There was, however, an increase in the number and proportion of people aged 55-64 living in the private rented sector, from 7% in 2009-10 to 10% in 2019-20 and an increase in the number of households with dependent children (by about 547,000) over the same period 19. Older people and young children are the most vulnerable age group for many Category 1 hazards assessed by the HHSRS. Around 620,000 private rented homes had one or more Category 1 hazard, representing a cost to the NHS of around £290 million per annum. Category 1 excess cold hazards resulted in a cost burden to the NHS of around £1.2 billion per annum. Falls on the stairs were, however, the most common hazard, with an annual cost to the NHS of around £271 million (Table 3). Our other key findings are: • The average cost to make all poor housing safer was £4,039. • The average repair cost to mitigate excessively cold homes was £6,835. • Around half (50%) of poor housing could be removed with an investment of under £1,176. Conversely the cost to make homes safe was between £10,000 and £46,343 for the most expensive 10% of homes. • 70% of the most dangerous stairs could be made safer for under £700. • If all hazards were mitigated now, the payback to the NHS would be realised between 8 and 9 years. Improving the energy efficiency of excessively cold homes would realise notable NHS cost savings. On average, an investment of £6,835 would be required. Under the current Minimum Energy Efficiency Standards (MEES), landlords can claim an exemption if work to raise the EPC rating of the dwelling to Band E (the approximate threshold for excess cold) exceeds £3,500 including VAT 20. This £3,500 ceiling therefore restricts the scope of the MEES regulations. 14 EHS 2019 to 2020 Headline report, https://www.gov.uk/government/statistics/english-housing-survey-2019-to-2020-headline- report, Section 2, housing stock tables, Annex Table 2.1 15 EHS 2019 to 2020 Headline report, https://www.gov.uk/government/statistics/english-housing-survey-2019-to-2020-headline- report, Section 2, housing stock tables, Annex Table 2.1 16 EHS 2019 to 2020 Headline report, https://www.gov.uk/government/statistics/english-housing-survey-2019-to-2020-headline- report, Section 2, housing stock tables, Annex Table 2.1 17 English Housing Survey 2017: stock condition - GOV.UK (www.gov.uk), Annex Table 2.9 18 FA3101_demographic_and_economic_characteristics_of_social_and_privately_renting_households.ods (live.com) 19 EHS 2019 to 2020 Headline report, https://www.gov.uk/government/statistics/english-housing-survey-2019-to-2020-headline- report, Section 1, household tables, Annex Table 1.4. 20 Domestic private rented property: minimum energy efficiency standard - landlord guidance - GOV.UK (www.gov.uk) BREG ROUP.COM © B uil din g Re s e a rch Establ ish me nt Limite d 13
Figure 2 shows that half (50%) of these cold homes require an investment of £9,000 or more, while
conversely roughly a third (30%) require £2,175 or less.

The private rented sector has the largest number of homes (almost 33,000) that are classified as poor
housing due to the most serious damp and mould growth hazards identified by the EHS. Where damp
and mould growth is evident, the EHS surveyor will assess threats to health associated with increased
prevalence of house dust mites and mould or fungal growths resulting from the dampness and/or high
humidity. Their assessment includes threats to mental health and social wellbeing which may be caused by
living with the presence of damp.

Many of the common barriers in improving energy efficiency apply to some private landlords: affordability
of higher cost improvement measures such as solid wall insulation and availability of suitable qualified
installers. For some landlords, there is a potential ‘split incentive’ whereby landlords are responsible for
the cost of energy efficiency improvements, but their tenants are the main beneficiaries, particularly if
landlords do not anticipate an equivalent monetary rise in the value of their property.

BREG ROUP.COM                                                      © B uil din g Re s e a rch Establ ish me nt Limite d   14
Table 3: Summary of costs and benefits, with Category 1 hazards ordered by NHS savings per annum if
the hazard was mitigated, in private rented homes, 2019

                       Number of     Average cost     Total cost to           Savings to the NHS
                                                                                                                       Payback
 Hazard                Category 1     per dwelling mitigate hazard            per annum if hazard
                                                                                                                        (years)
                         hazards               (£)             (£)                  mitigated (£)

 Excess cold               178 541          6 835      1 220 371 478                        148 952 992                    8,19
 Falls on stairs          251 348            1 077      270 714 667                           53 422 839                   5,07
 Falls on the level        99 796              717        71 532 331                           25 801 140                  2,77
 Falls between
                           44 552            1 139      50 766 650                            23 439 689                   2,17
 levels
 Damp and mould
                           32 701           6 209      203 035 223                              17 037 110                11,92
 growth
 Fire                      44 412           5 540      246 033 502                              3 988 694                 61,68
 Hot surfaces              12 432           2 424         30 141 139                             3 491 149                 8,63
 Entry by intruders         6 433            1 371        8 818 360                              3 197 776                 2,76
 Lead                      10 886            2 145       23 348 169                              2 360 751                 9,89
 Overcrowding              16 695          20 470        341 751 103                            2 291 308                149,15
 Radon                     14 274            1 442      20 578 685                               1 683 736                12,22
 Electrical
                            7 391            1 387      10 252 000                                1 575 813                6,51
 problems
 Collision and
                            3 614             742          2 679 811                             1 567 767                  1,71
 entrapment
 Pests (Domestic
                            3 750            2 712        10 169 818                               777 049                13,09
 hygiene)
 Structural collapse        2 274            2435         5 536 565                                358 367                15,45
 Ergonomics                  1 315            633          832 629                                 282 748                 2,94
 Excess heat                  692             643          444 626                                   92 649               4,80
 Food safety                    0               0                 0                                           0               0
 Sanitation
                                0               0                 0                                           0               0
 (Personal hygiene)
 Carbon monoxide                0               0                 0                                           0               0
 Noise                          0               0                 0                                           0               0
 Falls - baths                  0               0                 0                                           0               0
 Water supply                   0               0                 0                                           0               0
 Uncombusted fuel
                                0               0                 0                                           0               0
 gas
 Lighting                       0               0                 0                                           0               0
 Explosions                     0               0                 0                                           0               0
 Total with any
                          619 409           4 039     2 517 006 756                         290 321 576                    8,67
 Category 1 hazard

BREG ROUP.COM                                                   © B uil din g Re s e a rch Establ ish me nt Limite d           15
Table 3 Notes:
1. The total sum of all dwellings with Category 1 hazards will be less than the sum of the individual hazards
as some dwellings will have more than one Category 1 hazard.
2. The total sum required to remedy all Category 1 hazards is less than the total number of Category 1
hazards multiplied by the average costs; this is because the modelling avoids the double counting of
costs where repair work/energy improvements mitigate more than one hazard.
3. Sample sizes for some Category 1 hazards are very small and are included for quantification purposes
only. For some, like explosions, no cases were identified in the survey. There will, therefore, be a degree
of uncertainty around these estimates because any calculations relating to cost benefits and payback
periods are very sensitive to the mix of hazards present in England.
4. Three of the 29 HHSRS hazards are not measured in the EHS (asbestos, biocides, volatile organic
compounds) because they require an intrusive inspection, which is not practicable in a sample survey.
Figure 2: Decile costs to mitigate Category 1 hazards, excess cold, falls on stairs and all Category 1
hazards, in private rented homes, 2019
1 The HHSRS likelihood of harm and harm outcome scores are also used in the COPH model.
BREG ROUP.COM © B uil din g Re s e a rch Establ ish me nt Limite d 16Social rented homes The social rented sector comprises around 17% of English homes (around 4.1 million dwellings 21), but its share of all poor housing in England (9%) and share of total costs of poor housing to the NHS (6%) is much lower. • Around 217,000 social rented homes had the most serious HHSRS hazards representing a total cost to the NHS of around £65 million per annum. • The average cost to make homes safe from these hazards was £3,784. • If all hazards were mitigated now, the payback to the NHS would be realised between 12 and 13 years. Unlike the private sector, Category 1 falls on stairs hazards were both the most common hazard (around 80,300) and incurred the largest cost burden to the NHS (around £17 million per annum), Table 4. Around 22,600 homes (less than 1%) were excessively cold. The age and dwelling type profile of social rented homes is notably different from those in the private sector; the former tend to be of more modern construction (a smaller proportion built before 1945) and more likely to comprise purpose-built flats which offer less risk of serious falls on stairs and on the level. In addition, ongoing housing and maintenance programmes by social landlords, and previous substantial investment e.g., through Decent Homes Standard funding, have resulted in notable improvements to the social housing stock, particularly in relation to energy efficiency. It is worth noting that over half (54%) of social renters had one or more household members with a long- term illness or disability. The proportions for private renters, and owner occupiers were 25% and 31% respectively. Long term illness is related to household age; around a quarter (26%) of social renters were aged 65 years or over 22. The distribution of the costs to mitigate excess cold and all types of poor housing looks different for social housing. While 80% of poor social housing can be remedied for less than £4,500, costs rise sharply for the remaining Category 1 hazards. This sharp rise is mainly due to more than 10% of poor housing having an overcrowding hazard. The average cost to mitigate overcrowding was around £20,400 across all tenures, a cost that enables an extension of living space to be made. However, the remedy for overcrowding for social renters is normally a transfer to larger accommodation offered by the landlord. Despite social housing generally being of a higher standard than the private sector stock, social landlords face many challenges in enabling continuous stock improvement, including the mitigation of poorer housing where it exists. As with other tenures, some serious hazards can remain ‘under the radar’ as not all tenants will be aware or will report serious defects in their home. Like private landlords and owner occupiers, social landlords also face the challenge of finding suitably qualified retrofitters and face pressure on their capital expenditure. 21 2019-20_EHS_Headline_Report_Section_2_Stock_Annex_Tables.xlsx (live.com) 22 EHS 2019 to 2020 Headline report, https://www.gov.uk/government/statistics/english-housing-survey-2019-to-2020-headline report, Section 1, household tables, Annex Table 1.3. BREG ROUP.COM © B uil din g Re s e a rch Establ ish me nt Limite d 17
Table 4: Summary of costs and benefits, with Category 1 hazards ordered by NHS savings per annum if
the hazard was mitigated, in social rented homes, 2019

                       Number of     Average cost     Total cost to           Savings to the NHS
                                                                                                                       Payback
 Hazard                Category 1     per dwelling mitigate hazard            per annum if hazard
                                                                                                                        (years)
                         hazards               (£)             (£)                  mitigated (£)

 Falls on stairs           80 262             618       49 566 227                             17 059 312                  2,91
 Excess cold               22 615           3 800        85 936 615                            11 673 099                  7,36
 Falls on the level        40 616             1114       45 251 685                            10 500 813                  4,31
 Damp and mould
                           18 764             985         18 481 721                            9 775 980                  1,89
 growth
 Falls between
                           10 410            1 907       19 850 127                              5 434 518                 3,65
 levels
 Overcrowding              26 340           20 413     537 683 439                              3 615 038                148,74
 Sanitation
                            9 862            1043        10 281 329                              2 091 182                 4,92
 (Personal hygiene)
 Pests (Domestic
                            5 634           2 236        12 597 250                               1 167 438               10,79
 hygiene)
 Radon                      8 628            1 449       12 506 215                               1 017 744               12,29
 Fire                       5 150            1 902        9 795 073                                 902 174               10,86
 Electrical
                            2 744           4 733        12 987 077                               585 040                22,20
 problems
 Hot surfaces               1 868            2 427        4 533 072                                 524 571                8,64
 Noise                      1 030            1 478         1 522 138                                512 643                2,97
 Structural collapse        2 316             424           981 459                               364 986                  2,69
 Food safety                 544            2 883          1 568 131                                 115 274              13,60
 Lead                        435             2 152          936 317                                  94 335                9,93
 Entry by intruders             0               0                 0                                           0              0
 Collision and
                                0               0                 0                                           0              0
 entrapment
 Carbon monoxide                0               0                 0                                           0              0
 Ergonomics                     0               0                 0                                           0              0
 Falls - baths                  0               0                 0                                           0              0
 Excess heat                    0               0                 0                                           0              0
 Water supply                   0               0                 0                                           0              0
 Uncombusted fuel
                                0               0                 0                                           0              0
 gas
 Lighting                       0               0                 0                                           0              0
 Explosions                     0               0                 0                                           0              0
 Total with any
                          217 370           3 784       824 477 875                            65 434 145                 12,60
 Category 1 hazard

BREG ROUP.COM                                                   © B uil din g Re s e a rch Establ ish me nt Limite d          18
Table 4 Notes:
1. The total sum of all dwellings with Category 1 hazards will be less than the sum of the individual hazards
as some dwellings will have more than one Category 1 hazard.
2. The total sum required to remedy all Category 1 hazards is less than the total number of Category 1
hazards multiplied by the average costs; this is because the modelling avoids the double counting of
costs where repair work/energy improvements mitigate more than one hazard.
3. Sample sizes for some Category 1 hazards are very small and are included for quantification purposes
only. For some, like explosions, no cases were identified in the survey. There will, therefore, be a degree
of uncertainty around these estimates because any calculations relating to cost benefits and payback
periods are very sensitive to the mix of hazards present in England.
4. Three of the 29 HHSRS hazards are not measured in the EHS (asbestos, biocides, volatile organic
compounds) because they require an intrusive inspection, which is not practicable in a sample survey.
Figure 3: Decile costs to mitigate Category 1 hazards, excess cold, falls on stairs and all hazards,
in social rented homes, England 2019
1 The HHSRS likelihood of harm and harm outcome scores are also used in the COPH model.
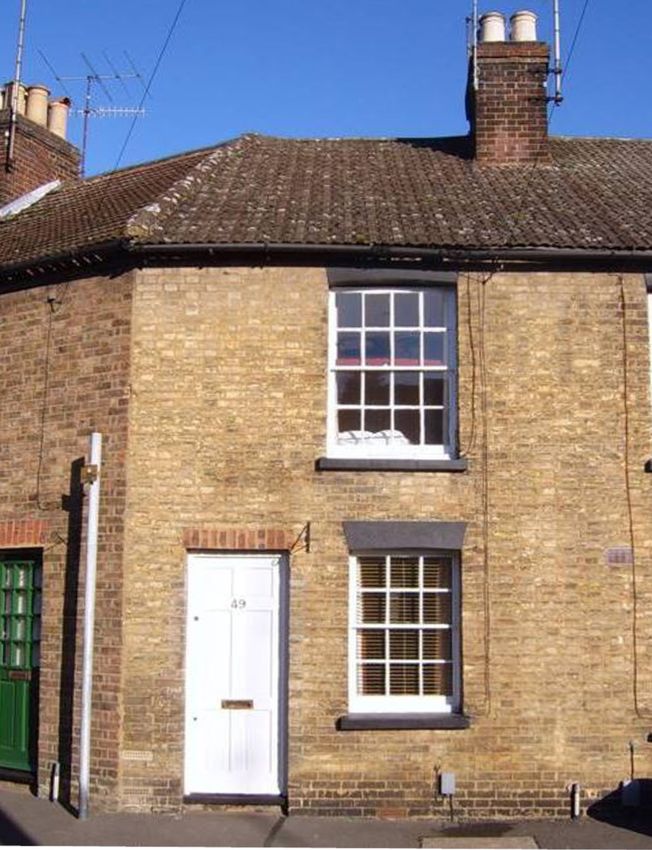
BREG ROUP.COM © B uil din g Re s e a rch Establ ish me nt Limite d 19Case study This case study has been put together based on the typical characteristics of a home with Category 1 hazards, informed by the data collected from homes and households in the English Housing Survey process. The case study should not be understood as referring to a particular property. This home is a small owner-occupied Victorian terraced house. It is situated on a corner plot and is significantly wider at the front than the back. There are two bedrooms upstairs accessed from the only staircase. Downstairs there is a living room, a kitchen, and a small bathroom extension at the rear. The house is well maintained but has not been updated to current standards. It is occupied by a vulnerable older person (78 years), who lives alone. BREG ROUP.COM © B uil din g Re s e a rch Establ ish me nt Limite d 20
The stairs are steep, with no guarding on one side, and no evidence that any was ever present. There
is no handrail on the wall. The stairs lead up to a small landing, from which access is gained to the two
bedrooms. The door opening projects beyond the landing. The kitchen floor, to which the stairs descend,
is tiled and the wall is very close to the foot of the stairs. The artificial lighting is located in the ceiling above
the top step, with a switch at the bottom.

The home is assessed as having a Category 1 HHSRS ‘falls on stairs’ hazard. Even an occupier who is
familiar with the layout of the staircase and its limitations will be taking a major risk every time they are
used, particularly if they are ageing and vulnerable. If, for example, they were to get up in the night to visit
the bathroom, they would have to open the bedroom door and descend the stairs in the dark, with no
banister or handrail to hold or break their fall if they were to slip on the wooden treads. If they were to fall
they face a collision with a hard wall and floor.

The outcome of such a fall would typically involve a broken limb. In this case it is suggested that there
would be a 10% chance of death or paralysis, if a fall involving medical intervention was to occur. The
outcome is likely to be worse in this case, and there is no other occupant to help or call an ambulance.
The home also has a Category 1 excess cold hazard as there is no central heating or insulation. This would,
again, impact on the likely outcome of any fall in the home.

A summary of the impact of a recommended improvement package to just make the home healthy and
safe is presented in Table 5 below:

Table 5: Improving a home with a Category 1 HHSRS falls on stairs hazard

                                 Dwelling as it stands                          Dwelling after intervention
 Cost of stair intervention*     £0                                             £450
 Cost of cold intervention*      £0                                             £12 000
 HHSRS Falls on stairs           Band A (Cat.1)                                 Band D
 HHSRS cold                      Band A (Cat 1)                                 Band E
 SAP                             21                                             57
 Annual fuel cost                £1 947                                         £985
 Carbon emissions                8,430 kg pa                                    3,960 kg pa
 Household in Fuel Poverty       Yes                                            No
 Cost to NHS pa of HHSRS
                                 £1 227                                         £68
 stair hazard
 Cost to NHS pa of HHSRS
                                 £2 621                                         £124
 cold hazard
 Asset value                     £73 250                                        £92 500

*Cost of ‘stair’ intervention (2019 prices) includes:
• Balustrading and handrail to stairs.
• Non-slip carpeting to stairs
• Additional light switch at top of stairs

*Cost of ‘cold’ intervention includes:
• Full programmable gas central heating with energy efficient condensing boiler
• Loft insulation
• Full double glazing

BREG ROUP.COM                                                            © B uil din g Re s e a rch Establ ish me nt Limite d   21
For more information on
BRE:
+44 (0)333 321 88 11
enquiries@bregroup.com
www.bregroup.com
BREG ROUP.COM © B uil din g Re s e a©rch
B uil
Establ
din g Re
ishsme
e arch
nt Limite
Esta bli
d s h m e nt L i m i te
2d2You can also read