The DA meter - a magic bullet for harvest decisions, or just hype? - Chris Watkins
←
→
Page content transcription
If your browser does not render page correctly, please read the page content below
The DA meter – a magic bullet for
      harvest decisions, or just hype?
Chris Watkins
Cornell University, Ithaca, NY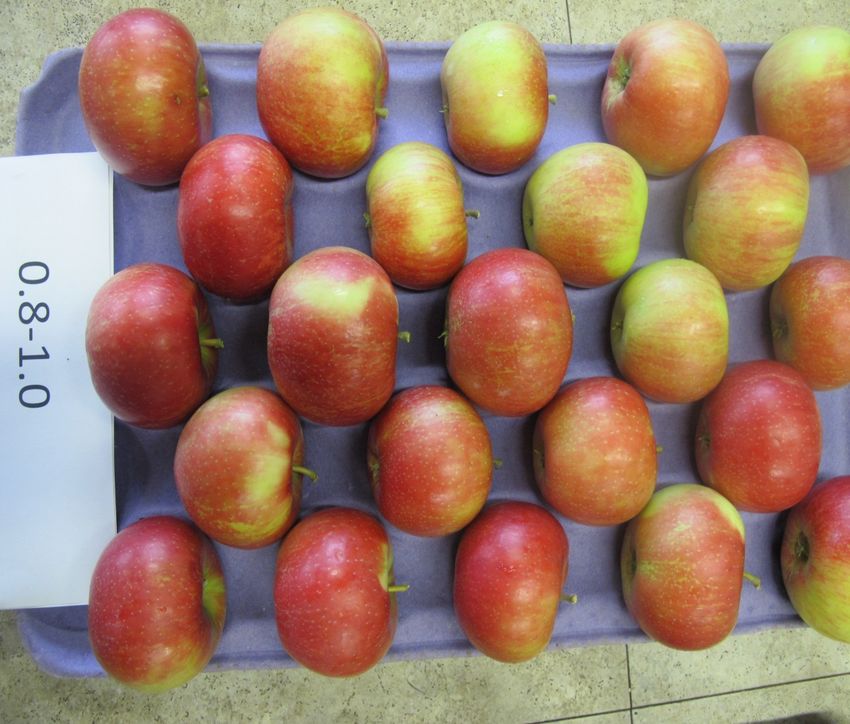
DA Meter Assessment of Apple Maturity:
Myths, Realities and Challenges

• “There has been much hype about maturity
  assessment of tree fruit using the DA meter
  developed at the University of Bolgna, Italay and
  distributed by T.R. Turoni S.L.R.”

                 Peter Toivonen, 2014.
                 Orchard network, Ontario,
                 Canada, 18 (4): 10-11.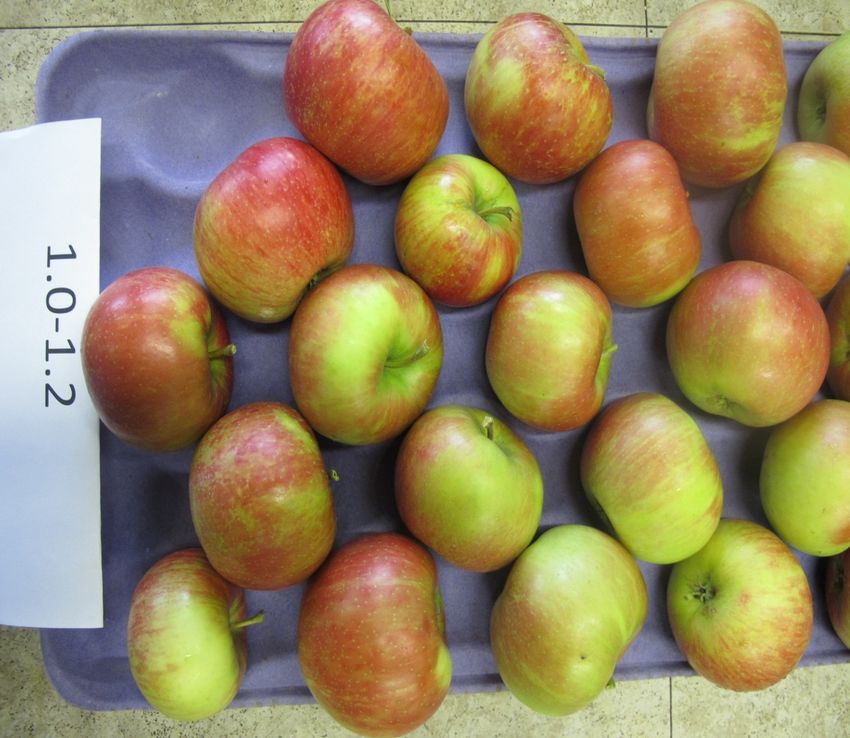
The collective research of
Franny Doerflinger        Colleagues
Yosef Al-Shoffe           • Peter Toivonen
Jackie Nock               • Jennifer DeEll
Shao Xingfeng             • Ines Hanrahan
Kazem Arzani              • ‘Mimmo’ Costa

With funding from         And assistance from AgroFresh team
                          responsible for Harvista trials
- NY Apple Research and   Nate Reed
  Development Program     Fernando Edagi
- USDA-NIFA               Ken Silsby
                          Keith Culver
- AgroFresh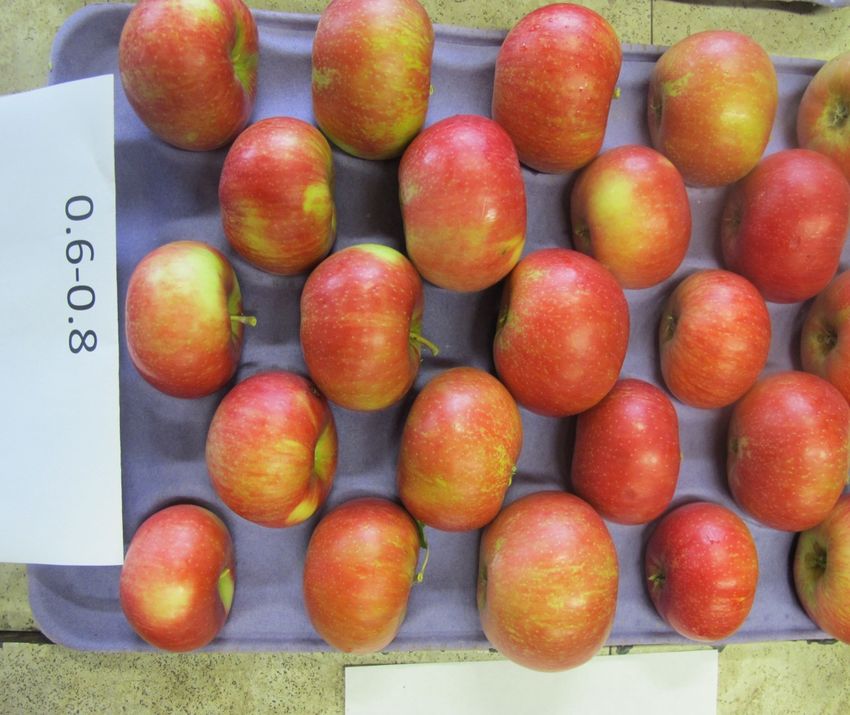
Outline
• What is the DA meter?
• Why are we interested, and what are the criteria
  for evaluation?
• Results
• Conclusions
Outline
• What is the DA meter?
• Why are we interested, and what are the criteria
  for evaluation?
• Results
• Conclusions
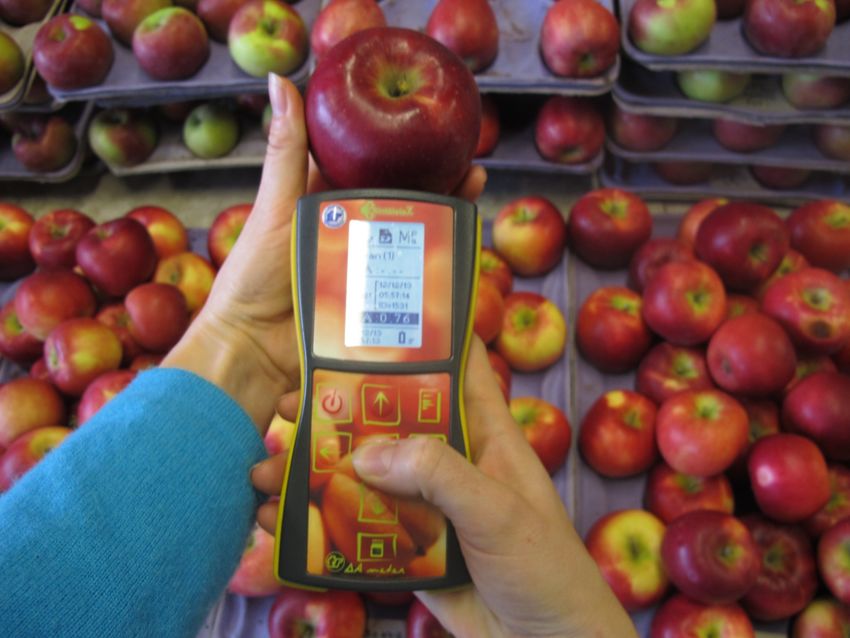
IAD measurements with the DA meter
• Delta Absorbance (DA) meter
  – Hand held non-destructive measurement
  – Developed from vis/NIR spectroscopy
  – Difference of Absorbance (DA or IAD) between 670 and
    720nm
Absorbance measurement principles

             IAD measurement:
•   Chlorophyll a peaks at ~ 660 nm

•   IAD measures Chlorophyll a in the peel
        IAD = Abs (670 nm) – Abs (720 nm)

                        http://www.umich.edu/~chem125/softchalk/Exp2_Final_2/Exp2_Final_2_print.html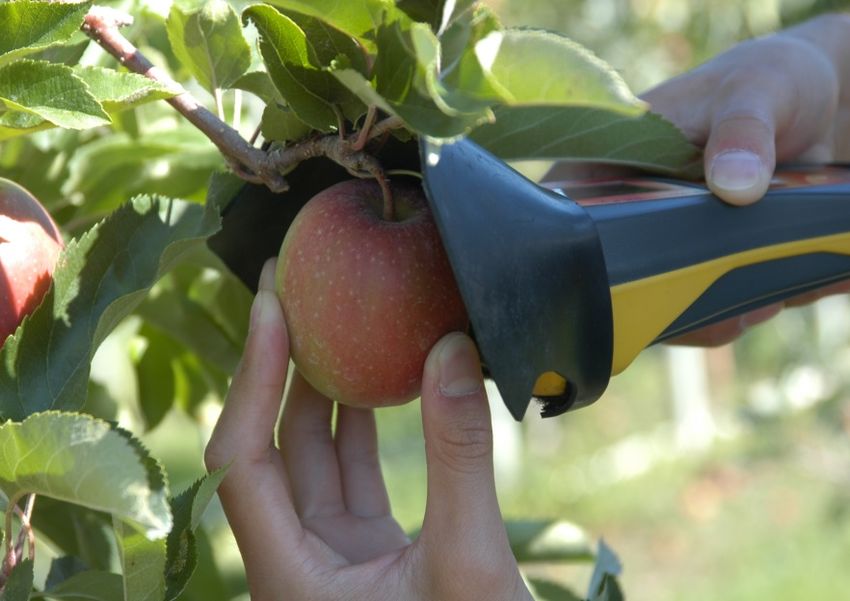
Essentially an electronic color chart that
  provides an index representing Chlorophyll a
  concentrations

But DA meter is not limited by red coloration of fruit

DA meter provides readings in the range of
0 to 3.0 for apple fruit

            Higher values = greener fruit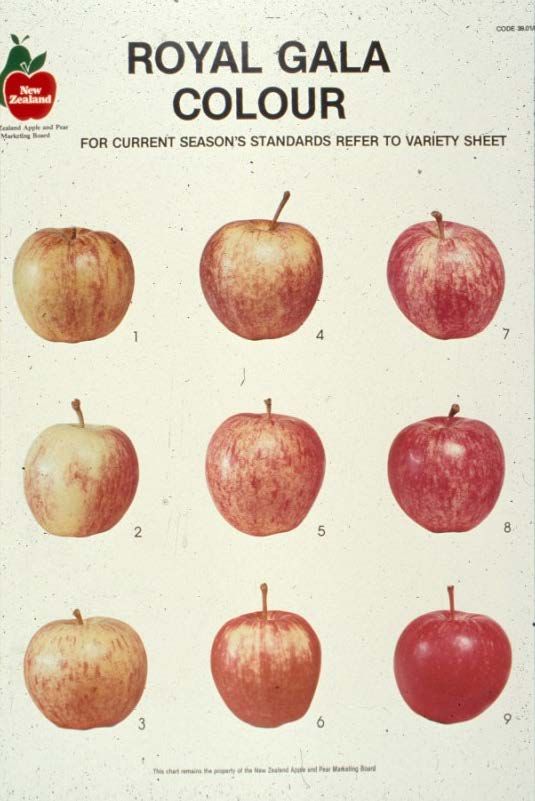
Field use?

                                            Courtesy of Peter Toivonen,

Courtesy of Ines Hanrahan,                  Agriculture and Food Canada, BC

Washington Tree Fruit Research Commission
Outline • What is the DA meter? • Why are we interested, and what are the criteria for evaluation? • Results • Conclusions
Why are we interested?
Harvest date is critical to quality of fruit
in the market place, and often
associated with storage disorder issues
100
75
STORABILITY ↗ ↖ QUALITY
(firmness, acidity, (color, flavor,
Relative change
starch, background sugar/acid ratio,
color) starch index)
50
25
Ethylene
0
0 50 100
Maturation and ripening periodCurrent tools to assess “Maturity”
(Harvest indices)
Maturity indices Quality indices
• Internal ethylene • Firmness
concentration (IEC)
• Soluble solids
• Starch pattern index concentration
(SPI)
• Acidity
• Red coloration
Where does the DA
meter fit in? • (background
color/ground color)Recent published research on the DA meter for apple fruit - examples • IAD values at harvest and after storage correlated with firmness, SSC and TA of ‘Red Delicious’, ‘Granny Smith’ and ‘Pink Lady’ – potential to sort fruit at harvest and after storage for different marketing classes (Nyasordzi et al., 2013). • IAD values do not relate to storage quality (other than chlorophyll) in fruit stored in CA or treated with 1- MCP (Toivonen and Hampson, 2014) • IAD values of 0.59 to 0.36 proposed as ‘start’ and ‘finish’ dates for long term air stored ‘Honeycrisp’ apples (DeLong et al., 2014).
With courtesy of John Delong
Honeycrisp DA meter model steps:
i) Measure fruit quality attributes ‘at harvest’ [including DA meter
readings(IAD)];
ii) Store 38oF for 3-4 months;
iii) Assess disorder incidence after removal;
iv) Optimal harvest window = period having high quality attributes
(at harvest),
and fewest disorders (post-harvest);
v) Optimal harvest window delineated in DA meter units.
(Note: usually a 2-week period)
152010-2012 Honeycrisp Quality, IAD & Disorder Data
900 90 90 12.5
Titrable Acidity (mg malic acid/100 ml juice)
850
80 85 12.0
800
70
80
750 11.5
Soluble Solids (%)
60
700 75
Firmness (N)
Color (%)
50 11.0
650
70
600 40 10.5
550 65
30
500 10.0
60
20 Color
450
Firmness 9.5
10 Soluble Solids 55
400
Titrable Acidity
350 0 50 9.0
1 2 3 4 5 6 7 8 9 10 11
1.2 100
Bitter Pit
1.1 90
Soft Scald
LTB
1.0 80
SB
0.9 IAD Units
Disorder incidence (%)
70
IAD Units = 1.203-0.087(wk)-0.013(wk)2
0.8
+0.001(wk)3; r2=0.99 60
IAD units
0.7
50
0.6 0.59
40
0.5
30
0.4 0.36
0.3 20
0.2 10
0.1 0
1 2 3 4 5 6 7 8 9 10 11 16
Harvest weeksHoneycrisp Harvest Maturity conclusions for Nova Scotia (John DeLong et al.) DA meter model message: As the Honeycrisp reading: i) ≤ 0.60 begin harvest i) Between 0.60 and 0.35 good for long-term storage ii)
Ignored admonitions from DeLong et al.
(2014)
• Develop for each cultivar
• Several years research required
• Regionally based
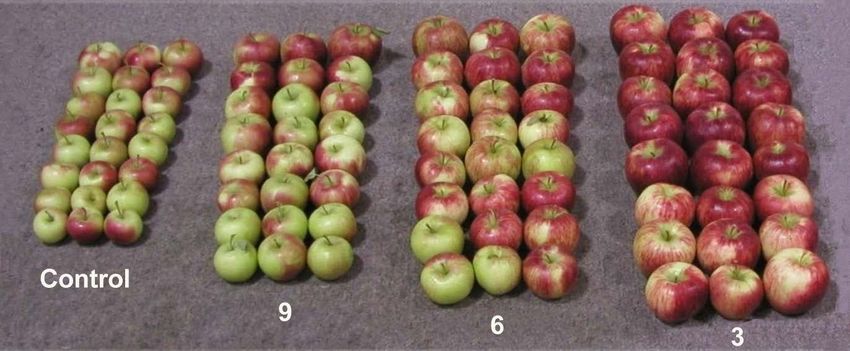
Fruit per cm-2 TCSAWhy region is important
• Excellent color development in Nova Scotia
• Different maturity profiles allowing more
concentrated harvest dates
– 3-4 harvests not uncommon in NY
• Different disorder development profiles
– Stippen (on tree pit appears more problematic in NY)
– Depending on region and growing season we have
much greater concern about soft scald and soggy
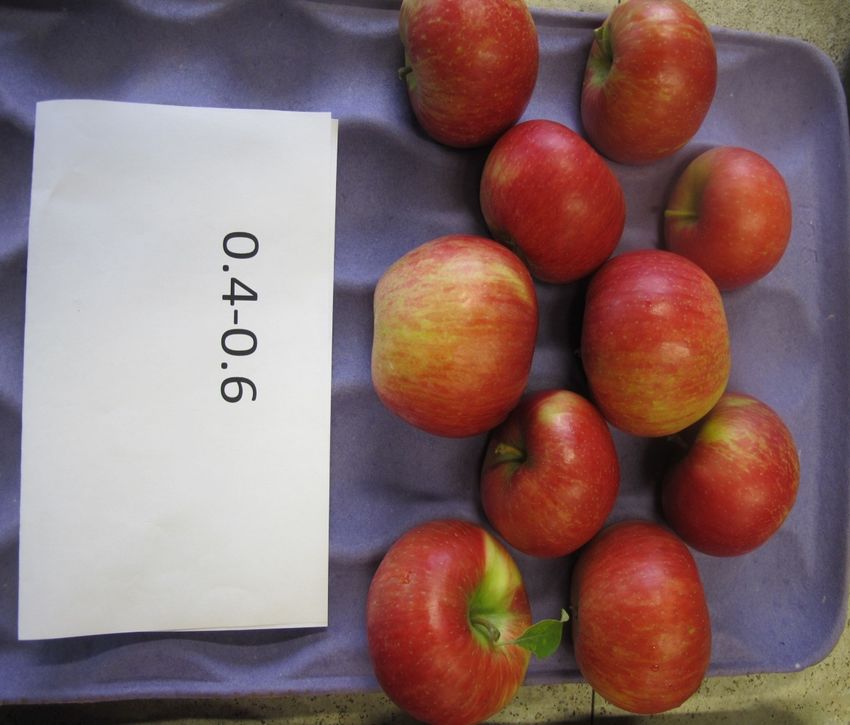
breakdownHoneycrisp separation by DA reading
Honeycrisp separation by DA reading
Our objectives To evaluate the DA meter by determining the relationships between IAD values and: • Other harvest indices such as ethylene and starch indices • Storability of fruit of different cultivars, especially incidence of physiological disorders • Effects of preharvest factors such as Harvista and other plant growth regulators (PGRs) – Especially important in NYS
Outline
• What is the DA meter?
• Why are we interested, and what are the criteria
  for evaluation?
• Results
• Conclusions
Some of our studies
1. ‘Delicious’ apples untreated or treated with Harvista
   (preharvest 1-MCP) or ReTain (AVG) to investigate
   relationships between IAD values, harvest indices and
   superficial scald (Arzani et al.)
2. ‘Honeycrisp’ apples untreated or treated with Harvista to
   investigate relationships between IAD values and soft scald
   (Al-Shoffe et al.)
3. Relationships between IAD values and harvest indices in
   Empire apple fruit (Doerflinger et al.)
4. Relationships between IAD values and harvest indices in fruit
   of 9 apple cultivars (Shao et al.)
1. Delicious and superficial scald
• Replicate ‘Delicious’ trees untreated or sprayed
  with Harvista or ReTain (gift from Valent
  Biosciences)
• Fruit harvested and divided into categories based
  on DA meter readings
• Internal ethylene concentrations (IECs) measured
  and fruit stored for scald development

           Only at harvest results today
IAD values and internal ethylene
concentrations (ppm) - Delicious
100 • Relationships between
90 and IAD values good for
80 untreated fruit
70
60 – lower IAD values =
IEC (ppm)
50
Control
riper fruit and higher IEC.
Harvista
40
ReTain • Harvista and ReTain
30
trts result in loss of
20
relationship within an
10
given IAD value.
0
0.8 - 1.0 1.0 - 1.2 1.2 - 1.4 Preharvest factors such as PGR may
interfere with interpretation of DA
meter readings2. ‘Honeycrisp’ and soft scald incidence • Replicate ‘Honeycrisp’ trees untreated or sprayed with Harvista • Fruit harvested at three 1-week intervals and divided into categories based on DA meter readings • Internal ethylene concentrations (IECs) measured and fruit stored at 33oF for soft scald development
Soft scald (%) in Honeycrisp apples at
different IAD value categories: Harvest 1
                 100
                 90
                 80
                 70
Soft scald (%)

                 60
                 50                                                                control
                 40                                                                Harvista
                 30
                 20
                 10
                  0
                   0-0.2 0.2-0.4 0.4-0.6 0.6-0.8 0.8-1.0 1.0-1.2 1.2-1.4 1.4-1.6
Soft scald (%) in Honeycrisp apples at
different IAD value categories: Harvest 2
100
90
80
70
Soft scald (%)
60
50 control
40 Harvista
30
20
10
0
0-0.2 0.2-0.4 0.4-0.6 0.6-0.8 0.8-1.0 1.0-1.2 1.2-1.4 1.4-1.6Summary
• Soft scald incidence is higher in less ripe fruit (lower IAD values).
• Harvista can decrease soft scald development.
• However, relationship between disorder development and IAD
values can be dissociated by
– Harvest date
– a PGR such as Harvista.
Note - Commercial acceptability of fruit may over-ride
decisions made on basis of IAD values.Honeycrisp separation by DA reading Huge variation among standards now. How will these change for long term CA storage?
3. Empire
• ‘Empire’
  – fruit from orchard in Western NY
  – Untreated or treated with ReTain (AVG) 4 weeks or
    Harvista (1-MCP) 1 week before first harvest
  – 3 harvests: September 26, October 3 and 10
    Measurements:
  – IEC
  – IAD
  – Firmness
  – SPI

                                                        32
SPI vs. range of IAD
Firmness vs. range of IAD
IEC over range of IAD

                        35
3. Relationships between IAD values and harvest indices for 9 cultivars • Harvest indices plus IAD values assessed at weekly intervals for several weeks
Relationships between IAD values and
chlorophyll a
Cultivar            R2
NY-1                0.797
NY-2                0.756
Cortland            0.818
Fuji                0.732
Honeycrisp          0.817
Jonagold            0.481
Mutsu               0.678
McIntosh            0.671
RedCort             0.633
Example of relationship between IEC
and SPI with IAD values
Summary:
• Generally good correlations between IAD values
  and chlorophyll concentrations, but exceptions
  exist.
• Depending on cultivar (e.g. ‘RedCort’),
  relationships between IAD values and IEC and
  starch indices are good. Suggests that in some
  cases might be useful non-destructive measure if
  relationships apply across orchards and growing
  regions.
Conclusions
• Correlations of IAD values with other harvest indices are
  present, but variable, and depend on cultivar.
   – As stated by Peter Toivonen, ‘IAD tells you about how much
     chlorophyll is in the peel of the apple – nothing more’
• Relationship between IAD values at harvest and disorders
  may be affected by preharvest factors such as PGRs.
• Research is ongoing to investigate its usefulness for
  cultivars within and across different growing regions.
• Overall unlikely to replace standard harvest indices, but
  rather supplement, although future potential for precision
  harvest if reliable in the field.
• Incorporation in to presort lines may have greater
  potential
Thank you
Questions?You can also read


