THE EPA-USFS AIRNOW FIRE AND SMOKE MAP SENSOR DATA PILOT - SIM LARKIN US FOREST SERVICE (USFS) AIRFIRE
←
→
Page content transcription
If your browser does not render page correctly, please read the page content below
The EPA-USFS
AirNow Fire and Smoke Map
     Sensor Data Pilot
Sim Larkin                 Karoline (Johnson) Barkjohn
US Forest Service (USFS)   US Environmental Protec6on Agency (EPA)
AirFire                    Office of Research and Developement

                                                   ASIC Webinar Series
                                                          April 1, 2021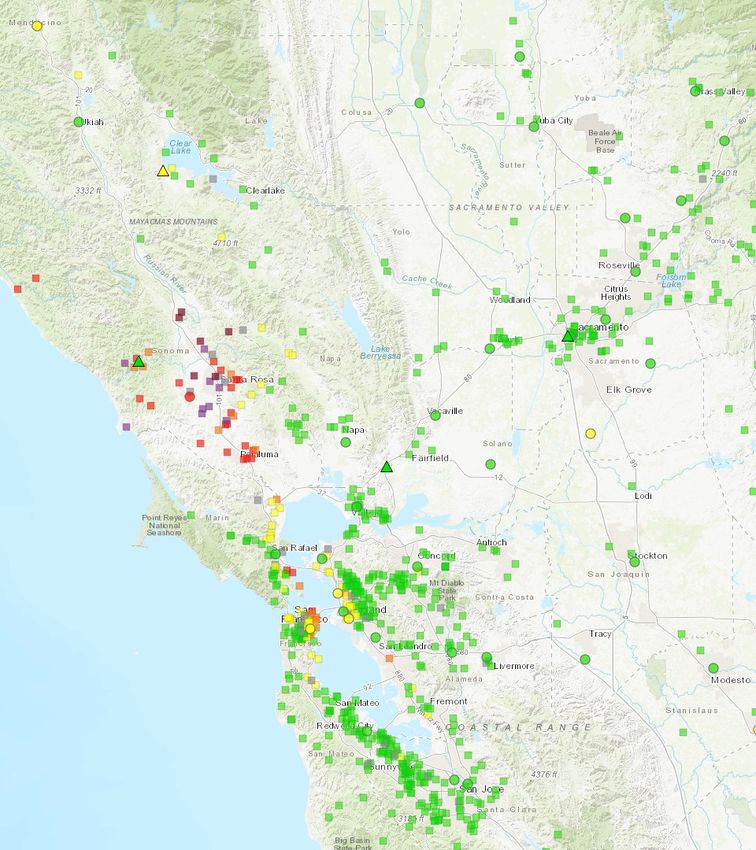
With many others
   EPA Office of Air Quality   EPA Office of Research and Developement
   Planning and Standards      • Amara Holder
   • Ron Evans                 • Andrea L. Clements
   • John White
   • Lourdes Morales           USFS AirFire
   • Michelle Wayland          • Stuart Illson (University of Washington)
   • Rob Wildermann            • Jonathan Callahan (Mazama Science)
   • Alison Davis
   • Susan Stone               USFS
   • Kristen Benedict          • Pete Lahm
                                                                            2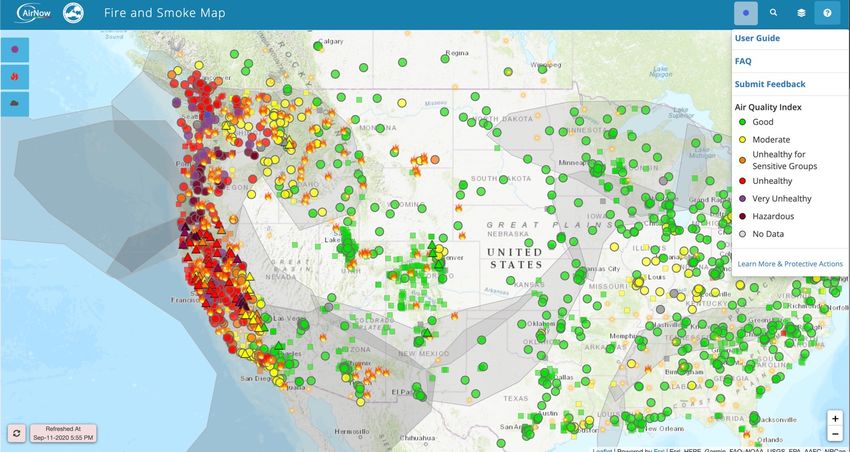
Fire and Smoke Map v1 (2020)
                    https://fire.airnow.gov
                  September 11, 2020 shown
Desktop:                                      Mobile:

                                                        3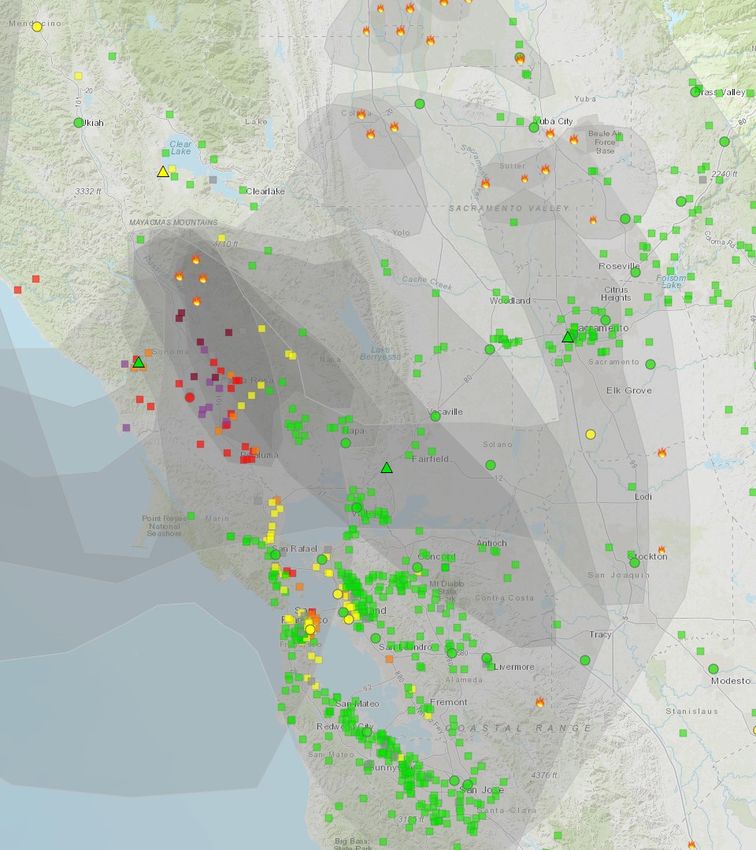
Objectives
• Provide enhanced air quality
  information critical during
  periods of wildland fires and
  smoke

• Pilot the inclusion of
  air quality measurements
  from low-cost sensors in a
  consistent manner

                                  4
                                      Photo: NCSU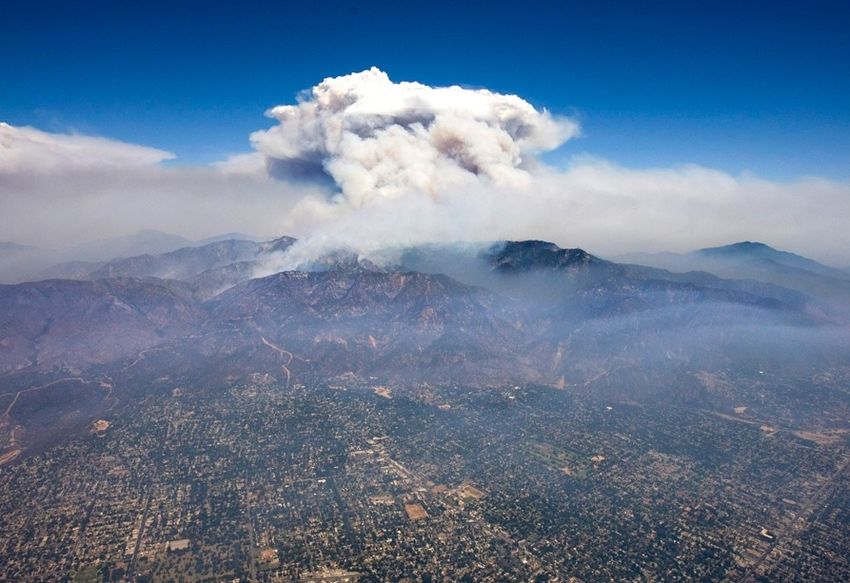
EPA AirNow
 • Year-round 24/7 coverage
 • Delivers near real-time data (ozone & particles)
 • Next-day Air Quality Index (AQI) forecasts for nearly 500 cities
 • State-of-the-science information about air pollution health effects
   for the public, media, and stakeholders

U.S. Forest Service
Interagency Wildland Fire Air Quality Response Program
 • Enhanced smoke monitoring, modeling, messaging, and
   interagency coordination during wildfires
 • Trained smoke specialists (Air Resource Advisors) on wildland
   fire incidents
 • Smoke Outlooks and other products (transportation, safety)
                                                                   5
                                                                       Photo: NCSU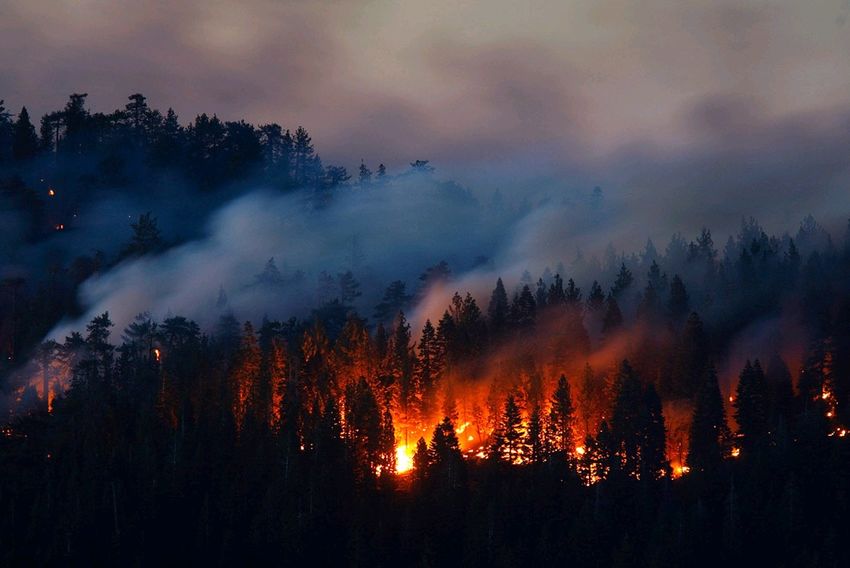
• Over 7.4 million page views over about 3 months
 The pilot met    • Numerous comments from public and
                    government agencies welcoming the new
 a public need      information
 during one of        • “The EPA website change allows lower quality
                        sensors to provide information that helps real
 the worst fire          people decide how to live their lives in a city
                        threatened by smoke and catastrophic fires.
seasons in U.S.         It was a positive and very useful step”
        history      • “I have asthma and the information on this
                       site has helped me to make critical decisions
                       about how to protect myself during the
                       wildfires in Sonoma County this month
                       August 2020. ………Overall, I give this an A
                       grade for information in real time to the
                       public”

                                                                       6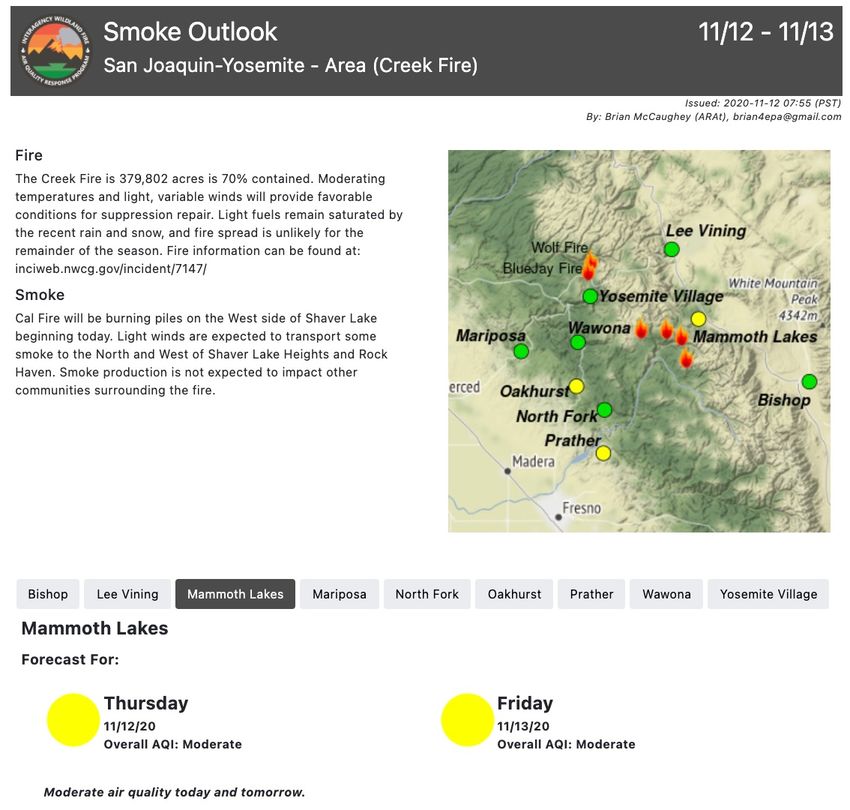
Data Layers
Air Quality Observations (PM2.5)
             Permanent Monitors

             Temporary Monitors

               Low-Cost Sensors

Fire Information
        (Wildland) Fire Incident Reports

              Satellite Detections

Smoke Plume Extent
            Satellite Plume Extents
                                                                   7
                                           Oct 27, 2019 10AM PDT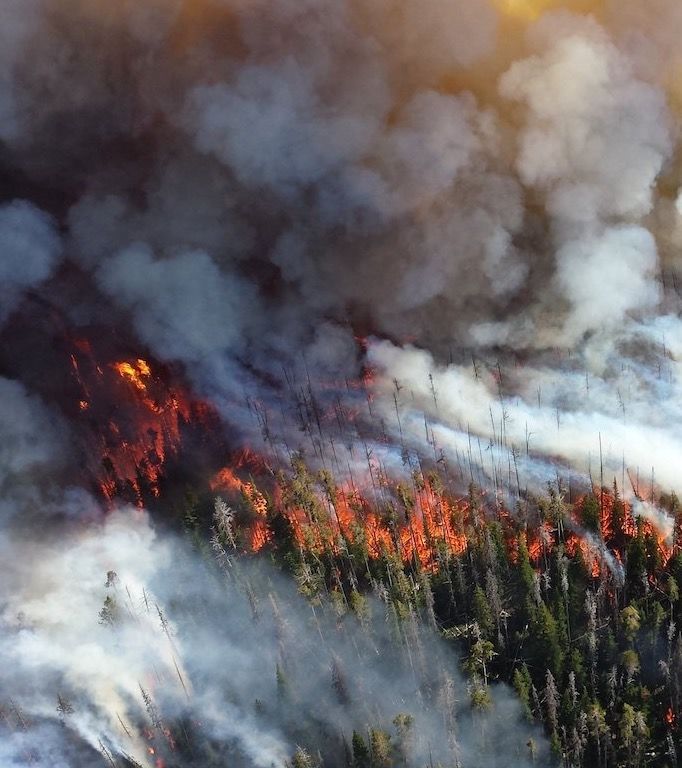
Data Layers
Air Quality Observations (PM2.5)
            Permanent Monitors

Fire Information

Smoke Plume Extent

                                                           8
                                   Oct 27, 2019 10AM PDT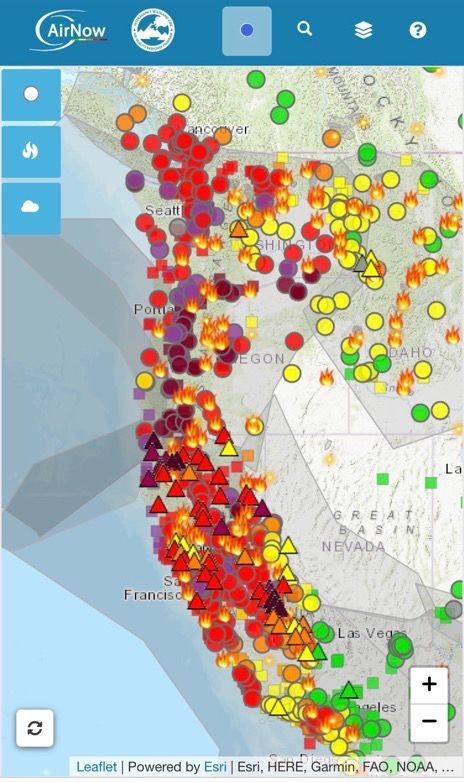
Data Layers
Air Quality Observations (PM2.5)
Permanent Monitors
Temporary Monitors
Fire Information
Smoke Plume Extent
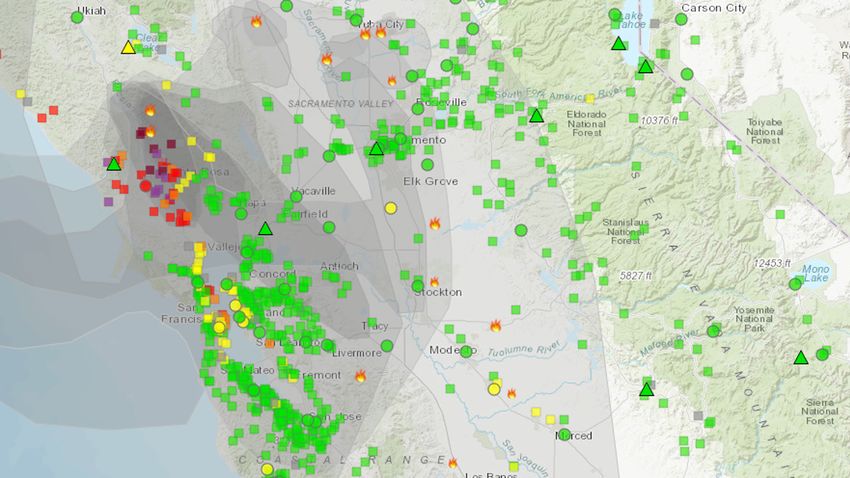
9
Oct 27, 2019 10AM PDT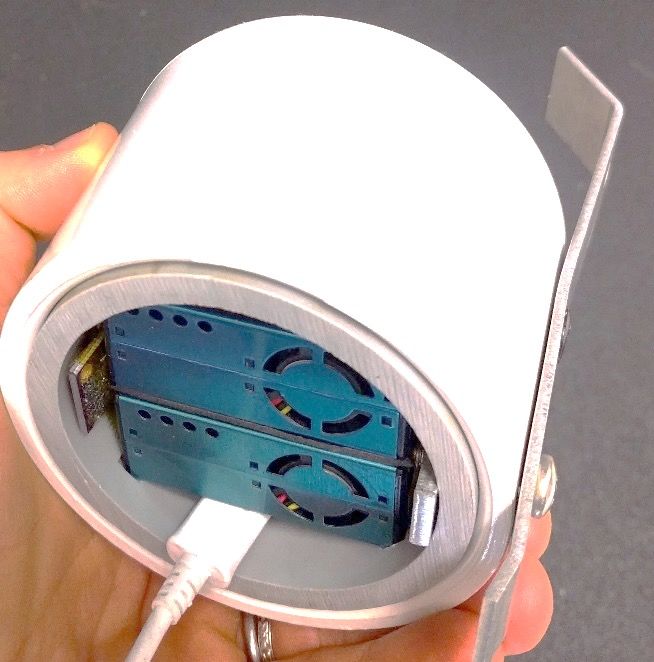
Data Layers
Air Quality Observations (PM2.5)
            Permanent Monitors

            Temporary Monitors

             Low-Cost Sensors

Fire Information

Smoke Plume Extent

                                                           10
                                   Oct 27, 2019 10AM PDT
In Your Area
• Geolocated relevant informaGon
• Direct access to incident-issued
Special Smoke Statements
11Special Smoke Statements
• If applicable to your location, alert will appear:
• Accesses outlooks created by specialists with info on fires, smoke:
12Data Considerations / Challenges
Timeliness:
• Different monitors and sensors have different lag 6mes before the data
is available
Time Averaging:
• There is a tradeoff and tension between displaying rapidly changing
shorter 6me averages and having longer 6me averages that are beeer
related to health impacts
Consistency:
• Low-cost sensors are more likely to be moved, turned off,
NowCast AQI or have !me-averaging
other inconsistencies length
• Quality assurance
sub-hourly hourly and correc6on required for sensor data
daily to match
permanent / temporary monitors 13Data Considerations / Challenges
Timeliness:
• Different monitors and sensors have different lag 6mes before the data
is available
Time Averaging:
• There is a tradeoff and tension between displaying rapidly changing
shorter 6me averages and having longer 6me averages that are beeer
related to health impacts
Consistency:
• Low-cost sensors are more likely to be moved, turned off, or have
other inconsistencies
• Quality assurance and correc6on required for sensor data to match
permanent / temporary monitors
14Air Quality Observation Colors
(symbols are filled in with the appropriate color)
• We show colors based on the measured NowCast AQI level
• NowCast is a time average
• Levels relate to the Air Quality Index (AQI) color scale:
Gray indicates data is missing (or failed quality assurance steps)
15
More details: hLps://www.airnow.gov/aqi/aqi-basics/using-air-quality-index/Symbology of Air Quality Observations
(based on type of device)
PERMANENT
MONITOR ~4in
(circle)
LOW-COST
Example: Permanent Site SENSOR
(Jefferson Co., AL) (square)
~6V
TEMP
Example: Purple Air PA-II
MONITOR
(triangle)
16
Example: E-BAMS Photos: Jefferson County Public Health, MetOne, Purple AirSymbology of Air Quality Observations
(based on type of device)
+ Higher quality + Lower cost
PERMANENT + Professionally + 7x number of
sited permanent sites
MONITOR ~4in
(circle) + Professionally + Reports quickly
maintained LOW-COST
Example: Permanent Site SENSOR
(Jefferson Co., AL) (square)
~6ft
- Higher cost - Unknown si6ng
TEMP - Limited in number - Unknown
Example: Purple Air PA-II
maintenance
MONITOR - May be slow to
(triangle) report - Need for more
Example: E-BAMS data qa/qc 17
Photos: Jefferson County Public Health, MetOne, Purple AirSteps to Quality Assure and
Correct PurpleAir data
18Research Efforts enabling the sensor data
correction AirNow sensor data pilot
Secondary Data Project 24-hr U.S. Correction
Team: EPA ORD, partner local air agencies
Development
Objective: Evaluate collocated PurpleAir Method: Collocations with FEM and
sensors deployed by local agencies FRM measurements
Objective: Build a correction model
Long Term Performance Project that improves sensor performance
(and LTPP+) across the U.S.
Team: EPA ORD, partner local air agencies 1-hr Ambient and Smoke
Objec.ve: Evaluate mul^ple sensors across Impacted Validation
the U.S. (LTPP+ PurpleAir only)
Method: Collocations with FEM and
Smoke Impacted Projects near FEM measurements
Objective: Test the correction
Team: EPA ORD, Regions 9 & 10, USFS model on ambient and smoke
Objective: Evaluate multiple sensors in smoke impacted datasets
19 FEM=Federal Equivalent Method 19
FRM=Federal Reference MethodResearch Efforts enabling the sensor data
correction AirNow sensor data pilot
Secondary Data Project 24-hr U.S. Correction
Team: EPA ORD, partner local air agencies
Development
AirNow Sensor
Objective: Evaluate collocated PurpleAir Method: Collocations with FEM and
sensors deployed by local agencies FRM measurements Data Pilot
Objective: Build a correction model Method: Apply data
Long Term Performance Project that improves sensor performance cleaning methodology
(and LTPP+) across the U.S. and U.S. correction to
sensor data before
Team: EPA ORD, partner local air agencies 1-hr Ambient and Smoke inclusion on the map
Objec.ve: Evaluate mul^ple sensors across Impacted Validation Objective: Provide
the U.S. (LTPP+ PurpleAir only) more spatially resolved
Method: Collocations with FEM and
air quality data
Smoke Impacted Projects near FEM measurements
especially during
Objective: Test the correction
wildfire episodes
Team: EPA ORD, Regions 9 & 10, USFS model on ambient and smoke
Objective: Evaluate multiple sensors in smoke impacted datasets
20 FEM=Federal Equivalent Method 20
FRM=Federal Reference MethodSteps to display PurpleAir Hourly data with sensor failure
data on the Pilot
Channel B PM2.5 (µg m-3)
Points excluded 70% is a
compromise
Cleaning steps removing the
worst offending
1. Only outdoor sensors selected points but
leaving some
2. Average PurpleAir PM2.5 and RH data to 1-hour ques^onable
3. Clean the data; Remove data when channels increasing data
differ by ≥ ± 5 µg m-3 and ≥ ± 70% availability
Channel A PM2.5 (µg m-3)
A & B channels
21
PurpleAir underside viewSteps to display PurpleAir
data on the Pilot
Cleaning steps Smoke Impacted
1-hr PurpleAir PM2.5 (µg m-3)
1. Only outdoor sensors selected
2. Average PurpleAir PM2.5 and RH data to Correction
1-hour
Raw (cf_atm)
3. Clean the data; Remove data when channels U.S.
differ by ≥ ± 5 µg m-3 and ≥ ± 70%
4. Average A & B channels
5. RH removed if outside 0-100%, if removed
1-hr FEM or near FEM PM2.5 (µg m-3)
or missing replace with 50%
6. Apply U.S.-wide correction equation to 1-hr
PM2.5 corrected=
data 0.524*[PurpleAirCF=1; avgAB] - 0.0852*RH + 5.72
22Steps to display PurpleAir
data on the Pilot
Cleaning steps
1. Only outdoor sensors selected
2. Average PurpleAir PM2.5 and RH data to 1-hour
3. Clean the data; Remove data when channels
differ by ≥ ± 5 µg m-3 and ≥ ± 70%
4. Average A & B channels
5. RH removed if outside 0-100%, if removed or Traditional AQI: 24-hr averages
missing replace with 50% NowCast: Weighted 12-hr rolling average
• Heavily weighted to recent hours under
6. Apply U.S.-wide correc6on equa6on to 1-hr rapidly changing conditions
data • Balances:
• Need for real-time data
7. Calculate the NowCast AQI • Measurement uncertainty
• Uncertainty in health effects
23
Image: Airnow.govNext steps
CorrecKon equaKon
extension into higher
concentraKon space
• Finalize and apply an updated correction
equation to extend the applicable
concentration range using newly available data
• During 2020 wildfires, new very high concentration
collocation data from CA and OR was collected
24Resources
Additional resources and details about EPA's work with air sensors
(including webinars/presentations/conference presentations on this effort)
http://www.epa.gov/air-sensor-toolbox
AirNow Fire and Smoke Map:
https://fire.airnow.gov/
Project Publications:
• Holder, A., A. Mebust, L. Maghran, M. McGown, K. Steward, D. Vallano, R. Elleman, and K. Baker, 2020. ‘Field
Evaluation of Low-Cost Particulate Matter Sensors for Measuring Wildfire Smoke’, Sensors.
https://www.mdpi.com/1424-8220/20/17/4796
• Barkjohn (Johnson), K, B. Gantt, A. Clements, 2020 ‘Development of a United States Wide Correction for
PM2.5 Data Collected with the PurpleAir Sensor’, Atmospheric Measurement Techniques Discussion.
https://doi.org/10.5194/amt-2020-413
• Barkjohn (Johnson), K, A. Holder, S. Frederick, A. Clements, (in preparation) ‘PurpleAir PM2.5 U.S. Correction
and Performance During Smoke Events’.
Disclaimer: Although this work was reviewed by EPA and approved for publication, it may not necessarily reflect official
25 Agency policy. Mention of trade names or commercial products does not constitute endorsement or recommendation for 25
use.Thank you!
More Information:
Karoline (Johnson) Barkjohn Sim Larkin
johnson.karoline@epa.gov sim_larkin@firenet.gov
26You can also read