THE FUTURE OF RETAIL IN DOWNTOWN EDMONTON - Downtown Business Association
←
→
Page content transcription
If your browser does not render page correctly, please read the page content below
2018

THE FUTURE
OF RETAIL
 IN DOWNTOWN EDMONTON
DOWNTOWN BUSINESS
ASSOCIATION OF EDMONTON
10121 Jasper Ave NW
Edmonton, AB T5J 4X6
www.edmontondowntown.com

To Support, Connect,
and Enrich Edmonton’s
Downtown Community

REPORT RESEARCHED
AND WRITTEN BY:
Mohammed Siddique

                    Photo Credit: Jeff Wallace
C O N T EN T S

   2    Introduction
   3    Methodology

01. BACKGROUND
   4    History of Shopping
   5    Shifts in the Customer Shopping Habits

02. DOWNTOWN PROFILE
   8    Downtown Profile
   11   Retail in Downtown

03. SURVEY & ANALYSIS
   14   Survey & Analysis

04. STRATEGIES FOR RETAIL
   28 Strategies for Retail

   30 Popular Retail Streets in Canada
   32 Key Takeaways

   34 Think Residential

                            D O W N T O W N B U S I N E S S A S S O C I AT I O N
                                                            2 0 18 R E P O R T     1
I N T RO D U C T I O N

                        The Downtown Business Association (DBA) of Edmonton
                        is proud to be providing value to our members and wants
                        to ensure that we continue channelling our efforts to make
                        Downtown more vibrant and inviting. Every year since 2004,
                        the DBA has compiled a report on a topic of relevance to
                        Edmonton’s Downtown business community.

                        In this year’s report, we discuss the changes
                                                                            OBJECTIVE
                        in consumer shopping habits and analyze
                                                                            The Future of Retail and a growing
                        the preferences of consumers for shopping
                                                                            Downtown, the theme outlined here is
                        in Downtown Edmonton. We also discuss the
                                                                            based on an assessment of the current
                        factors that affect consumer shopping and
                                                                            retail landscape in Downtown Edmonton.
                        how we can better prepare for the population
                                                                            The objective of the report is to study the
                        infill that will be happening Downtown over the
                                                                            Downtown neighbourhood, consumer
                        next 5-10 years to increase the quality of living
                                                                            preferences and shopping habits of the
                        in the Downtown neighbourhood.
                                                                            neighbourhood, and its demographics.

                        ABOUT THE DOWNTOWN BUSINESS                         The DBA recently conducted an online survey
                        ASSOCIATION OF EDMONTON                             to learn the preferences and habits of shopping
                        The Downtown Business Association’s                 by Edmontonians in 2018. An analysis of the
                        primary role is “To Support, Connect, and           psychographics, as well as extensive interviews
                        Enrich Edmonton’s Downtown Community.”              with the various stakeholders, were completed.
                        The Downtown Business Association was
                        formed through the establishment of a                    INTERVIEWS WERE CONDUCTED WITH:
                        Business Revitalization Zone for Downtown
                        Edmonton in 1985. This zone includes the              City of Edmonton        Local business owners
                        area from 95 Street to 111 Street and from                                    through in store visits
                        97 Avenue to 105 Avenue.                              Edmonton Tourism
                                                                                                      Real estate professionals
                        More information about the DBA can be                 Representatives from
                                                                              major anchor stores     Retail consultants
                        found at www.edmontondowntown.com

2   D O W N T O W N B U S I N E S S A S S O C I AT I O N
    2 0 18 R E P O R T
I N T RO D U C T I O N

METHODOLOGY

Data was obtained at both the District-           The report is
and City-Wide levels, including information       divided into
from Statistics Canada, and the City of           four key areas:
Edmonton Census. Employment and worker
data was pulled from the City of Edmonton
Census for Ward 6 and the Downtown
neighbourhood.
                                                   01.
                                                   BACKGROUND
Based on the findings from market analysis and
feedback from the stakeholders, a framework
was developed for strategic recommendations.

Mohammed Siddique, an MBA student, was
hired by the Downtown Business Association to
                                                   02.
                                                   DOWNTOWN
work on this year’s project. Siddique presented
                                                   PROFILE
his findings, feedback from the stakeholders
and the survey responses were incorporated

                                                   03.
into the final recommendations and the
industry best practises. In August 2018, the
Consultant presented his findings and report
                                                   SURVEY &
to the members of the DBA, City Officials and
                                                   ANALYSIS
the Edmonton local media.

The DBA ran a survey from June 7th to July
7th, 2018 with the residents of Downtown,
employees working in Downtown and the
                                                   04.
Edmonton residents. For Demographics,              STRATEGIES
the 2016 Municipal Census of Downtown,             FOR RETAIL
Municipal Census of Ward 6, Municipal
Census of Edmonton and Superdemographics
were used.

65% of the respondents were female, 32%
of the respondents were male, 3% chose
‘prefer not to say’. 16% of the respondents
were within the age group of 20-29 years of
age. 25% of the respondents were within the
age group of 30-39 years of age and 21% were
between 40-49 years of age. Together these
age groups represent the majority of the
survey respondents, around 62%.

                                                                    D O W N T O W N B U S I N E S S A S S O C I AT I O N
                                                                                                    2 0 18 R E P O R T     3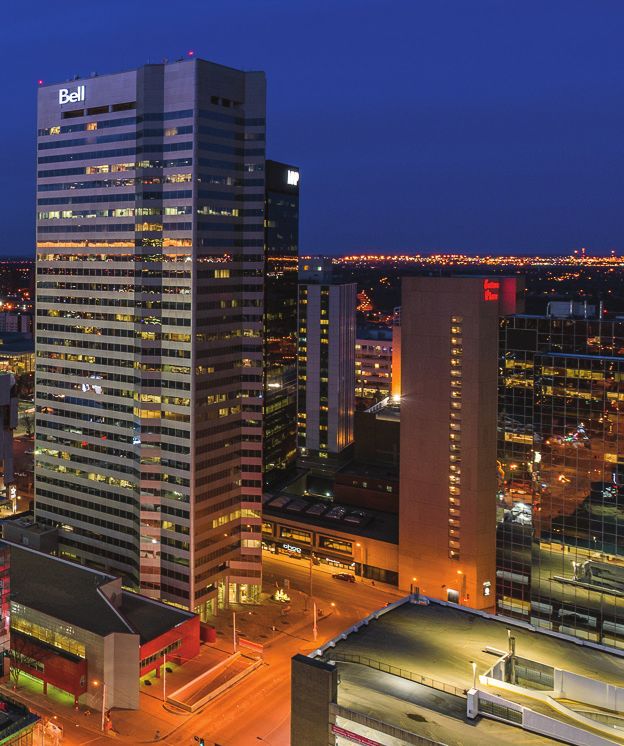
01                                                         HISTORY OF SHOPPING

                                                           Jasper Avenue emerged as Edmonton’s Downtown
                 BACKGROUND

                                                           main street in the early 1900’s. Popular storefronts
                                                           on Jasper Avenue were King’s Confectionary
                                                           at 10455 Jasper Avenue, picture framing shops,
                                                           laundries, a newspaper office, a movie theatre,
                                                           Liquor, Cigar and Wine stores, among others.                                     12

                                                           Fancy groceries, biscuits and confectioneries
                                                           were popular items sold in the Horne and
                                                                                                             Survey Findings
                                                           Pitfield Building. On Rice Howard Way, James
                                                           Ramsey who was given the title Edmonton’s         Average survey
                                                           “Merchant Prince” built Ramsey Department         completion rate                      87%
                                                           Store.3 Gibson Block, constructed in 1913, in
                                                           the characteristic triangular plan shape had      Total responses                      739
                                                           ground floor commercial retail shop fronts that
                                                           were girdled with a continuous wall of glass,     Complete responses                   641
                                                           and the basement had Turkish baths.   4

                                                           Norgate was the first shopping mall in Canada,5
                                                                                                             Downtown residents                   113
                                                           an L-shaped strip mall built in the year 1949
                                                                                                             Central Core*
                                                           in the Saint-Laurent borough of Montreal,
                                                                                                             excluding downtown
                                                                                                                                                  58
                                                           Quebec. Park Royal Shopping Centre, built in
                                                           1950 located in West Vancouver is officially
                                                           Canada’s first covered shopping mall.
                                                                                                             Downtown employees*                  253
                                                           CF Toronto Eaton Centre put Canadian              Edmonton respondents
                                                           mall design on the world map, and it is           excluding the central                470
                                                           North America’s busiest shopping mall     6
                                                                                                             core
                                                           and attracts an average of one million visitors
                                                           every week.7 In the 70s and 80s the enclosed
                                                                                                             *Central Core includes the respondents just
                                                           “mall” had become a centre of social activity,    adjacent to DT includes the neighbourhoods of
                                                                                                             Oliver, Queen Mary Park, Riverdale and Rossdale,
                                                           often containing recreational amenities,
                                                                                                             Boyle Street, Central McDougall, McCauley,
                                                           culminating in the mammoth West                   Cloverdale, Garneau, Strathcona and the
                                                                                                             University of Alberta area.
                                                           Edmonton Mall.8
                                                                                                             **Downtown Employees have an overlap with
                                                           The 90s and early 21st Century saw the            residents of Downtown, central core excluding
                                                                                                             Downtown and Edmonton respondents excluding
                                                           opening of Power centres – open-air planned       central core.
                                                           clusters of big-box retailers. These suburban
                                                           and regional shopping centres have had a

4   D O W N T O W N B U S I N E S S A S S O C I AT I O N
    2 0 18 R E P O R T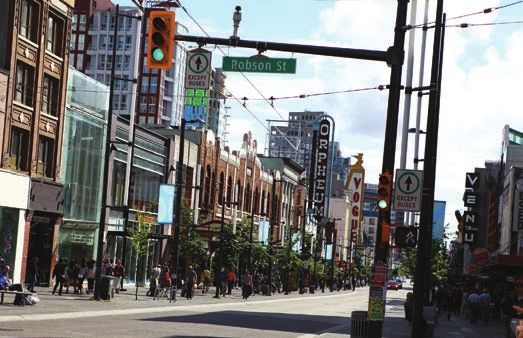
01. B AC KG RO U N D

LEFT: Gibson Block, constructed in 1913, had ground floor commercial retail
shop fronts [Photo Credit: Terry Lawson], MIDDLE: CF Toronto Eaton Centre
put Canadian mall design on the world map [Photo Credit: Alan English
TOP RIGHT: Jasper Avenue, 1925 [Library and Archives Canada], MIDDLE
RIGHT: West Edmonton Mall [Photo Credit: Wikimedia commons] BOTTOM
RIGHT: James Ramsey Store, Spring window display [Photo Credit: Glenbow
Archives]

            detrimental impact on downtown commercial
            areas. The power centres are called Category
            Killers, a category killer is a retail chain store
            that is dominant in its product category.9
                                                                              In the 70s and 80s the enclosed “mall”
                                                                              had become a centre of social activity,
            SHIFTS IN CONSUMER SHOPPING HABITS
                                                                              often containing recreational amenities,
            In the last few years, there have been
                                                                              culminating in the mammoth West
            several changes in customer shopping habits
                                                                              Edmonton Mall.
            including, the growth of Omnichannel Retail,
            a fully-integrated approach to commerce that
            provides shoppers with a unified experience                       people are buying more online. So,

            across online and offline channels, increase                      what are Canadians buying online? The

            in the number of restaurants and food                             sales of electronics [32%], clothing and

            establishments and the growth of experiential                     accessories [42%] account for a large

            retail. Consumers are seeking convenient and                      portion of e commerce sales.

            unique shopping experiences.                                      The rise of the internet is making an impact on
                                                                              retail sales in Canada. According to a survey
            EXPANSION OF E-COMMERCE                                           done by the Canadian Internet Registration
            According to Statistics Canada, retail    10                      Authority (CIRA),11 47% of consumers often
            e-commerce sales totalled $15.7 billion in 2017,                  research and compare the product online
            accounting for 4.26% of the total retail trade.                   before they go to a store to make purchases.
            Year on year retail e-commerce increased 31%.                     This increases to 76% before making a major
            This 31% increase from 2016 indicates that                        purchase. On the other hand, only 34% agreed

                                                                                                              D O W N T O W N B U S I N E S S A S S O C I AT I O N
                                                                                                                                              2 0 18 R E P O R T     5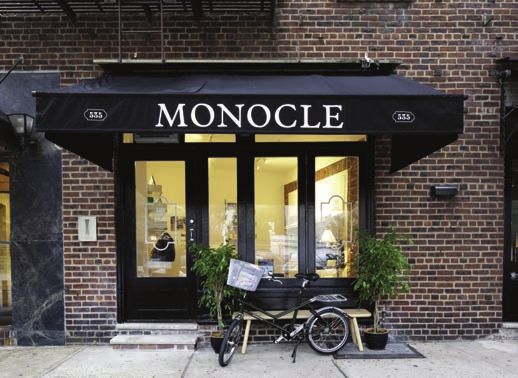
01. B AC KG RO U N D

                                                                                         29% increase

                                                                                                                                                            31% increase
                   47%                                         76%                                                                          2017
             47% of consumers often                         This increases to 76%
                                                                                                                   2016                 $15.7B
                                                                                                                 $12B
              research and compare                         before making a major
                the product online                                purchase
             before they go to a store
                to make purchases

    ONLINE RESEARCH SMALL VS. LARGE PURCHASES                                                                E-COMMERCE SALES IN 2016 VS. 2017

                        that they first visit physical stores but then                                  According to a survey by Capital One Canada
                        purchase online to get the best deal. The                                       and Credit Canada,16 72% of Canadians
                        proliferation of mobile devices is leading                                      overwhelmingly admit that restaurant food
                        consumers to combine online and offline                                         and take out are their most popular indulgence
                        shopping experiences.                                                           and top “Guilty Pleasure”. After restaurants
                                                                                                        and take-out, Canadians treat themselves to
                        In an interview with a major retail store
                                                                                                        daily coffee [50%]. One key reason for this shift
                        Downtown, the general manager revealed
                                                                                                        in consumer habits is because they prefer not
                        that business experienced a spike in visitation
                                                                                                        to cook at home and find it convenient to eat
                        after a new product launch and posting on
                                                                                                        outside of the home.
                        social media. He also indicated that if the size
                        or colour were not available in the store, the                                  In another survey of economic indicators
                        staff would direct them to make the purchase                                    conducted by the City of Edmonton,
                        online. A new trend is that the brick and                                       from September 2016 to September 2017
                        mortar locations serve as showrooms and                                         restaurants had the highest change of use, at
                        engagement with the customer allows them                                        around 25% and the top new use classes in the
                        to try the products or pick-up products.                                        Downtown Business Improvement Area [BIA].17
                                                                                                        Previously, general retail stores represented
                        CHANGES IN CONSUMER DINING HABITS                                               the highest change of use at 34%. This does
                        The restaurant and food service industry                                        not reflect the existing businesses that didn’t
                        growth rate was a healthy 6.2% in 2016 and
                                               12                                                       change their use.
                        4.9% in 2017. In 2018, the food service industry
                        is expected to grow by 4.3%. Food purchased                                     PREFERENCE OF EXPERIENTIAL RETAIL

                        from restaurants – meals outside homes in                   13
                                                                                                        In 2017 and early 2018, two major big-box
                        2015 was $2,222 vs $2,303 in 2016 [+3.63%].                                     stores filed for bankruptcy - Toys ‘R’ Us in the
                                                                                                        US and Sears. One of the main reasons for this
                        In Alberta, spending on meals outside homes
                                                                                                        retail apocalypse is that Canadian retailers
                        is higher than the national average by 20.61%.14
                                                                                                        are not keeping pace with changing consumer
                        15
                             The amount spent on meals was $2,680 in
                                                                                                        shopping habits. Consumers are preferring
                        2016 vs $2,754 in 2015 [-2.7%]. Although Alberta
                                                                                                        curated retail concepts.
                        has this decrease of 2.7%, it is higher than the
                        national average by a solid 20.61%.

6   D O W N T O W N B U S I N E S S A S S O C I AT I O N
    2 0 18 R E P O R T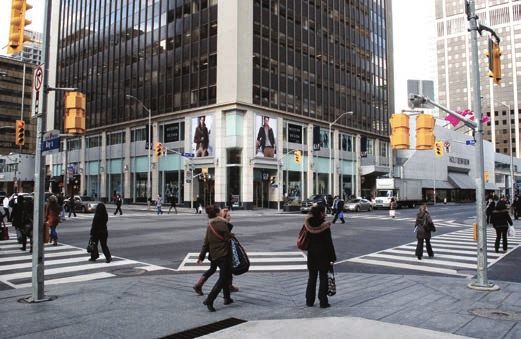
01. B AC KG RO U N D

                                                                                      FAR LEFT: Rise of the internet is
                                                                                      making an impact on retail sales
                                                                                      format in Canada [Photo Credit:
                                                                                      Negative Space], LEFT: Sears filed
                                                                                      for Bankruptcy in 2017 [Photo
                                                                                      Credit: Mike Kalasnik], RIGHT:
                                                                                      Rise of experiential retail- Millennial
                                                                                      consumers want to shop for
                                                                                      experiences as well as products
                                                                                      [Photo Credit: Oxford Properties
                                                                                      Group]

Consumers need to see the value                     that retailers should rethink the physical space
of a physical store                                 as an experiential and entertaining setting.
                                                    Consumers need to see the value of a physical
According to McKinsey,18 Millennial consumers       store and stores, in turn, need to reimagine the
want to shop for experiences as well as             brick and mortar locations and reassess their
products, and there is a rising demand for          e-commerce strategy.
cooking classes, health and wellness sessions,
makeup tutorials – this suggests

Retail Statistics – Where we are Today
Total Retail Sales Growth     Total retail sales in Canada
in 2017 was a 1.67%           in 2017 were at $345                Retail Sales in $ (Billions)
increase from 2016.           Billion, a 1.76% increase           365
Investment in Retail for      YOY. Year over year (YOY)           360
2017 was at $692M, a 10.9     is a method of evaluating           355
% increase from 2016. A       the results at one time
                                                                  350
major contributor to the      period with those of a
                                                                  345
increased demand was the      comparable time period
                                                                  340
stronger than anticipated     on an annualized basis.
                                                                             2016

                                                                                            2017

                                                                                                                   2018

                                                                  335
economic recovery,            The Sears bankruptcy put
                                                                  330
which spurred retail          much vacant space on
                                                                  325
growth. In the Downtown       the Edmonton market.
core, high-profile mixed      As a result, the vacancy            RETAIL SALES TREND
use developments and          rate spiked to 5.5% in the
densification efforts along   second half of 2017 from
corridors such as Jasper      4.9% in the first half. Sears
Avenue, which are likely      added 645K sq. ft. to the
to become very attractive     vacancy marketplace.                       2017                                2018
for retailers.19 However,
investment in the second
                              New grocers such as
                              Freson Bros. and US based                 +1.6%                           +3.9%
half of 2017 decreased, in    Korean themed H Mart
both dollar volume and        are scheduled to enter the
number of sales.              Edmonton market in 2019.
                                                                  RETAIL SALES YEAR OVER YEAR
                                                                  SALES INCREASE

                                                                                        D O W N T O W N B U S I N E S S A S S O C I AT I O N
                                                                                                                        2 0 18 R E P O R T     7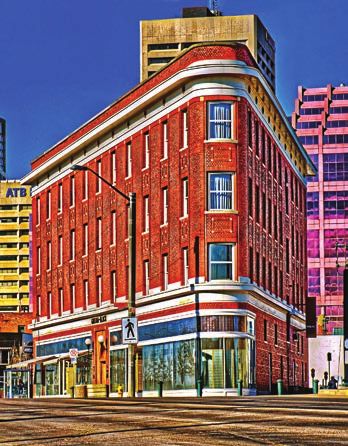
02                                                         DEMOGRAPHICS:

                                                           According to the 2016 Municipal Census, the                                          20
                 DOWNTOWN PROFILE

                                                           largest represented age group is between 20 and
                                                           39, where we have 5,011 residents, they represent
                                                           39.3% of the Downtown population. 25.97% of the
                                                           residents are unmarried and are the maximum
                                                           represented distribution.
                                                           Edmonton’s population between
                                                                                                                POPULATION PROJECTIONS:
                                                           age group [20-39] is 212,420 or
                                                           23.3%.The population in Downtown                     Based on the City of Edmonton
                                                           is younger [16%] compared to entire                  2016 census data, the population
                                                           Edmonton for the age group between                   of Downtown Edmonton has grown
                                                           20 and 39. Millennials make up the                   by 8% between 2012 and 2014, with
                                                           greatest proportion of the residential               a slight 3% decline from 2014 to
                                                           population. The age profile of the                   2016. The overall City of Edmonton
                                                           Downtown neighbourhood has                           population has increased by 2% from
                                                           a high distribution of 20–29 and                     2014 to 2016. Population is projected
                                                           30–39 of 16% respectively. Age                       to grow due to a high density of
                                                           groups between 40–49 and 50–59                       housing. Details on the residential
                                                           are evenly distributed at 6% each.                   developments can be found at the
                                                           Age groups above 60 and less than                    end of the report.
                                                           85 represent 8% of the population.

                                                           LEVEL OF EDUCATION OF RESPONDENTS

                                                                   Registered Apprenticeship certificate
                                                                                         Medical degree
                                                            University certificate below bachelor’s level
                                                                                       Trades Certificate
                                                                                       Earned doctorate
                                                                       No certificate, diploma or degree
                                                   University certificate of diploma above bachelor level
                                                                                         Master’s degree
                                                                           College certificate or diploma
                                                                     High School diploma or equivalent
                                                                                       Bachelor’s degree
                                                                                           No Response
                                                                                                            0

                                                                                                                  500

                                                                                                                         1000

                                                                                                                                1500

                                                                                                                                       2000

                                                                                                                                              2500

                                                                                                                                                     3000

                                                                                                                                                            3500

                                                                                                                        NUMBER OF RESPONDENTS

8   D O W N T O W N B U S I N E S S A S S O C I AT I O N
    2 0 18 R E P O R T
01. B AC KG RO U N D
EMPLOYMENT PROFILE:
Downtown is a major employment centre, and There is a less than average of High School
its working professionals are an important Diploma and equivalent at 14% compared
customer base. The majority of professionals to the City’s 21%. The main employment
are employed at jobs exceeding 30 hours per categories which majority of the residents
week. According to the City’s neighbourhood fall are professional, scientific, technical and
profiles, 21% of the residents hold a bachelor’s management, public administration, finance,
degree above the city average of 18% and this is insurance, real estate and rental and leasing,
the highest bracket. Around 8% hold a master’s educational services and health care.
degree around twice the city average of 4%.
EMPLOYMENT SECTOR
Agriculture, forestry, fishing and hunting
Manufacturing
Administration, waste and remediation
Transportation and warehousing
Utilities
Mining, quarrying, and oil and gas extraction
Information, arts, entertainment and recreation
Wholesale and Retail Trade
Construction
Accommodation and food services
Finance, insurance, real estate and rental and leasing
Educational services
Public administration
Other
Health care and social assistance
No Response
Professional, scientific, technical and management
0
100
200
300
400
500
600
NUMBER OF RESPONDENTS
HOUSEHOLD INCOME OF RESPONDENTS
14
12
10
8
PERCENTAGE
6
4
2
0
$60,000 to $30,000 to Less than $100,000 $125,000 $150,000 $250,000 $200,000
less than less than $30,000 to less than to less than to less than or more to less than
$100,000 $60,000 $125,000 $150,000 $200,000 $250,000
HOUSEHOLD INCOME
D O W N T O W N B U S I N E S S A S S O C I AT I O N
2 0 18 R E P O R T 902. D OW N TOW N PRO F I L E
PSYCHOGRAPHICS:
A psychographic analysis was conducted to divide the market based on a variety of
to identify the different consumer groups personality traits such as hobbies, values,
in Downtown Edmonton to describe the personalities, and lifestyles and finds out
characteristics of the residents. It helps who the buyer is and why they buy.
Household Income $70,000 $100,000 $60,000 $60,000
Ownership Rent Own/Rent Rent Rent
Education and Well-educated, University University University/High
Marital Status Single/married educated educated School – single
and single and single or married
Employment White collar White collar, White collar or Service sector
professionals/ middle income service sector,
service sector jobs entry level jobs
Interests Active lifestyles- Socially very Active lifestyles- Outdoor Sports
jogging, biking, and active, high yoga and
fitness centers disposable backpacking
incomes
Shopping Eat organic Independent Image/ Image/
foods, sustainably boutiques. Shop style-conscious style-conscious
sourced groceries. latest trends
Brand-name
apparel and
latest trends
Social Habits Frequent bars, Frequent bars, Nightclubs, Frequent concerts
nightclubs, art coffee shops, concerts, art and nightclubs
galleries and restaurants galleries and
festivals.
Photo Credit: IQRemix
10 D O W N T O W N B U S I N E S S A S S O C I AT I O N
2 0 18 R E P O R T02. D OW N TOW N PRO F I L E
WALK SCORE
Walk Score Downtown Oliver Westmount Glenora
Walkable 91 1 75 82 7 60 75 20 50 57 89 49
Neighbourhood
Rank
Transit Score Garneau Strathcona Rossdale Queen Mary Park
Walk Score of
75 or less and 89 2 57 83 5 51 87 3 73 75 22 55
Transit Score
of 60 or less Walk Score’s mission is to promote walkable neighborhoods. Walkable neighborhoods are
one of the simplest and best solutions for the environment, our health, and our economy.
Distance
between
Bay/ Central Churchill
Corona 400M 400M 300M
downtown’s Enterprise
LRT stations.
1.1KM
750m is the
shortest
distance that
takes 9 mins to
walk from one
end to the other
end – Hudson’s
Bay to the Aligra
Liquor Store in
West Edmonton
Mall.
RETAIL IN DOWNTOWN:
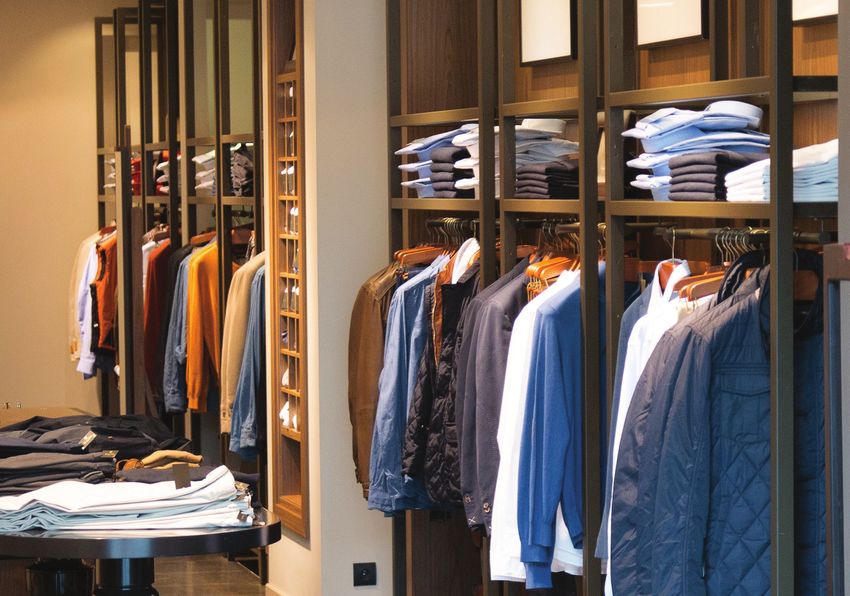
Jasper Avenue is Downtown’s main street. 4th Street Promenade: Here you will find some
Edmonton’s oldest independent bookstore, of Downtown ’s favourite hangouts, restaurants
Audrey’s Books Ltd., is a place for local and and shops that include unique boutiques,
visiting writers to meet readers and book premium men’s wear and many more.
lovers. The Shops at Commerce Place are also
Edmonton City Centre: Downtown’s largest
located along Jasper Avenue. Shopping here
shopping destination. Here you will find over 100
includes retail stores specializing in luxury
shops and services spread out over four floors.
timepieces and jewelry. Shop custom clothing
Major tenants include Hudson’s Bay, SportChek,
or visit the Sunterra market for affordable,
Winners, and Landmark Cinemas. Additionally,
fresh, wholesome food within Commerce
a brand new, modern food court has opened on
Place.
the top floor.
D O W N T O W N B U S I N E S S A S S O C I AT I O N
2 0 18 R E P O R T 1102. D OW N TOW N PRO F I L E
UPCOMING:
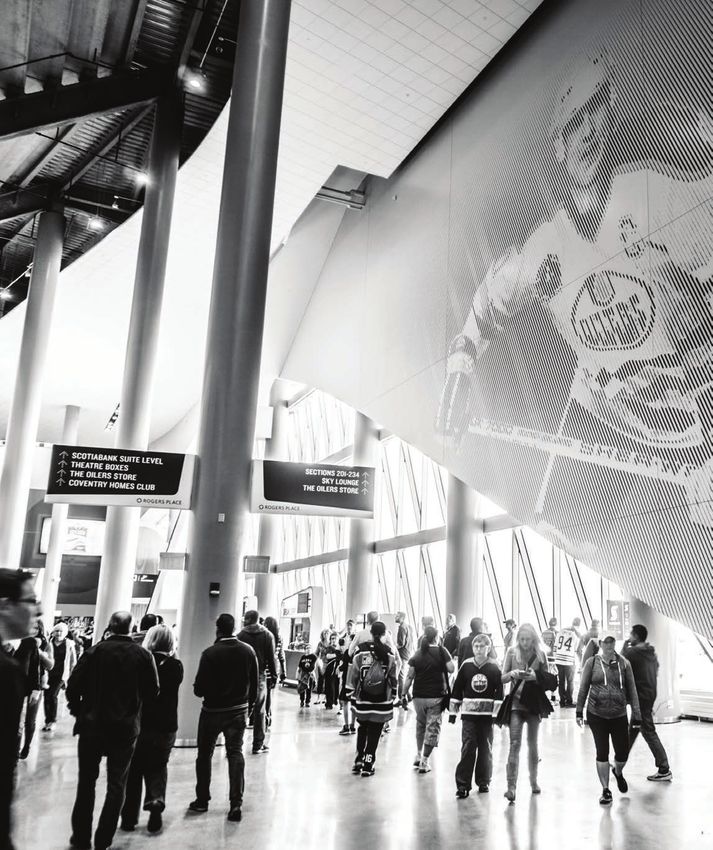
ICE District: The retail in ICE District is located Expansion of the cannabis industry: Aurora
within five minute walk of 8,700 total residents Cannabis recently signed a deal with Liquor
and within ten minute walk of over 13,300 total Stores NA, the deal would provide both companies
residents. It will have a total of 300,000 sq. ft. to establish retail footprint in Edmonton. A number
of premium retail spaces that will make this a of other applicants have shown interest in setting up
retail destination. retail space Downtown on Jasper Avenue and other
Downtown areas. The cannabis industry ramps up
Proposed stores are Rexall Drug Store, a
for the legalization date of October 17, 2018.23
grocery store, a fitness centre and potential
high end movie theatre. It is within 10 minutes
walk from three LRT stations [Corona, Bay/
Enterprise square, Churchill ] and just opposite
the MacEwan station. The retail podium section
of the development is expected to be completed
in 2019/2020.
City Centre Mall–New Development: City
Centre Mall underwent a renovation at a cost
of $41.3M that added a new foodcourt and
new parking. The next proposed plans pending
approvals are to make the exterior of mall more
interactive with the streets, aiming to be a
Figure: Map showing the proposed location of Cannabis retailers
top destination in Downtown.22 in the Downtown Area
12 D O W N T O W N B U S I N E S S A S S O C I AT I O N
2 0 18 R E P O R T02. D OW N TOW N PRO F I L E
POPULAR SHOPPING DISTRICTS IN EDMONTON
1. West Edmonton Mall – The largest shopping
mall in North America, a destination shopping
venue, with over 800 stores, nine attractions,
two hotels and over 100 dining venues.
2. Southgate Centre – Connected by LRT from
Downtown, ranks fifth in the country in sales
per square foot.
3. Kingsway Mall – Connected by LRT from
Downtown, it is the second largest mall in
Edmonton, behind West Edmonton Mall. The
mall contains over 200 stores.
4. South Edmonton Common – Retail power
centre spread over 320 acres and is the largest
open-air retail development in North America.
5. Oliver Square/Village and Brewery District
– located just west of Downtown.
6. 124 Street – Popular shopping district,
has local independent restaurants, coffee
shops, and boutiques.
ICE District will have premium retail spaces and will be a retail
destination. [Photo Credit: Jeff Wallace] 7. Whyte Avenue – Popular shopping district,
has local independent restaurants, coffee
shops, and boutiques.
POPULAR NEARBY SHOPPING DISTRICTS
3
6 5
RETAIL CONSUMPTION
PER HOUSEHOLD
1
7
2
28% Shelter 6% Recreation
12% Transportation 18% Food
4
5% Household Operation 31% Retail
[Source: Environics] Figure: Map showing the popular nearby shopping districts.
D O W N T O W N B U S I N E S S A S S O C I AT I O N
2 0 18 R E P O R T 1303 Last year, Dining, Festivals and Live Performances
were the top three reasons people came Downtown.
SURVEY & ANALYSIS
This year Dining retains the top spot at 70%, a 6%
increase from last year. Shopping was at just 17%
last year; this has increased to 45%, a solid 28%
increase. With a recovery of the economy, the
retail sector is expected to grow.
WHAT IS THE TYPICAL PURPOSE OF YOUR
VISIT TO DOWNTOWN OTHER THAN WORK? RESPONDENTS BY LOCATION:
Answer Choices Responses Area Count Percent
Dining 70.00% Southside 161 25.1%
Festivals 45.63% Northside 101 15.8%
Shopping 44.69% Westside 87 13.6%
Live Performances/ Concerts 38.91% East 29 4.5%
Sporting events 26.09% Greater 92 14.4%
Edmonton
Other (please specify) 21.72%
Central core 58 9.0%
Bars/ Clubs 19.38% excluding
Downtown
Visit a Gallery/ Museum 18.13%
Downtown 113 17.6%
Visit Family/ Friends 15.31%
Total 641 100.0%
Conferences/ Seminars 11.09%
Education 4.38%
Table: Shows all respondents*chart for percentages
14 D O W N T O W N B U S I N E S S A S S O C I AT I O N
2 0 18 R E P O R T0 3. S U RV E Y & A N A LYS I S
EMPLOYEES: Of respondents who work CENTRAL CORE excluding Downtown:
Downtown, 26% said they shop two to three Shopping is even more pronounced for the
times a week, 15% percent said they would residents of the Central Core [Includes the
shop once a week, and around 23% said areas of Oliver, Queen Mary Park, Riverdale
they would shop two to three times a month. and Rossdale, Boyle Street, Central McDougall,
Excluding the males, the results show a McCauley, Cloverdale, Garneau, Strathcona
variation of 1–2%. This shows both genders and the University of Alberta], 67% of the
who work Downtown have similar shopping respondents say that their main purpose of
patterns. visiting Downtown is to shop; 30% of them
shop two to three times per week Downtown.
RESIDENTS: 37% of them shop two to three
Dining is more pronounced for these residents
times a week. Dining is popular with residents
as they are in proximity to Downtown and
at 86% as their main reason to visit Downtown
explore the various Downtown restaurants
apart from work and 64% choose shopping
is at 83%.
[ranks 2nd].
EDMONTON excluding Central Core: 60%
said they shop once a month, 19% said they
would shop two to three times a month, and
around 10% said they would shop once a
week. The ratio of male to female respondent
is 3:7. Females are more than twice the male
respondents.
In all other categories again, the ratio of male
to female respondents is 4:5.
HOW OFTEN DO
YOU SHOP DOWNTOWN?
50.49% Once a month
18.14$% 2 to 3 times a month
15.69% 2 to 3 times a week
11.11% Once a week
4.58% Every day
D O W N T O W N B U S I N E S S A S S O C I AT I O N
2 0 18 R E P O R T 150 3. S U RV E Y & A N A LYS I S
MOTIVATION FOR SHOPPING DOWNTOWN
When asked about the reason that would
motivate the respondents to shop Downtown,
around 56% voted that easier to find parking WHICH OF THE
would be the top motivator. More variety of FOLLOWING
WOULD MOTIVATE
offerings followed by more unique products YOU TO MAKE
and conveniently located stores. These factors MORE OF YOUR
PURCHASES
are important as the respondents want variety,
DOWNTOWN?
products that are unique and conveniently
located. In another survey conducted by the
City of Edmonton, when asked about the
variety of shopping or retailers, 52% agreed.
The respondents suggest that the parking in 56.31% Easier to find parking 21.14% Attractive window
displays/visual merchandising
Downtown needs to be accessible. Metered 47.79% More variety of offerings and look of the business building
Parking is comparable with Downtown Calgary 37.85% Store located 16.72% Better instore experience
and Vancouver, where metered parking is conveniently to your needs
significantly more expensive. 37.38% More unique products
Attractive Window Display: Retail window get your attention. The right window design will
display is one of the most powerful tools in a engage the shoppers, stop them, and compel
retailer’s arsenal of tools to stand out, whether them to walk into the store where employees
a pop up store or an independent retailer. A can complete the sale. The idea is to visually
compelling window display differentiates you talk about your brand and offerings to the
from your competitor and draws in more traffic. shopper, what the store stands for and why
It is one of the main points of contact and will they should walk in.
MOTIVATIONS ACROSS CATEGORIES
Residents % Employees % Central Core % Edmonton %
ex. Downtown excluding
Central core
Top Motivation More variety of 67 More variety of 66 More variety of 62 Easier to find 65
offerings offerings offerings parking
2nd Top Store located 64 Store located 45 More unique 45 More variety of 42
Motivation conveniently to conveniently to products offerings
your needs your needs
3rd top More unique 37 More unique 43 Store located 34 More unique 37
Motivation products products conveniently to products
your needs
16 D O W N T O W N B U S I N E S S A S S O C I AT I O N
2 0 18 R E P O R T0 3. S U RV E Y & A N A LYS I S
Retail window display is one of the most powerful tools in a retailer’s arsenal of tools to
stand out, whether a pop up store or an independent retailer. A compelling window display
differentiates you from your competitor and draws in more traffic.
Parking: Navigation is available through GPS just a few. On street parking is essential for the
or mobile devices. In addition to this, a larger street front retailers. The parking spaces should
wayfinding system that incorporates signage be clean. Dirty and poorly lit parking garages
alerting motorists to the availability of off- with confusing signage give the impression that
street parking. Parking is critical for consumers the nearby services and goods are low-value
and retailers. and poor quality. A staffed station provides an
additional welcoming feeling of safety to the
Parking is arguably the most important
shops.
requirement; the survey respondents chose
easier to find parking as the top motivations -
around 55% - to make more of their purchases
Downtown. Did you know?
• It is difficult to replicate the free parking that On-street parking machines: Parking
is available in suburban shopping centres, is free on Sundays and Statutory
if done would have solved the greatest Holidays and $1/Hr on Saturdays.
dilemmas of urban locations. Parking prices The on-street parking is free from
are set to control the flow of traffic and 6pm to 9am, except event nights.
revenue generation optimally.
On Weekends, in city parkades at
• It is a challenge to squeeze large parking
Canada Place and Library Parkade,
lots right opposite the stores, as we
the parking is only “One Dollar for the
move towards improving the pedestrian
first 3 hours,” and in the City Hall’s
environment.
parkade it is “Fifty Cents per hour.”
• Urban shoppers usually arrive by transit, The parking at the city parkades is
bike or foot as seen through the table for free on all Statutory Holidays.
motivations across categories
Manulife Place charges reduced rates
• The City is moving towards automated for Saturday parking $1 for every 90
parking where there is no need for a mins, and parking is extended for
physical attendant to write tickets. three hours for free, between [6am
There are multiple parking options available in – 5:30pm]. Also, you can purchase
Downtown with daily and monthly options – 24-hour parking at Manulife Place
surface lots and underground parking facilities. for just $6.
Impark lists around 50 parking locations in
City Centre Mall parking, operated
the Downtown area. They also have amenities
by Advanced Parking Systems has
such as Electric chargers, valet parking and
reduced parking rated for evenings
on-site attendants at some locations. They
[until 6am next day] and weekends
also show nearby transit locations if they
at a flat rate of $5, from [6am to 6pm].
would like to park and take public transit. Other
popular parking options are available through Price ranges from $2.50 to $6 per
Parking Panda, Diamond Parking, Advanced hour for the various locations and
Parking, Shaw Conference Centre, EPark reduced rates on weekends.
and the City of Edmonton Parkades, to name
D O W N T O W N B U S I N E S S A S S O C I AT I O N
2 0 18 R E P O R T 170 3. S U RV E Y & A N A LYS I S
WHAT TYPE OF STORES WOULD YOU Ad agency Moosylvania27 analyzed 15,000
LIKE TO SEE IN DOWNTOWN?
responses from millennials and compiled a
Grocery was ranked first, 55% of the list of 100 top brands collected over five years,
respondents say that they would like to see the top brands are Best Buy, Apple, H&M, Gap,
another grocery store Downtown, followed by Michael Kors, Sephora, Coach and Nordstrom.
women’s clothing and pop-up stores.
Other popular brands are MAC, Sephora,
Multiple convenience stores are present in Victoria’s Secret, Gap, Urban Outfitters,
Downtown, such as 7-Eleven and others. Save- J. CREW, Zara, H&M. These brands also
On-Foods on 109 Street, is on the west border offer menswear.
of Downtown. There is a need for another
full-size grocery store. Sobeys Urban Fresh
was a grocery store in Downtown that shut
down in July 2014.24 United Grocers is another
popular grocery store. Shoppers Drug Mart
has three locations Downtown; selling such
basic essentials as milk, eggs, frozen pizza,
herbal teas and specialty bread. WHAT TYPE OF
STORES WOULD
The proximity of Stores: According to a YOU LIKE TO SEE
survey by Neilson,25 in North America, the DOWNTOWN?
primary reason for respondents [55%] to shop
is to stock up on the household essentials and
grocery. Around 34% say that they would buy
a few essential items or buy something they
have run out of and make a quick trip, and to
buy a prepared meal for the day. Without the
54.56% Groceries/Food 22.96% Hardware/Home
presence of another large grocery store, the Improvement/Furniture
44.50% Clothing stores
shoppers and residents will be left with limited for women 17.30% Books
options either to buy at small convenience 37.11% Pop-up stores 12.26% Sporting Goods
stores [7 Eleven or similar] or buy essentials at 35.53% Department Stores 7.39% Home Appliances/
a combined drugstore [Shoppers Drug Mart]. Electronics
24.37% Clothing stores
This revenue will be lost to competitors such for men 6.60% Drugstore items
as Safeway in Oliver Square or grocery stores
in the surrounding areas.
they choose primary producers (those who
Farmers Market: The City Market has fresh
produce the majority of their product directly
and quality products from local farmers and
from the land) and they regulate the vendors
artisans. It is operational year-round every
chosen to create a sustainable Market Mix
Saturday from 9am to 3pm, outdoors in the
(selection of product) to promote diversity
spring and summer and moves indoors during
of vendors and vendors that compliment to
the winter months. The market has been
create a vibrant market.
operating in Edmonton for more than 100
years, since 1903. The vendors stock the best According to Andrew Evans, National
products: available here are products that are Geographic’s digital nomad who spends the
organic, sustainable, and free range. majority of his time travelling the world, in his
list – “Andrew’s List: BEST of 2013” recognised
Key success factors: The Vendor selection
Edmonton’s City Market as the best Farmers’
process for the market is key to its success,
Market in the world.26
18 D O W N T O W N B U S I N E S S A S S O C I AT I O N
2 0 18 R E P O R T0 3. S U RV E Y & A N A LYS I S
From left to right: City Market on 104 Street [Photo Credit: Siddique], Holt Renfrew [Photo Credit: Siddique], The Curated Shop Pop-Up store,
Edmonton City Centre [Photo Credit: Oxford Properties Group
CHOICES ACROSS CATEGORIES
Residents % Employees % Central Core % Edmonton %
ex. DT excluding
Central Core
1st Choice Groceries/Food 86 Groceries/ 70 Groceries/ 62 Groceries/ 47
Food Food Food
2nd Choice Hardware/Home 43 Clothing Stores 42 Clothing 43 Clothing Stores 46
Improvement/ for Women Stores for for Women
Furniture Women
3rd Choice Clothing Stores 39 Pop-up stores 36 Clothing 36 Pop-up stores 41
for Women Stores for Men
Examples of independent stores operating LeChateau, Suzy Shier, Blu’s. Holt Renfrew at
on 104 Street: Manulife Place has premium women’s clothing
featuring brands such as GUCCI, Armani,
Evoolution – specializes in premium olive oil
Chanel and Louis Vuitton. It is a destination
and aged balsamic vinegar.
retail store, and their only store in Edmonton.
Jacek Chocolate Couture – Hand-crafted Winners is a perfect place for the fashion
chocolate made using fine French chocolate. conscious on a budget.
The Helm Clothing – An upscale menswear Ad agency Moosylvania27 analyzed 15,000
boutique, focused on premium made to responses from millennials and compiled a list
measure, bespoke and ready-to-wear tailored of 100 top brands collected over five years,
clothing for men the top brands are Best Buy, Apple, H&M, Gap,
habitat etc – Is a friendly lifestyle store Michael Kors, Sephora, Coach and Nordstrom.
specializing in home goods, accessories, paper Other popular brands are MAC, Sephora,
goods and gifts. They specialize in unique, Victoria’s Secret, Gap, Urban Outfitters,
local, handmade, high quality and artisanal J. CREW, Zara, H&M. These brands also
products. offer menswear.
Clothing: A variety of Women’s clothing options
are available in Downtown. Multiple options
are available for women’s clothing at Hudson’s
Bay and stores such as Ardene, Cleo, Talbots,
D O W N T O W N B U S I N E S S A S S O C I AT I O N
2 0 18 R E P O R T 190 3. S U RV E Y & A N A LYS I S
POPULAR BRANDS AND THEIR LOCATIONS IN EDMONTON
Brands Kingsway Southgate Whyte Oliver West South
Avenue Square/ Edmonton Common
Village & Mall
Brewery
District
According to a study done by
Ready Cloud, 88% of shoppers are
“webrooming” regularly browsing
online before purchasing in a store.
20 D O W N T O W N B U S I N E S S A S S O C I AT I O N
2 0 18 R E P O R T0 3. S U RV E Y & A N A LYS I S
One of the metrics used to access the health 39% of the shoppers patronize pop-ups
of a retail store is to examine its sales per as their products are new and unique
square foot to determine the viability of the and 61% said they prefer pop-ups as
business. Usually, the stores operating in malls they offer seasonal products.
share their sales data with the developers.
This metric is also available through market
has units that they are willing to lease to new
research companies. The expenses of the
upcoming brands by setting up their pop--up
company are dependent on many internal
stores and have put up an advertisement.
factors and can be used to refine the selection
further. CSCA, The Centre for the Study of Tie up spaces with pop-up stores during the
Commercial Activity, at Ryerson University Holiday season, or a store sale. According
compiles Retail 10028, a list of the top 100 retail to a survey by PopUp Republic,30 39% of the
conglomerates operating in Canada as ranked shoppers patronize pop-ups as their products
by total estimated retail sales on a yearly basis. are new and unique and 61% said they prefer
pop-ups as they offer seasonal products. Not
Based on the shopping habits of the
just upcoming store owners, but seasoned
represented demographics and reviewing their
retailers can use a pop-up to test an emerging
habits through psychographic analysis, the
market, to reduce surplus inventory and
following brands are suggested as an option,
increase branding opportunities.
and their locations in neighbourhood shopping
locations is listed, as many respondents Low commitment – By selecting the
suggest the rents in Downtown are high, along demographics that match with your product,
with sales per square foot, Sales per stores and you can start in a vacant storefront, as
metric are included. Apple and Lululemon both landlords are willing to let the pop-up store
have high sales per square foot, in fact, both concept fill the gaps until they find a suitable
are in the top 10 and have very high sales per long-term tenant. Popular brands such as
store. Indochino, which offers bespoke men’s wear,
started testing their product with the pop-up
Lululemon is a cult favourite active brand wear
concept.
and a favourite among yoga lovers. Whether
is the morning jog or the brunch, thanks to its According to a study done by Ready Cloud,31
fashionable styles. 88% of shoppers are “webrooming” regularly
browsing online before purchasing in a store.
H&M and Zara are some of the popular fast
This creates a sense of scarcity, because
fashion stores, breaking ground in bringing new
people need to take action, i.e. buy, during the
fashion, new design, and new ideas quickly to
time the pop-up is present. Because a pop-up
its stores.29
store is temporary by nature, shoppers are
Where do women on the hunt for a good dress less likely to delay purchases. This works even
or some office attire go? better when the product in the pop-up is unique
Pop-Up Stores: Manulife Place is giving out Customer Insights – One other benefit of pop-
two units in their retail space. The winners of up stores is that they get valuable customer
the Pop-Up contest can set up their stores and feedback. As the store is usually small, it gives
no rent charged for three months. At the end a chance to ask the customer feedback about
of three months, the stores can extend their the offering. This principle becomes even more
lease or decide to vacate. Previous pop-up important if the product is a new offering.
stores at Manulife Place were Poppy Barley and Testing whether the product will get consumer
So Pretty Cara Cotter. City Centre Mall also acceptance and ways to improve it.
D O W N T O W N B U S I N E S S A S S O C I AT I O N
2 0 18 R E P O R T 210 3. S U RV E Y & A N A LYS I S
Street appeal is key to developing a successful storefront. In another survey by Morpace
Omnibus, consumers said they decide whether or not they will shop at your store based
on its presentation from the street.
AGREEMENT WITH STATEMENTS THAT
WOULD ENCOURAGE SHOPPING DOWNTOWN
Respondents were offered a list of statements
and requested the level of agreement that would
encourage them to shop Downtown.
Storefronts on the main street need
to be clean and presentable.
93.42% agreed, and 3.13% disagreed
According to a study by Harris Interactive, 86%
of consumers said that dirty floors negatively
impact the perception of a retail store. By pressure
washing the exterior of your building, you can
create a storefront that invites your customers.
Lure the consumers from Pathway to Doorway.
Street appeal is key to developing a successful
storefront. Keep your windows, doors, and
pathways clean.33 In another survey by Morpace
Omnibus, consumers said they decide whether
or not they will shop at your store based on its
presentation from the street.34
More Information is needed about
the Pedway routes.
77.08% agreed, and 13.66% disagreed
Signage/wayfinding helps navigate
stores in Downtown
83.07% agreed, and 10.66% disagreed
The city is working towards updating the signage/
wayfinding at multiple locations Downtown. A GIS
map that has multiple layers that can be toggled
on and off to view the desired information would
be a helpful tool. The pedway is useful especially
during winter when the temperatures are very
cold. The city allows pedways to be constructed
between private properties. The private property
TOP: Clean Streets, entrances utilizing natural light, clear signage and owners decide the hours the pedway remains
a clean/crisp overall design are key to lure customer from Pathway to open. A video would be helpful showing some of
Doorway [Photo Credit: Monocle], MIDDLE: Bright colors and a large
storefront window, maximize the visibility of the store [Photo Credit: CC0 the popular routes and other less known routes.
no attribution] BOTTOM: Figure: Interactive dynamic map of Downtown This is also beneficial when customers decide to
Cleveland, Ohio that shows the attractions, hotels and restaurants, each
as a separate layer. The layers can be toggled on and off.[Photo Credit: park at a location that has lower parking rates and
Destination Cleveland]
walk to shops.
22 D O W N T O W N B U S I N E S S A S S O C I AT I O N
2 0 18 R E P O R T0 3. S U RV E Y & A N A LYS I S
Employees need to have specialized
knowledge of the products in the Case Study: DAVIDsTEA
store.
DAVIDsTEA offers
77% agreed, and 9% disagreed free samples of
Showrooming is a practice of examining a feature teas,
merchandise or products in a store and without pushing
then buying it online for a lower price.35
to purchase it.
Whether it’s
Employee Knowledge: Apart from price
the in-store
comparison, one of the main reasons the
employees or
customer is using the phone is to find more
social media, the
information about the product. For example,
staff is trained
let’s say the customer is deciding between
to answer all the
two products and the employee can clearly
questions and the
explain the pros and cons and the difference
150 varieties of stocked teas. The staff attend
between the products, they are in a better
a nine-hour tea training session and receive
position to persuade the customer to
on-the-job apprenticeship-style learning to
purchase at the store. Through specialized
enhance their knowledge of tea further.37
product knowledge employees can convince
a customer who appreciates great customer According to an article by the B2B news,
service and personal touch, to purchase at DAVIDsTEA responds to almost every criticism
the store. or question via its Twitter account, answering
queries within 20 minutes at times. This kind
If the employee is not able to explain all the
of customer service gets noticed.38
above details, then the customer will search
for the information online and may buy it Price matching: In another strategy that can
online at a lower price. tackle showrooming. Best Buy matches the
price if you find an identical product available
If the product is available elsewhere, then
at a local retail competitor store, even Amazon.
showrooming is a challenge for retailers.
According to a study by JiWire, 61.5% of
the shoppers use the in-store wi-fi for price
comparison.36 The same study also found Through specialized product knowledge
that 44% say that the availability of in-store employees can convince a customer who
wi-fi influences where they shop. appreciates great customer service and
Stores should combine personal touch, to purchase at the store.
complimentary workshops/
classes in store for customers.
47% agreed, and 22% disagreed
D O W N T O W N B U S I N E S S A S S O C I AT I O N
2 0 18 R E P O R T 230 3. S U RV E Y & A N A LYS I S
Case Study: Apple
Apple offers programs every day in-store.
Some of the program categories that Apple
has are business, music and photography.
These are hands-on sessions called “Today
at Apple”. Lessons range from how-to
guides to professional level programs. The
retailer is trying to create an environment
where people can test, talk and learn all
things Apple. Apple’s goal is to increase
sales, as sales for the past quarters have
dipped and they want to strengthen the
bottom line.39
Case Study: Home Depot
Home Depot also has DIY classes for
females called Do-It-Herself and Kids
Workshops; examples include teaching
kids how to build their own bookends. At
Home Depot, do-it-yourselfers made up
more than 60% of the building supply
industry’s sales volume,40 but the majority
of the buyers didn’t have the knowledge or
TOP: Jessica Hische shares her perspective and techniques
during a Live Art session, part of “Today at Apple”. [Photo
expertise to accomplish their home repair/
Credit: Apple Newsroom] BOTTOM: Enhance Your Backyard improvement projects.
Living Space, Do It Yourself free workshops by Home Depot.
[Photo Credit: Home Depot] The workshops increased customer
knowledge and they returned to buy
additional products for complex projects.
Keeping a customer is very important; From a sales perspective, products with
they are more knowledgeable than ever, better reviews have increased sales. Home
more likely to switch for a better deal, Depot has a dedicated YouTube channel
more personalized service, or superior that has had over 81M views, a channel that
products. acts as a destination for home improvement
products and DIY project how-to videos.
24 D O W N T O W N B U S I N E S S A S S O C I AT I O N
2 0 18 R E P O R T0 3. S U RV E Y & A N A LYS I S
Stores need to offer tailored offerings
to the customer. GOOD
Buys
GREAT
Keeps Encourages
from coming others to shop
customer customer
65% agreed 16% disagreed you back at your store
Big Data analytics is now being applied at every
stage of the retail process – predicting popular
products analyzing trends, forecasting product
demand, optimizing pricing for a competitive I feel safe in Downtown in the day.
edge, identifying the customer’s segments and 82% agreed with the statement that
working out the best way to approach them, it would encourage them to shop in
and lastly finding out what is the next thing Downtown
they will need. I feel safe in Downtown in the evening.
Keeping a customer is very important; they 53% agreed that the statement would
are more knowledgeable than ever, more likely encourage them to shop Downtown,
to switch for a better deal, more personalized as the respondents perceive that
Downtown is not as safe as it could be.
service, or superior products.41
Downtown has pedestrian-friendly
Turn data into insights traffic signal timing.
that generate revenue
68% agreed that the statement would
encourage them to shop Downtown.
Some of the respondents suggested that the
pedestrian crossing wait times are long. At
some locations Downtown, the button needs
to be pressed to cross and if the pedestrians
miss pressing the button the signal is not
activated. This is one of the reasons for long
wait times for pedestrians. The signals are
timed to optimally control traffic flow at peak
and off-peak times.
There is effective communication
of what’s happening in Downtown.
72% agreed vs 31% in 2017, an increase
over 2X 25% disagreed, a drop from 45%
in 2017.
Photo Credit: Cognizant
D O W N T O W N B U S I N E S S A S S O C I AT I O N
2 0 18 R E P O R T 250 3. S U RV E Y & A N A LYS I S
Regarding perceived safety in Downtown, is there any issue you would
like to highlight?
Homelessness DOWNTOWN RESIDENTS CENTRAL CORE EX DT ALL RESPONDENTS
in Edmonton:
Panhandling 57% Panhandling 47% Panhandling 54%
There has been
Homelessness 51% Homelessness 40% Homelessness 51%
a 43% decrease
in the number of Drug usage 40% Drug usage 20% Drug usage 34%
people identified Visibility of EPS 28%
as experiencing EMPLOYEES EDMONTON EX
CENTRAL CORE Harassment 19%
homelessness
Panhandling 57%
from 2008 to Panhandling 53% Vandalism 15%
2016.42 Homelessness 51%
Homelessness 53%
Drug usage 35%
Drug usage 32%
INITIATIVES TO END HOMELESSNESS: Reaching Home: Canada’s redesigned
Homeward Trust: Homeward Trust has been Homelessness Strategy, has the Government
instrumental in providing leadership in how we of Canada committing increased resources
address homelessness in our city. Since 2009, toward the goal of ending homelessness and
around 7,937 housings 43
have been provided supporting the National Housing Strategy. A
through the Housing First program. 10-year, $40-billion plan to lift hundreds and
thousands of Canadians out of housing need,
The Capital Region Interfaith Housing
resulting in up to 100,000 new housing units
Initiative (CRIHI): Started in 2011 with a
and 300,000 repaired or renewed housing
commitment from 24 religious and spiritual
units.45
community leaders44 to end homelessness.
When asked about perceived safety in the
Bissell Centre: offers several housing services
Downtown, panhandling was the highest at
including Homeless to Homes, Community
54% followed by homelessness at 51%. Drug
Bridge and Outreach Housing Team. Through
usage was at 34%. Visibility of Edmonton
the Homeless to Homes program, they provide
Police Service was at 28%.
Intensive Case Management services to
170 adults and children and 80 people in the EPS has many programs for Downtown such
Housing First program. as the Downtown Beat Police that regularly
patrol on foot and bikes.
“$230 million over six years is needed to house 4,000 homeless people”
- Homeward Trust
26 D O W N T O W N B U S I N E S S A S S O C I AT I O N
2 0 18 R E P O R T0 3. S U RV E Y & A N A LYS I S
How do you normally commute to 26% of Central Core residents excluding
Downtown? Downtown choose to walk. Bike ridership is high
Walking is the first choice for Downtown among Employees and Downtown residents
residents, at 60%. and the central core. 70% of the employees use
their vehicle and 42% use LRT to commute to
Downtown.
Residents % Employees % Central Core % Edmonton %
ex. Downtown excluding
Central core
1st Choice Walk 60 Personal 70 Personal 34 Personal 57
Vehicle Vehicle Vehicle
2st Choice Personal 26 LRT 42 Walk 26 LRT 17
Vehicle
3st Choice Bus 5 Bus 36 Bus 24 Bus 14
Bike 5 6 9 3
Car Pool 1 4 3 3
When asked do you think the City Development Incentive Program [DIP]: It has
should offer incentives to attract new three programs – New Commercial Business
businesses/retailers to the Downtown Interior Improvement Grants, Commercial
area?
Development and Multi-unit Residential
69% of the respondents said yes. 15% Development Reinvestment Program Grants.
of the respondents said no. 18 % had It encourages property owners in Business
no opinion
Improvement Areas to invest in higher density
Façade Improvement Program: The program residential and/or commercial development.
encourages commercial building owners to The programs provide grants to cover a
invest in façade renovations and storefront portion of building or renovation costs. Grants
improvements. It matches grants to cover a may be provided to property owners who invest
portion of renovation costs. Grants cover up in new development, redevelopment, and/or
to 50% of renovation costs, to a maximum of conversion of their properties for mixed-use,
$30,000 per building façade. Corner buildings multi-unit residential, and/or eligible storefront
may be eligible for up to $60,000.46 retail and commercial uses.47
Benefits of the program include increased Benefits include revitalization of main street
business exposure, more attractive streets, areas with more places to live and shop, and
more inviting places to walk and shop, better enhanced property values.
first impressions for businesses, enhanced
property values, and improved marketability
of the local business area.
D O W N T O W N B U S I N E S S A S S O C I AT I O N
2 0 18 R E P O R T 2704 GET ONLINE
In a study, GoDaddy and Redshift surveyed 4,009
FOR RETAIL
STRATEGIES
small businesses; 59% of Canadian respondents
reported that they don’t have a website, and only a
third of those plan on building one. Purely offline 48
is a risky strategy as customers are spending more
of their time online.
Purely offline is a risky strategy as OMNICHANNEL
customers are spending more of their
retailing is a fully-integrated approach
time online. The web can play a huge part
to commerce that provides shoppers
in measuring success by building offline
a unified experience across online and
relationships. In a recent study by CIRA,
offline channels (e.g., touchpoints). True
63% of consumers believe that having
omni-channel shopping extends from
a website makes a business look more
brick-and-mortar locations to mobile-
credible, and 26% don’t trust businesses
browsing, e-commerce marketplaces,
without a website.49
onsite storefronts, social media,
Website builders are a perfect solution for retargeting, and everything in between.52
individuals and small businesses to start
A study by the Harvard Business Review53
a website without the expense of hiring a
of 46,000 shoppers reveals Omnichannel
developer. A good custom website could
retailing increases revenue.
easily cost $2,000.50 Website building
packages start from $10/month and An instore catalogue, a price checker,
changes can be easily made by uploading a tablet each count as a separate point.
images or adding new pages. Wix, Weebly, The omnichannel experience propels
Squarespace and WordPress are few of engagement with the retail brand and
the popular website builders. drives consumers to the store.
E-commerce platforms have higher prices
SOCIAL MEDIA UPDATES
than website builders, because they
It is important for the new customer to get
have added security and application
the brand’s attention. Through Instagram,
add-ons such as inventory management
the business can provide updates when
for helping businesses build an online
a new item comes in, or a popular item
store. Shopify is a Canadian based
is back in stock. Businesses don’t need
e-commerce platform. For $9 a month, the
to spend hundreds of dollars on social
businesses can integrate Shopify directly
media marketing on Facebook. A study
with your Facebook account and make
done by Scott Ayres, where $20 spent on
it an e-commerce store.51 Bigcommerce,
a boosted post in Facebook, generated
Volusion and Magento are other popular
$2,400 in sales.54
e-commerce platforms.
28 D O W N T O W N B U S I N E S S A S S O C I AT I O N
2 0 18 R E P O R T0 4. S T R AT EG I E S F O R R E TA I L
OMNICHANNEL Case Study: Starbucks
The loyalty program engages
Parameter Result
with the customer and changes
Spending Spent 4% more in store to the card can be viewed in
real time across all channels –
Spending after 13% more in store
research online phone, website, store and the
app.56 Each time the customer
Spending Spent 10% more online after visiting
checks the app they are greeted
the store
with a limited bonus offer to offer loyal customers
Increased Loyalty Logged in 23% repeat shopping with even more rewards. This keeps the customer
trips.
engaged. The program makes up around 22% of
Likeliness to Greater than compared to a single the US franchise sales. The gold card program57
recommend channel
makes the customer feel exclusive and important.
The gold card gives the customer the physical
representation of special status that acts as a
CARE FOR YOUR LOYAL CUSTOMERS strong motivator.
One way of rewarding customers is by
hosting giveaways and offers through Case Study: Sephora
your social media pages. For example with
Facebook comments or through share and
Twitter retweets. If a customer makes a
purchase and posts a picture with the item
on social media and tags your business,
offer them a discount on the next purchase. Sephora’s strategy is to put the video where
Loyalty programs can generate as much shoppers need it most, whether the customer
as 20% of a company’s profits.55 is looking for inspiration or looking to buy – on
YouTube, Sephora.
PROMOTIONS WITH EXTENDED
websites, in stores or on mobile.58 Currently,
STORE HOURS AND BUNDLING
Sephora has more than one million subscribers
Several respondents
on YouTube. In the store, Sephora has the Color
have mentioned the hours of shopping
IQ59 60 program that uses digital devices to
need to be extended. Promotions intended
scan someone’s skin to find the right shade for
to encourage more evening shopping by
foundation, concealer, lip and powder product
respondents and combine several evening
recommendations. For the app, Sephora has
downtown activities. This can be done
Virtual ARTIST61 where a customer can take a
by combining activities, such as dinner
picture and try the eye, lip and cheek makeup.
discount with proof of downtown shopping
If the customer is bored and needs inspiration,
or a shopping discount combined with a
the app has created looks for daytime,
meal at a Downtown restaurant.
nighttime, popular trends and events. The app
To effectively build these promotions they shows which products are required to get the
need to be tested, ideally launched in desired look. To top it up they have exclusive
summer and extended into the fall. Stores, app offers. A study was done to measure the
restaurants and theatres can distribute offline impact of Sephora’s online strategy62 -
flyers and the discount vouchers to 3X increase in conversion rates and 13%
generate awareness for the promotion. uplift on average in-store order value.
D O W N T O W N B U S I N E S S A S S O C I AT I O N
2 0 18 R E P O R T 29You can also read