The geographical co-distribution and socio-ecological drivers of childhood pneumonia and diarrhoea in Queensland, Australia
←
→
Page content transcription
If your browser does not render page correctly, please read the page content below
Epidemiol. Infect. (2015), 143, 1096–1104. © Cambridge University Press 2014
                   doi:10.1017/S095026881400171X

                   The geographical co-distribution and socio-ecological drivers of
                   childhood pneumonia and diarrhoea in Queensland, Australia

                   Z. XU, W. HU              AND    S. TONG*
                   School of Public Health and Social Work & Institute of Health and Biomedical Innovation, Queensland University
                   of Technology, Brisbane, Australia

                   Received 3 December 2013; Final revision 19 May 2014; Accepted 18 June 2014;
                   first published online 14 July 2014

                   SUMMARY
                   This study aimed to explore the spatio-temporal patterns, geographical co-distribution, and socio-
                   ecological drivers of childhood pneumonia and diarrhoea in Queensland. A Bayesian conditional
                   autoregressive model was used to quantify the impacts of socio-ecological factors on both
                   childhood pneumonia and diarrhoea at a postal area level. A distinct seasonality of childhood
                   pneumonia and diarrhoea was found. Childhood pneumonia and diarrhoea were mainly
                   distributed in the northwest of Queensland. Mount Isa city was the high-risk cluster where
                   childhood pneumonia and diarrhoea co-distributed. Emergency department visits (EDVs) for
                   pneumonia increased by 3% per 10-mm increase in monthly average rainfall in wet seasons.
                   By comparison, a 10-mm increase in monthly average rainfall may cause an increase of 4% in
                   EDVs for diarrhoea. Monthly average temperature was negatively associated with EDVs for
                   childhood diarrhoea in wet seasons. Low socioeconomic index for areas (SEIFA) was associated
                   with high EDVs for childhood pneumonia. Future pneumonia and diarrhoea prevention and
                   control measures in Queensland should focus more on Mount Isa.

                   Key words: Climate change, pneumonia, diarrhoea, geographical co-distribution.

                   I N T RO D U C T I O N                                                              episodes of pneumonia and diarrhoea in children
                   Pneumonia and diarrhoea are the leading causes of                                   aged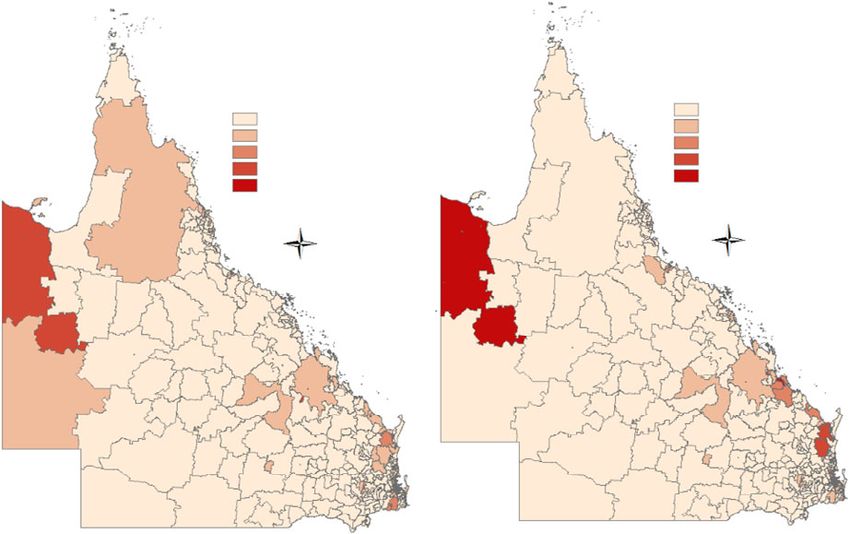
Childhood pneumonia and diarrhoea in Queensland                                   1097

          pneumonia and diarrhoea, highlighting that high                                     area during the study period were extracted using
          temperature [6, 7] and rainfall [8, 9] may trigger                                  the ArcMap software package (ESRI Inc., USA).
          pneumonia and diarrhoea. As projected by an Inter-                                  Data for the same period for each postcode on the
          governmental Panel on Climate Change, the Earth’s                                   socioeconomic index for areas (SEIFA) and popu-
          surface average temperature will increase, and there                                lation size, were obtained from the Australian
          will be more intense rainy seasons in Asia, Africa,                                 Bureau of Statistics [13]. SEIFA is a product devel-
          and the Pacific [10]. As climate change continues,                                   oped by the Australian Bureau of Statistics that
          the burden of pneumonia and diarrhoea in these                                      ranks areas in Australia according to relative socio-
          regions may increase, although there are still regional                             economic advantage and disadvantage. Lower SEIFA
          differences and contrasting effects of climate on pneu-                             values indicate lower socioeconomic status.
          monia and diarrhoea due to different aetiological
          agents.
             Australia shoulders a considerable burden of child-                              Statistical analysis
          hood pneumonia and diarrhoea [11, 12]. It is urgently                               We plotted the decomposed daily distributions of
          required that the spatio-temporal patterns of child-                                EDVs for childhood pneumonia and diarrhoea using
          hood pneumonia and diarrhoea in Australia are                                       a time-series approach. The change in EDVs for
          revealed. This study explored the spatio-temporal                                   childhood pneumonia and diarrhoea from 2008–
          patterns, geographical co-distribution and socio-                                   2009 to 2010–2011 was calculated using the following
          ecological determinants of childhood pneumonia and                                  equation:
          diarrhoea in Queensland, Australia.
                                                                                              Mc = (EDVi2010−2011 − EDVi2008−2009 )/populationi ,
                                                                                              where Mc represents the morbidity change,
          M AT E R I A L S A N D M E T H O D S                                                EDVi2010–2011 represents the EDVs for childhood
                                                                                              pneumonia (diarrhoea) for postal area i during
          Data collection                                                                     2010–2011, EDVi2008–2009 represents the EDVs for
          Queensland is located in the northeast of Australia.                                childhood pneumonia (diarrhoea) for postal area i
          Its mean summer temperature is 25 °C and mean                                       during 2008–2009, and populationi refers to the popu-
          winter temperature is 15 °C. There is significant vari-                              lation for postal area i.
          ation in mean annual rainfall across Queensland,                                       A Bayesian conditional autoregressive (CAR)
          varying from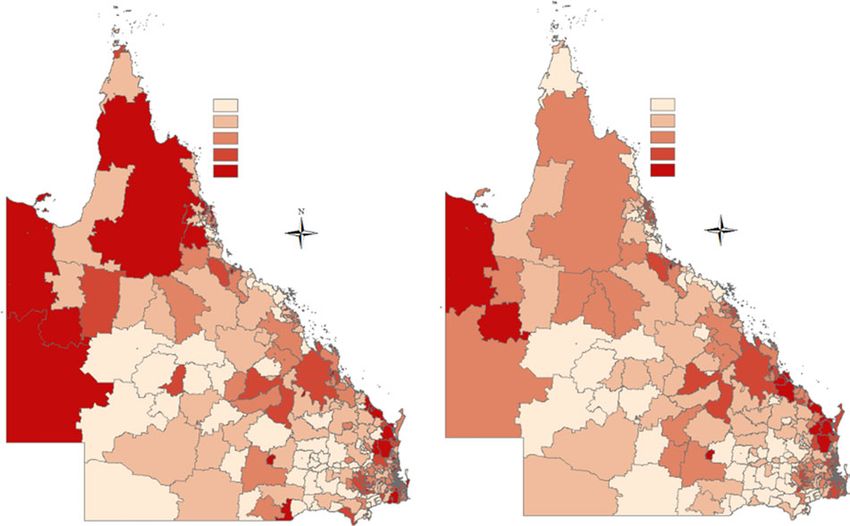
1098 Z. Xu and others
Table 1. Summary statistics for emergency department EDVs for childhood pneumonia and diarrhoea from
visits for childhood pneumonia and diarrhoea, monthly years 2008–2009 to 2010–2011, indicating that EDVs
mean temperature and rainfall, and SEIFA by postcode for pneumonia and diarrhoea changed from the north-
in Queensland, Australia, during 2007–2011 west or southeast of Queensland during the past few
years.
Variables Mean (S.D.) Min. Max.
Pneumonia (cases) 43·7 (79·5) 0 739
Diarrhoea (cases) 135·8 (247·7) 0 1750 Temporal pattern
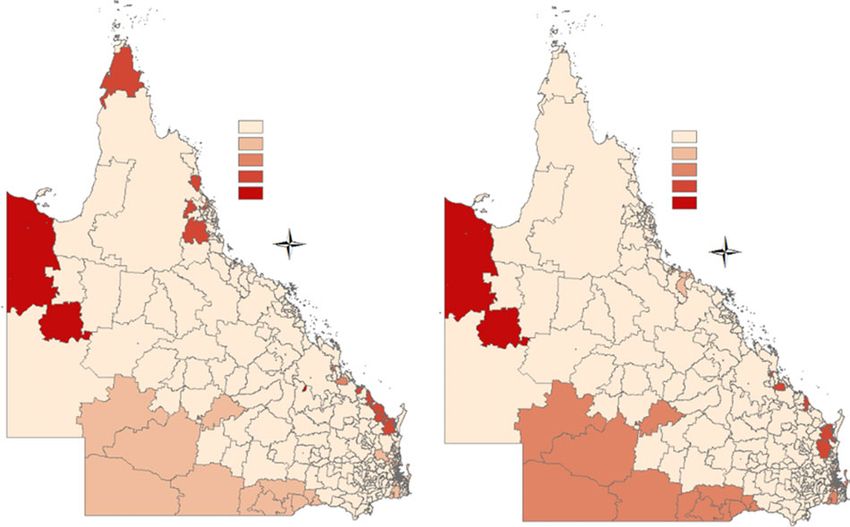
Mean temperature (°C) 20·1 (2·1) 13·9 26·8 Figure 3 shows the decomposed daily distributions
Rainfall (mm) 95·7 (42·0) 19·7 318·0
of EDVs for childhood pneumonia and diarrhoea,
SEIFA 976·6 (74·3) 589·0 1147·0
showing a distinct seasonal trend for the two diseases,
SEIFA, Socioeconomic index for areas. especially for pneumonia. This figure indicates that
EDVs for childhood pneumonia in Queensland were
more likely to occur in the cold season. The particu-
10 000 iterations for the model. We conducted a sub- larly great number of EDVs for childhood pneumonia
sequent set of 200 000 iterations for the accuracy. in 2009 is because of the 2009 pandemic H1N1
Model selection was conducted by comparing the influenza.
deviance information criterion (DIC) of different
models. In this study, we defined May–October as Geographical co-distribution
the dry season, and January, February, March,
April, November and December as the wet season. The cluster results in Figure 4 reveal that EDVs for
Time-series analysis was conducted using the R childhood pneumonia and diarrhoea in Queensland
statistical environment, version 2.15.3 (R Foundation, were co-distributed in Mount Isa.
Austria). Visual maps were created using ArcGIS ver-
sion 9.3 (ESRI Inc.). Spatial cluster analysis was con- Socio-ecological drivers
ducted using SatScan v. 9.1 (http://satscan.software.
informer.com/9.1/), and the Bayesian CAR model The effect of socio-ecological factors on EDVs for
was conducted using WinBugs software, version childhood pneumonia and diarrhoea in the dry and
1.4.3 (MRC Biostatistics Unit, 2008). wet seasons is reflected in Table 2. SEIFA played an
important role in driving the distribution of pneu-
monia, highlighting that more EDVs for pneumonia
R E S ULTS occurred in regions with low socioeconomic status.
The relationship between rainfall and EDVs for
Summary statistics
pneumonia was significant in wet seasons, with a 3%
Table 1 presents the summary statistics of EDVs for [95% confidence interval (CI) 1–5] increase in EDVs
childhood pneumonia and diarrhoea, mean tempera- for pneumonia for each 10-mm increase in monthly
ture, rainfall and SEIFA by postcode in Queensland. average rainfall. Rainfall was also significantly asso-
The average counts of childhood pneumonia and diar- ciated with EDVs for diarrhoea in both dry and wet
rhoea were 43·7 and 138·5, respectively, and the mean seasons, with a 4% (95% CI 2–7) increase in EDVs
values of mean temperature, rainfall and SEIFA were for diarrhoea for each 10-mm increase in monthly
20·1 °C, 95·7 mm, and 976·6. average rainfall. Mean temperature was negatively
associated with EDVs for diarrhoea in wet seasons,
but not in dry seasons.
Spatial pattern
Posterior estimated relative risks of childhood
Figure 1 shows the spatial distribution of rates of pneumonia and diarrhoea reveal that high-risk areas
EDVs for childhood pneumonia and diarrhoea, illus- of childhood pneumonia were located in the north-
trating that EDVs for pneumonia were the highest west of Queensland, and high-risk areas of childhood
in the central west, northwest and far north of diarrhoea were located in central west Queensland
Queensland, and the EDVs for childhood diarrhoea (Fig. 5). Estimated residual variation after taking
were the highest in the northwest of Queensland into account the socio-ecological factors indicate
(Mount Isa city). Figure 2 illustrates the change in that high-incidence postal areas for childhood
Downloaded from https://www.cambridge.org/core. IP address: 46.4.80.155, on 14 Aug 2021 at 05:52:22, subject to the Cambridge Core terms of use, available at https://www.cambridge.org/core/terms
. https://doi.org/10.1017/S095026881400171X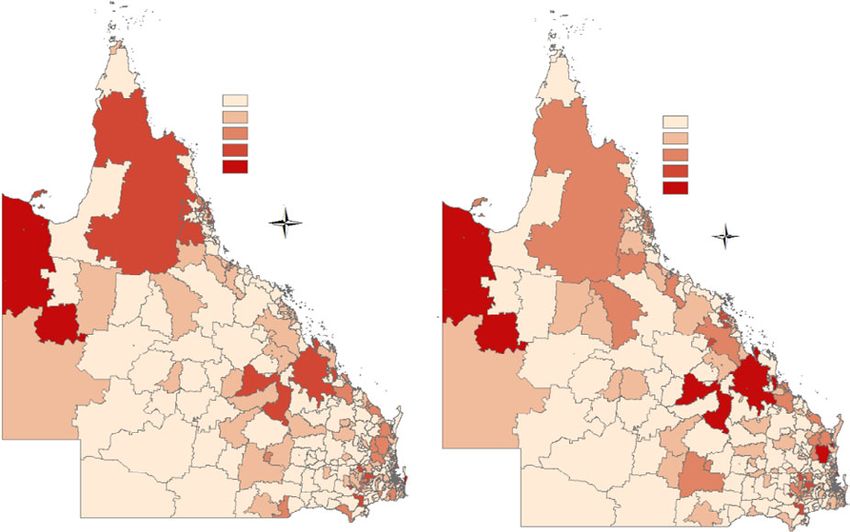
Childhood pneumonia and diarrhoea in Queensland                                   1099

             (a)                                                                               (b)

                                                    Pneumonia (1/100 000)                                                           Diarrhoea (1/100 000)
                                                          Very low (-187·20)                                                              Very low (-710·00)
                                                          Low (9187·20 to -990·10)                                                        Low (9710·00 to -2700·00)
                                                          Middle (9990·10 to -1818·20)                                                    Middle (92700·00 to -5230·00)
                                                          High (91818·20 to -2566·00)                                                     High (95230·00 to -8140·00)
                                                          Very high (92566·00 to -23880·60)                                               Very high (98140·00 to -32960·00)

                                                                    N                                                                           N

          Fig. 1. The spatial distribution of emergency department visits for (a) childhood pneumonia and (b) diarrhoea in
          Queensland, from 2007 to 2011.

             (a)                                                                               (b)

                                                      P_difference (1/100 000)
                                                            -–28·30                                                                     D_difference (1/100 000)
                                                            9–28·30 to -0·00                                                                 -–301·80
                                                            90·00 to -196·10                                                                 9–301·80 to -0·00
                                                                                                                                             90·00 to -10447·80

                                                               N                                                                                    N

          Fig. 2. The change of emergency department visits for (a) childhood pneumonia and (b) diarrhoea in Queensland, from
          2008–2009 to 2010–2011.

Downloaded from https://www.cambridge.org/core. IP address: 46.4.80.155, on 14 Aug 2021 at 05:52:22, subject to the Cambridge Core terms of use, available at https://www.cambridge.org/core/terms
. https://doi.org/10.1017/S095026881400171X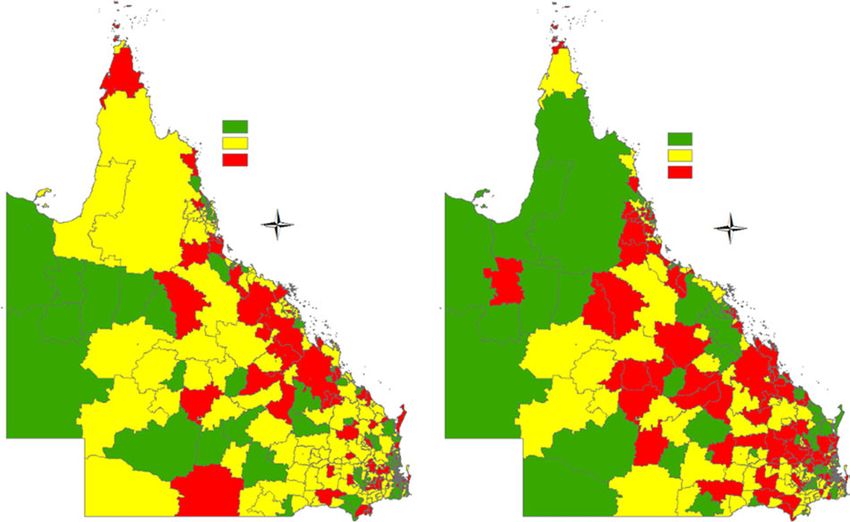
1100 Z. Xu and others
(a) (b)
80
100
Data
60
Data
60
40
20 20
0 0
20
10
Seasonal
Seasonal
10 5
5 0
0 –5
–5 –10
16 35
14 33
Trend
Trend
12
10 31
8
6 29
80
60 30
Remainder
Remainder
40 10
20 0
0
–20 –20
2007 2008 2009 2010 2011 2012 2007 2008 2009 2010 2011 2012
Time Time
Fig. 3. The daily distribution of emergency department visits for (a) childhood pneumonia and (b) diarrhoea in
Queensland, from 2007 to 2011.
(a) (b)
Cluster
RR Cluster
0·000 000 RR
0·000 000
0·000 001 – 1·304 953
0·000 001 – 1·162 085
1·304 954 – 1·468 566
1·162 086 – 1·405 346
1·468 567 – 1·570 811
1·405 347 – 2·091 078
1·570 812 – 6·866 483
2·091 079 – 5·114 417
N
N
Fig. 4. The spatial clusters of emergency department visits for (a) childhood pneumonia and (b) diarrhoea in Queensland,
from 2007 to 2011. RR, Relative risk.
pneumonia were located in the far north and north- D I S C U S S IO N
west of Queensland, and high-incidence postal clusters
for childhood diarrhoea were located in Mount Isa This study has yielded several notable findings. There
(Fig. 6). was a strong seasonal trend in EDVs for childhood
Downloaded from https://www.cambridge.org/core. IP address: 46.4.80.155, on 14 Aug 2021 at 05:52:22, subject to the Cambridge Core terms of use, available at https://www.cambridge.org/core/terms
. https://doi.org/10.1017/S095026881400171XChildhood pneumonia and diarrhoea in Queensland 1101
Table 2. Bayesian spatial conditional autoregressive models of socio-ecological drivers of childhood pneumonia and
diarrhoea in Queensland, Australia
Posterior Monte Carlo
Variable (mean±S.D.) error RR (95% CI)
Model 1: Pnuemonia (dry season)
Intercept −0·774 ± 0·1221102 Z. Xu and others
(a) (b)
Pneumonia_U
-0·00 Diarrhoea_U
>0·00 to -0·20 -0·00
>0·20 to -0·40 >0·00 to -0·20
>0·40 to -0·60 >0·20 to -0·40
>0·60 to -0·80 >0·40 to -0·60
>0·60 to -0·90
N
N
Fig. 6. Spatial random effects for emergency department visits for (a) childhood pneumonia and (b) diarrhoea.
pneumonia, with more cases occurring in the cold sea- other regions of Australia [16], and the consequent
son. Children suffering pneumonia and diarrhoea who lifelong negative health and intellectual impacts of
visited emergency departments in Queensland from lead exposure on children have also been extensively
2007 to 2011 were mainly from the central west, reported [17, 18]. In this study, we found that pneu-
northwest and far north areas of Queensland. monia and diarrhoea in children were co-distributed
According to the cluster analysis results, Mount Isa in Mount Isa, highlighting that there might be some
is the high-risk area for both childhood pneumonia common risk factors in this area. Exposure to air
and diarrhoea. Interestingly, in recent years, Mount pollutants (e.g. sulphur dioxide) emitted by mining
Isa has experienced a substantial decrease in EDVs could increase hospital admissions for childhood
for childhood pneumonia and diarrhoea, with EDVs pneumonia [19]. Mining also had a significant adverse
for these diseases moving from the west to southeast effect on the semi-arid freshwater aquatic system in
of Queensland. We found SEIFA played a relatively Mount Isa [20]. The densities of bacterial indicators
more important role than climate in the driving the in remnant pools throughout Leichhardt River have
spatial transmission of childhood pneumonia, while exceeded acceptable guidelines, which might expose
climate may be more essential in the spread of child- children to greater risk of diarrhoea. In this study,
hood diarrhoea. Only in wet seasons was rainfall we also found the risk areas for childhood pneumonia
significantly associated with EDVs for childhood and diarrhoea changed from the northwest to south-
pneumonia. Low temperature may significantly in- east of Queensland, and the EDVs for childhood
crease EDVs for childhood diarrhoea, also only in pneumonia and diarrhoea in Mount Isa have de-
wet seasons. creased sharply (although still high) in recent years,
Mount Isa city, a major lead, zinc and copper indicating that protective measures may have been
producer, is the largest emitter of sulphur dioxide, taken to safeguard children from the continuously
lead and some other metals in Australia [15]. It has adverse impacts of mining.
been convincingly documented that the blood lead In this study, we found the average SEIFA
levels of children in Mount Isa, especially those aged score was significantly associated with childhood
1–4 years, is much higher than in children from pneumonia, but not diarrhoea, implying that
Downloaded from https://www.cambridge.org/core. IP address: 46.4.80.155, on 14 Aug 2021 at 05:52:22, subject to the Cambridge Core terms of use, available at https://www.cambridge.org/core/terms
. https://doi.org/10.1017/S095026881400171XChildhood pneumonia and diarrhoea in Queensland 1103
socioeconomic factors may play a more prominent geographical co-distribution of childhood pneumonia
role in pneumonia than diarrhoea in Queensland. and diarrhoea. An advanced Bayesian spatial model
This finding conflicts with previous study conducted was used to quantify the effect of socio-ecological fac-
in China which found socioeconomic factors played tors on both childhood pneumonia and diarrhoea.
a more important part in driving the transmission of The results from this study, especially the high-risk
pneumonia than diarrhoea [21]. This inconsistency areas of pneumonia and diarrhoea we identified,
reveals that the patterns of risk factors for pneumonia may have important implications for future control
and diarrhoea in developed and developing countries and prevention of these diseases in Queensland.
may not be the same, suggesting that future preventive Two major limitations should also be acknowledged.
measures should focus on the economic characteristics First, the disease data we collected from emergency
of specific regions. With regards to the mechanism departments may underestimate the actual infected
of social and economic impacts on childhood pneu- population because only children with severe symp-
monia, we found in the literature that most risk factors toms would visit emergency departments for treat-
for childhood pneumonia (e.g. being underweight) are ment. Second, only aggregated data were used, which
socioeconomically related [2]. Children in the lower may result in some measurement bias.
socioeconomic groups appear to be living in more
crowded houses and suffer under-nutrition more
often than those with higher socioeconomic status, CO N CLU S IO N S
possibly increasing their risk of getting pneumonia. Childhood pneumonia and diarrhoea were predomi-
High rainfall was found to be significantly asso- nantly distributed in the northwest of Queensland,
ciated with more pneumonia and diarrhoea, especially and Mount Isa was the region where these two child-
in wet seasons. Two studies, so far, have formally hood diseases co-distributed. In recent years, the high-
explored the relationship between rainfall and child- risk areas of these diseases has changed from the
hood pneumonia in the Philippines [22] and the northwest to southeast of Queensland. Low tempera-
USA [23], both using a time-series approach, but did ture and high rainfall were associated with more child-
not find significant results. On rainy days, children hood diarrhoea cases, and low SEIFA score was
are more likely to spend time indoors, which may in- associated with more childhood pneumonia cases.
crease crowding and their exposure to biomass fuel Future precautionary measures should be taken before
smoke, and decrease their sunlight exposure, possibly the rainy seasons to prevent children from the impact
resulting in a higher risk of getting pneumonia. The of pneumonia and diarrhoea.
association between high rainfall and more EDVs
for childhood diarrhoea found in our study corre-
sponds to the findings of previous studies in Brazil AC KN OWL ED GE MEN T S
[24] and the USA [25]. Increased rainfall may increase
Z.X. was funded by a China Scholarship Council
the risk of sewage overflow which leads to water sup-
Postgraduate Scholarship and Queensland University
ply contamination [26]. Further, runoff of human ex-
of Technology fee waiving scholarship; S.T. was sup-
creta in soil and subsurface may increase, and result in
ported by a National Health and Medical Research
more concentrations of pathogens in surface water.
Council Research Fellowship (no. 553043).
Turbulences may be caused by increased heavy rain-
fall, leading to sediment re-suspension and dispersing
accumulated pathogens. Apart from high rainfall, low D E C L A RATI O N O F I NT E R E S T
temperature was also found to be associated with
more diarrhoeal cases in wet seasons in the present None.
study, while little evidence on the relationship between
temperature and pneumonia was found. Rotavirus
R E F E RE NC E S
has been reported as the most important cause of
acute and severe childhood diarrhoea in industrialized 1. Liu L, et al. Global, regional, and national causes of
child mortality: an updated systematic analysis for
countries [27–29], and low temperature increases the
2010 with time trends since 2000. Lancet 2012; 379:
survival and replication of rotavirus [30]. 2151–2161.
This study has several strengths. To the best of our 2. Walker CLF, et al. Global burden of childhood pneu-
knowledge, this is the first study to explore the monia and diarrhoea. Lancet 2013; 381: 1405–1416.
Downloaded from https://www.cambridge.org/core. IP address: 46.4.80.155, on 14 Aug 2021 at 05:52:22, subject to the Cambridge Core terms of use, available at https://www.cambridge.org/core/terms
. https://doi.org/10.1017/S095026881400171X1104 Z. Xu and others
3. Podewils LJ, et al. Acute, infectious diarrhea among 17. Lanphear B, et al. Low-level environmental lead
children in developing countries. Seminars in Pediatric exposure and children’s intellectual function: an inter-
Infectious Diseases 2004; 15: 155–168. national pooled analysis. Environmental Health
4. Bhutta ZA, et al. Interventions to address deaths from Perspectives 2005; 113: 894–899.
childhood pneumonia and diarrhoea equitably: what 18. Tong S, et al. Declining blood lead levels and changes in
works and at what cost? Lancet 2013; 381: 1417–1429. cognitive function during childhood: The port pirie co-
5. Walker C, et al. Diarrhea as a risk factor for acute lower hort study. Journal of American Medical Association
respiratory tract infections among young children in low 1998; 280: 1915–1919.
income settings. Journal of Global Health 2013; 3: 10402. 19. Barnett AG, et al. Air pollution and child respiratory
6. Checkley W, et al. Effect of El Niño and ambient tem- health. American Journal of Respiratory and Critical
perature on hospital admissions for diarrhoeal diseases Care Medicine 2005; 171: 1272–1278.
in Peruvian children. Lancet 2000; 355: 442–450. 20. Taylor MP, et al. Mining and urban impacts on semi-
7. Green R, et al. The effect of temperature on hospital arid freshwater aquatic systems: the example of Mount
admissions in nine California counties. International Isa, Queensland. Journal of Environmental Monitoring
Journal of Public Health 2010; 55: 113–121. 2009; 11: 977–986.
8. Garcia-Vidal C, et al. Rainfall is a risk factor for spor- 21. Feng X, et al. Social, economic, political and health sys-
adic cases of Legionella pneumophila pneumonia. PLoS tem and program determinants of child mortality re-
ONE 2013; 8: e61036. duction in China between1990 and 2006: a systematic
9. Hashizume M, et al. Association between climate varia- analysis. Journal of Global Health 2012; 2: 10405.
bility and hospital visits for non-cholera diarrhoea in 22. Paynter S, et al. Sunshine, rainfall, humidity and child
Bangladesh: effects and vulnerable groups. International pneumonia in the tropics: time-series analyses.
Journal of Epidemiology 2007; 36: 1030–1037. Epidemiology & Infection 2013; 141: 1328–1336.
10. IPCC. Summary for policymakers. In: Climate Change 23. Ebi K, et al. Association of normal weather periods and
2013: the Physical Science Basis. Contribution of El Niño events with hospitalization for viral pneumonia
Working Group I to the Fifth Assessment Report of in females: California, 1983–1998. American Journal of
the Intergovernmental Panel on Climate Change. Public Health 2001; 91: 1200–1208.
Cambridge: Cambridge University Press, 2013. 24. Andrade IG, et al. Improved sanitation and income are
11. Scallan E, et al. Prevalence of diarrhoea in the com- associated with decreased rates of hospitalization for di-
munity in Australia, Canada, Ireland, and the United arrhoea in Brazilian infants. Transactions of the Royal
States. International Journal of Epidemiology 2005; 34: Society of Tropical Medicine and Hygiene 2009; 103:
454–460. 506–511.
12. Rudan I, et al. Epidemiology and etiology of childhood 25. Drayna P, et al. Association between rainfall and pedi-
pneumonia in 2010: estimates of incidence, severe mor- atric emergency department visits for acute gastrointes-
bidity, mortality, underlying risk factors and causative tinal illness. Environmental Health Perspectives 2010;
pathogens for 192 countries. Journal of Global Health 118: 1439–1443.
2013; 3: 10401. 26. Curriero F, et al. The association between extreme pre-
13. Australian Bureau of Statistics. Census data (http:// cipitation and waterborne disease outbreaks in the
www.abs.gov.au/CDataOnline). Accessed 10 October United States, 1948–1994. American Journal of Public
2013. Health 2001; 91: 1194–1199.
14. Besag J, York J, Mollié A. Bayesian image restoration, 27. Malek MA, et al. Diarrhea- and rotavirus-associated
with two applications in spatial statistics. Annals of the hospitalizations among children less than 5 years of
Institute of Statistical Mathematics 1991; 43: 1–20. age: United States, 1997 and 2000. Pediatrics 2006;
15. National Pollutant Inventory. (http://www.npi.gov.au/ 117: 1887–1892.
npidata/action/load/individual-facility-detail/criteria/ 28. Olesen B, et al. Etiology of diarrhea in young children
year/2009/browse-type/Company/regbusiness-name/ in Denmark: a case-control study. Journal of Clinical
MOUNT%2BISA%2BMINES%2BLTD/jurisdiction- Microbiology 2005; 43: 3636–3641.
facility/Q020MIM001). Accessed 18 September 2013. 29. Parashar UD, et al. Global mortality associated with
16. Queensland Health. Mount Isa community lead screen- rotavirus disease among children in 2004. Journal of
ing program 2006–07: a report into the results of a Infectious Diseases 2009; 200 (Suppl. 1): S9–S15.
blood-lead screening program of 1–4 year old children 30. D’Souza RM, Hall G, Becker NG. Climatic factors
in Mount Isa, Queensland (http://www.health.qld.gov. associated with hospitalizations for rotavirus diarrhoea
au/ph/documents/tphn/mtisa_leadrpt.asp). Accessed 16 in children under 5 years of age. Epidemiology &
October 2013. Infection 2008; 136: 56–64.
Downloaded from https://www.cambridge.org/core. IP address: 46.4.80.155, on 14 Aug 2021 at 05:52:22, subject to the Cambridge Core terms of use, available at https://www.cambridge.org/core/terms
. https://doi.org/10.1017/S095026881400171XYou can also read