The impact of changes in the gold price on exploration activities and strategies
←
→
Page content transcription
If your browser does not render page correctly, please read the page content below
The impact of changes in the gold price on
exploration activities and strategies
Richard Schodde (presenter)

Contact:
MinEx Consulting Pty Ltd
49 Surrey Road, South Yarra, 3141, Australia
Richard@MinExConsulting.com

                                               MinEx Consulting Pty Ltd   NewGenGold 2013   Page 119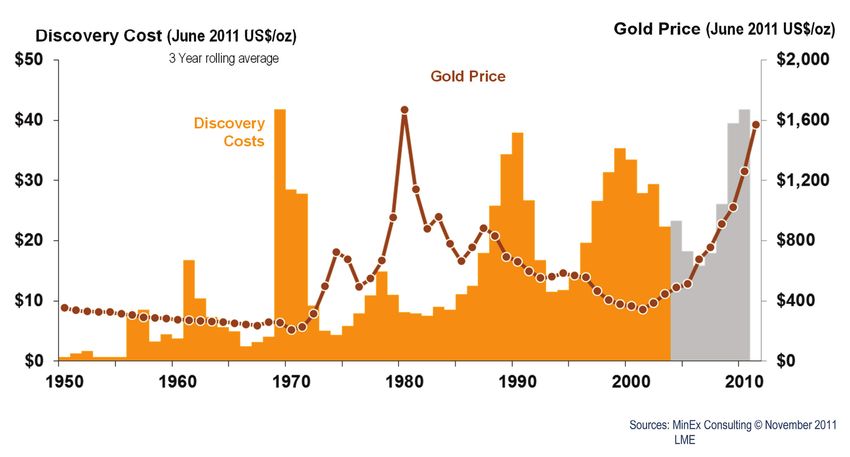
GOLD EXPLORATION OUTLOOK

Abstract
  Global spending on gold exploration peaked at $10 billion in 2012. After adjusting for inflation, this figure is 30
  times higher than what it was in 1975. Approximately once every decade the industry goes through a downturn,
  with expenditures dropping by as much as 75% from the cyclical high. The main drivers for this have been long-
  term economic growth, an underlying driver of heightened gold demand and gold price volatility itself – which is
  the predominant driver of gold exploration spend.
  A multi-factor regression model was built to predict the likely level of exploration expenditures over the rest of this
  decade under a range of gold prices varying (in constant June 2012 US dollars) from $800 to $1,800/oz. Depend-
  ing on the scenario chosen, by the year 2020 the level of global expenditures on gold could vary from $5.9 to
  $11.6 billion.
  Over the last decade (2003-2012) 238 primary gold deposits (greater than 100,000oz) were found in the world,
  containing a total of 737 moz. In addition, 67 (mainly base metal) deposits were found containing 156 moz of gold
  as by-product metal. The paper gives details of 64 major deposits (greater than 1 moz) found since 2008.
  It should be noted that the above discovery figures are conservative – in that it takes time to report and fully deline-
  ate new discoveries.
  Comparing the level of expenditures over the last four decades versus the number of discoveries shows that the
  two move together. However in the last five years a major gap has opened up and it now costs twice as much to
  make a gold discovery as it did previously. The author argues that this is driven by the recent doubling of input
  costs such as drilling, salaries for geologists and administration.
  Higher gold prices have made it economic to mine lower grade deposits. The resulting lower cut-off grades effec-
  tively increase the reported size of the resource. It also enables geologists to revisit (and drill-out) prospects that
  had been previously discarded as being sub-economic. The reverse applies in a period of low gold price. It also
  impacts on the preferred deposit style explored for.
  The recent volatility in gold prices has created problems for those investors seeking to assess the future prospects
  of gold companies. A study of 50 current published resource statements found that the price used varied from
  $800 to $2,000/oz. Of equal concern is that in an extended period of low and/or declining prices, companies may
  not have the funds (or the will) to regularly update the published resource in the light of material gold price move-
  ments. Consequently, investors need to be mindful that the published resource figure may not reflect its true size
  and potential value.
  Given the negative outlook for price and exploration, companies need to develop new strategies to survive the
  current downturn and position themselves for growth in the longer term. The paper discusses a number of generic
  survival strategies for explorers.

                             “Prediction is very difficult, especially if it’s about the future.”
                                        --Niels Bohr, Nobel laureate in Physics

Background
  The following paper is derived from a recent presentation given by the author on the long term outlook for the
  global exploration industry for a range of commodities (Schodde, 2013). The analysis was modified to focus on the
  impact of changes in the gold price on the outlook for gold exploration. It also outlines a set of possible exploration
  strategies for the industry under a low price scenario.
  The analysis uses data compiled by MinEx Consulting on mineral exploration expenditures and deposits discov-
  ered.
  MinEx’s exploration expenditure database has high-level information on the historical expenditures on explora-
  tion by commodity and region from 1950 to present. The raw data came from a wide range of sources of varying
  reliability. Where possible, it used the actual historical data reported by the relevant government agencies (such
  as the ABS in Australia, NRCan in Canada, MOLAR in China and similar agencies in other countries) and the
  published expenditure data from the mining and exploration companies themselves. It also drew on estimates
  published by leading industry analysts – including the excellent set of expenditure surveys compiled annually by
  the Metals Economics Group (SNL-MEG various years) and data from the Raw Materials Group. These, in turn,
  were supplemented by earlier studies from Schreiber & Emerson (1984), Tilton et.al. (1988), Wallace (1992, 1993),

Page 120   NewGenGold 2013   MinEx Consulting Pty Ltd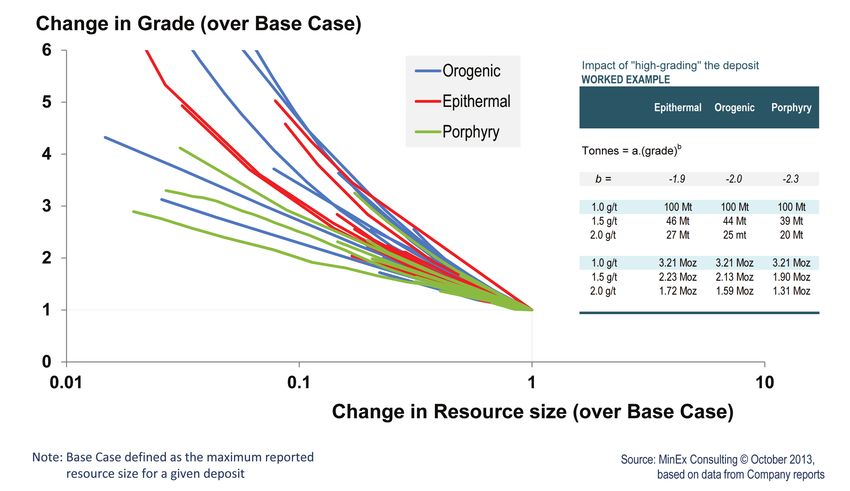
Mackenzie et. al. (1997a, 1997b),Doggett & Mackenzie (1987, 1992) and others. Finally, any remaining gaps were
 filled by MinEx’s own best estimates.
 All of the expenditure data referred to in this paper have been adjusted for inflation using the US Consumer Price
 Index and, unless otherwise specified, are reported in constant June 2012 US dollars.
 With regard to the discovery data, over the years MinEx Consulting has compiled information on more than
 54,000 mineral deposits around the world. This includes 25,363 deposits containing a pre-mined resource of
 more than 10,000oz of gold, and within this are 4,775 deposits more than 100,000oz. After excluding “satellite”
 deposits (which are counted within the parent camp totals) the database has information on 4,206 unique gold
 deposits greater than 100,000oz. Of these, MinEx has discovery dates and histories for 3,153 deposits. Special
 efforts have been made to ensure that that the coverage and data on those deposits of more than 1 moz is as
 complete and up-to-date as possible.
 Unless otherwise specified, all figures refer to pre-mined resources. This is the sum of the current reported meas-
 ured, indicated and inferred resources plus historic mine production (as reported on a head-grade basis).
 The reader should be cautioned that while the deposit database is comprehensive, coverage is by no means
 totally complete.

Trends in exploration expenditures
 The following figure shows the general trend in global exploration expenditures on gold by region over the last
 four decades.

     Figure 1: Trend in gold exploration expenditures in the World 1975-2012 in constant June 2012 US Dollars

 From this it is clear that expenditures are cyclical – with a periodicity of around 8-10 years. In detail, spending
 peaked in 1988, 1997, 2008 and (arguably) in 2012. The corresponding troughs occur mid-way through each
 cycle; in 1983, 1993, 2002 and 2009. While each cycle is subtly different, expenditures can fall by up to 75% of
 the peak amount (see Table 1). By any measure, this is a very severe shock, and companies need to have con-
 tingency plans in place to survive such an extreme event. A range of strategies to address this are discussed in
 the final section of the paper.
 Another key point to note in Figure 1 is that, notwithstanding the extreme cyclicality, the overall level of explora-
 tion expenditures has increased (in real-terms) 30-fold over the last four decades – up from $300 million in 1975
 to an all-time high of $10 billion in 2012. Late stage exploration targets and deposits with known resources have
 been a particular focus of recent increased exploration expenditure due to the perceived ability to rapidly convert
 prospects into mines.

                                                                              MinEx Consulting Pty Ltd   NewGenGold 2013   Page 121
GOLD EXPLORATION OUTLOOK
The two key drivers for the increased exploration activity are the general economic growth of the world’s economy
(and China in particular) and a major increase in the price of gold. In practice, these factors are inter-related.
Firstly, growth in the world’s economy increases the overall demand for gold – which increases the need for more
production and, in turn, generates the need for companies to find new ounces to replace what’s been mined. Over
the last 40 years world gold production doubled from 1,440t in 1972 to 2,700t in 2012. As a general rule, stronger
metal demand leads to higher prices. Over the same period, the price of gold (as measured in constant 2012 US
Dollars) has risen five-fold from $320/oz to $1,676/oz. Higher prices make it economically attractive for companies
to raise money and explore for new gold deposits.
Strong and sustained economic growth also affects investment behavior. Over time, people become more willing
to invest in high-risk endeavors – such as mineral exploration. As well as enabling new companies to enter the
field, it also increased the level of spending per company.
Table 1: Cyclical expenditures for World gold exploration (as measured in constant 2012 US$ Billion)
Long term trends in the gold price and exploration expenditures
Figure 2 show the strong link between the gold price and exploration expenditures. To provide some context on
the likely outlook for the industry, Figure 2 includes 21 different gold price forecasts compiled by Consensus Eco-
nomics (in June 2013). These forecasts were sourced from leading economists, investment banks and stockbro-
kers. Notwithstanding the broad spread of opinions, at the time of writing most experts were predicting the gold
price to fall over the rest of the decade. Taking a simple average of these forecasts suggests a price in the year
2020 of around $1,200/oz (in constant June 2012 US dollars).
Figure 2: Trend in the gold price and gold exploration expenditures in the world 1975-2012, with various forecasts
out to 2020. All figures are in constant June 2012 US Dollars
Page 122 NewGenGold 2013 MinEx Consulting Pty LtdFigure 3: Relationships between the gold price and gold exploration expenditures in the world
1975-2012, All figures are in constant June 2012 US Dollars
As can be seen in Figure 3, since the mid-1980s, gold prices and exploration expenditures have moved closely
together. As a rule of thumb, a $100/oz change in the gold price will correspondingly change the level of global
gold exploration by $500-600 million p.a.
It is noted that price and exploration spend were only very loosely linked in the years before 1985 and situations
arose where expenditures rose in periods of declining price. The author argues that the apparent disconnect was
due to the evolving nature of the industry at those specific times. In particular, a number of key historical factors
are recognised:
• Inertia effects: It took time for the industry to respond to the sudden spike in gold prices in the late 1970s.
Companies and investors were not sure if the higher prices would persist. In the four decades prior to
1972, the price of gold was artificially fixed at $35/oz (in nominal terms). Cost inflation over this period
severely impacted on the industry’s profitability. Consequently, only a very limited number of companies
(and skilled geologists) were available to act on the higher prices. It took several years for the industry
to catch-up.
• Exploration innovation: During this period major innovations occurred in exploration search
techniques (such as the use of atomic absorption spectroscopy to detect low levels of gold in geochemical
samples), low-cost production methods (such as large-scale open pit mining, CIL/CIP and heap leaching)
and new forms of financing (gold loans and hedging made it possible for junior companies to raise
money). All three factors contributed to significant exploration success over this time and helped stimu
late the industry in a period of declining prices through the 1980s and 1990s (and may have contributed
to the decline).
• Geopolitical impacts: The end of the Cold War (in 1989 for the Soviet Union, and the early 1990s in
China with the implementation of Deng Xiaoping’s Economic Reforms) had a profound effect on the
level of gold exploration around the world. Prior to then, exploration activities in the socialist countries
were driven by the priorities of central planning rather than market-forces. In other words, exploration for
gold in these countries was not driven by external price signals. Parallel to this, the end of the Cold War
opened up much of the developing world to exploration. This encouraged Western companies to
explore in previously neglected parts of Africa, Asia and Latin America.
The author argues that since the late-1980s the gold industry has matured and, as a result, the general trends
observed since then can be used to predict the future.
Given the above, the author constructed a multi-factor regression model using 27 years of data (and covering
MinEx Consulting Pty Ltd NewGenGold 2013 Page 123GOLD EXPLORATION OUTLOOK
multiple cycles) to predict the likely exploration spend by region1 over time. These were then compiled to produce
an expenditure figure for the global gold industry. The three key variables modelled were the gold price, its per-
centage annual change (as a measure of changes in market sentiment) and the long term growth in metal demand
(which underpins the growth in spend over time). Figure 4 shows the level of fit between the actual expenditures
and that predicted (or “hind-cast”) by the multi-factor model. For the period 1985 to 2012 the model estimated
global expenditures with reasonable precision – with an R2 of 0.89 and a 95% confidence level of $570 million2.
For the 10 individual regions, the R2 factor varied from 0.40 to 0.93 with an average of 0.76. While less precise,
this indicates that the model is still a useful tool for assessing exploration trends at the regional level.
It is interesting to note that the R2 for the global expenditures is higher than the average for the individual regions.
This implies that an increase in spend in one region is counter-balanced by a decrease elsewhere. This is consist-
ent with the hypothesis that (as a first-order effect) local changes at the regional level don’t affect the overall spend
by the gold industry; instead what happens is that changes in risk and potential do encourage a shift in exploration
between regions. In other words, it’s a “zero-sum game”. This is an important insight for governments to learn.
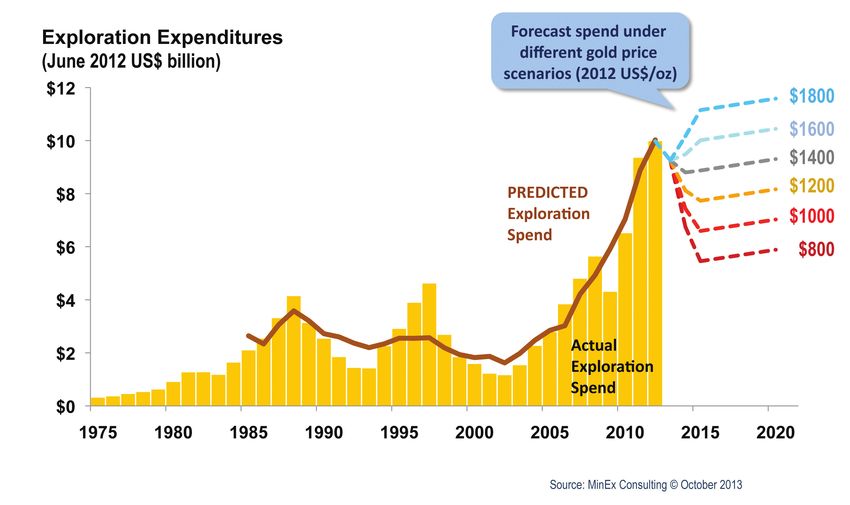
Figure 4: Predicted and actual exploration gold exploration expenditures in the World 1975-2012, and forecast
expenditures for 2013-2020 under a range of gold prices. All figures are in constant June 2012 US Dollars
It should be noted that the model has a number of limitations and simplifications that impact on its accuracy. In
particular:
• The model was built using annualised data – and as such it inherently flattens out the peaks and troughs.
The actual gold price can vary quite significantly over a given year and this can impact on investors’
perceptions about the future outlook for gold.
• The model is based on three input variables only, and as such could be missing other key factors3. For
example, it ignores the level of funds within the industry. When cash reserves are low, companies are
more cautious with their spending.
• The forecast expenditures assume no change in business risk or geological potential over time. Higher
taxes and land access issues will reduce the level of funding at the local and regional level. Conversely,
the introduction of flow-through financing in Canada in the 1980s (and again in the 1990s) certainly
boosted exploration there. Similarly, the announcement of a major discovery encourages other compa-
nies to explore in the local area. As noted before, the model implicitly assumes that changes in local
expenditure rates will cause a matching and opposite change in spending rates in the other regions. In
other words, it assumes that these factors do not impact on the global level of spending.
Notwithstanding its limitations, the model is a useful tool for assessing the long-run impact of changes in the gold
price on the long run level of exploration expenditures.
1
Ten regions were modelled. See Figure 3 for details.
2
There is a 95% chance that the predicted global expenditure will be within a range of +/- $0.29 billion of the actual figure.
3
As part of the design process for the model, the author looked at several different potential inputs and methodologies. The final
selection was made on the basis of simplicity and (statistical) robustness.
Page 124 NewGenGold 2013 MinEx Consulting Pty LtdFigure 4 includes a forecast level of global exploration expenditure under a range of different price scenarios –
where the gold price was fixed at constant real price of $800/oz to $1,800/oz (in constant June 2012 Dollars) from
2014 onwards. The range reflects the general range of opinion4 on the future direction of gold prices. Depending
on the price scenario chosen, by 2020 the level of global expenditures on gold could vary from $5.9 to $11.6 bil-
lion. At a long-run price of (say) $1,300/oz (which matches the price prevailing at the time of writing this paper),
expenditures are forecast to fall from $10 billion in 2012 to $8.3 billion in 2015 before slowly back to $8.7 billion by
2020. This translates into a fall of 17% between 2012 and 2015. In the short term, the fall could easily be larger
than this. An important factor driving this is the fact that gold prices are extremely volatile. For example, a short
term variation of +/- $200/oz (around the long-run price) would affect global expenditures by $1 to $1.2 billion pa
on that forecast in Figure 4. In the case of the $1,300/oz long-run price scenario, price volatility could potentially
cause spending to spike down to $7 billion – a fall of around 30%.
To put the $1,300/oz scenario in context, the projected 17-30% decline it is less severe than that which occurred
in the previous cycles (66% in 1988-1993 and 75% in 1997-2002).
Long term trend in exploration expenditures by region
Figure 5 shows the relative expenditures on gold exploration in the various regions since 1975. As shown, over
the last 30 years there has been a progressive movement of exploration spend away from the traditional mining
countries of Canada, US and Australia to emerging regions in Latin America, Africa, China and the Former Soviet
Union.
It is particularly worth noting the significant rise in exploration for China has moved in-step with the dramatic
growth in gold production there. Over the last decade 2002-2012, Chinese production doubled from 210 tpa to 403
tpa. During the same time period exploration expenditures in China grew ten-fold from $50 million to $500 million
pa (in constant June 2012 US Dollars).
The shift in the spending pattern between regions is driven by opportunity. The author assumes that this trend
will continue in the future. As a result, Australia’s share of the global exploration budget is set to shrink from 7.7%
at present to around 7.2% by 2020. A similar percentage point loss is projected for Canada, (down from 16.8% to
16.2%) and the United States (9.5% to 9%). Africa is set to fall by 1.7% (from 18.4% to 16.7%). The winners are
projected to be China (up 5.0% to 6.7%) and the Former Soviet Union (up by 1.5%).
As noted before, the projected changes in market share are based on pre-existing perceptions regarding the
relative difference in exploration opportunities between the various regions. The actual outcome could be quite
different, since it will be influenced not only by changes in the actual gold price, but also by changes in perceived
business risk and local exploration success.
Figure 5: Forecast percentage share of gold exploration expenditures by Region: 1975-2020
4
With regard to forecasting the price of gold, studies indicate that even the most sophisticated econometric models are only marginally
more reliable than assuming a simple random-walk for the future price of gold (Trück and Liang, 2012).
MinEx Consulting Pty Ltd NewGenGold 2013 Page 125GOLD EXPLORATION OUTLOOK
Major gold discoveries made in the last decade
MinEx has compiled data on 258 primary5 gold discoveries (containing more than 100,000oz each) found in the
period 2003-2012. These deposits have a resource of 737 moz.
Table 2 lists 64 major discoveries (containing more than 1 moz each) made since 2008. Table 3 compares this
against a similar list compiled by the author (Schodde, 2011) for the 2011 NewGenGold Conference.
These figures should be treated as being conservative, since they do not include unreported discoveries. Nor
does it include an allowance for resource growth over time. As noted by the author (Schodde, 2011), on average
there is a 3.7 year delay between making a discovery and reporting a maiden resource. Also, there are many
examples where follow-up drilling led to the reported resource growing by a factor of 2-3 in subsequent years.
Adjusting for these factors increases the above discovery data for the last decade by at least 30-50%, especially
for the more recent discoveries. Table 3 highlights this effect as it includes data on several discoveries not previ-
ously identified in the 2011 study. Not counting the eight new deposits in the intervening period, an additional 14
discoveries have been identified for the period 2008-2011. The analysis also includes six previously known de-
posits that have grown in size to meet the 1 moz threshold. Four discoveries were taken off the list because they
have now fallen below the minimum size threshold. After adjusting for other minor factors, since completing the
previous study in 2011, the total number of known deposits (that are greater than 1 moz in size) discovered in the
period 2008-2011 grew from 40 to 56, and the reported amount of gold found doubled from 106 moz to 217 moz6.
Future surveys are certain to add more discoveries and ounces to the list.
Finally, it should be noted that only seven of the 258 primary gold discoveries made over the last decade were
“world-class” or Tier 1. A further 30 were classified as Tier 2 and 134 discoveries were Tier 3. Also, 87 of the 258
discoveries were considered to be either too small (i.e. less than 1 moz) to receive a Tier classification7.
It should be noted that, by definition, the Tier 3 deposits are modest in size and marginally economic. There is no
certainty that they will be mined in the near future. This is especially so under a low gold price scenario.
On a more general note there is no certainty over how much of the reported resources will converted into mine-
able reserves.
5
An additional 67 Base Metal and PGM deposits were found that contain > 0.1 Moz of by-product gold. The total amount of by-product
gold was 156 Moz.
6
The 217 Moz figure includes 21 Moz for the Brucejack deposit - which the previous study incorrectly assumed had been discovered in
2007. No allowance has been made for the nine deposits with no published Resource.
7
See Appendix A for the author’s definitions of the various Tier classifications.
Page 126 NewGenGold 2013 MinEx Consulting Pty LtdTable 2: Major (>1 Moz) gold discoveries made in the World since 2008. Reported figures refer to Measured indicated & Inferred
Resoruces
MinEx Consulting Pty Ltd NewGenGold 2013 Page 127GOLD EXPLORATION OUTLOOK
Table 3: Comparison between the current list of major gold discoveries and that previously identified by the author in 2011 (for the
period 2008-2011)
Page 128 NewGenGold 2013 MinEx Consulting Pty LtdTrends in unit discovery costs
In his 2011 NewGenGold Conference paper, the author took into account these factors and estimated that the
unit discovery cost for gold doubled over the last 20 years and is now running at over $40/oz (in constant 2011
US Dollars) – see Figure 6. Even though the analysis has not been updated, the author believes that the general
trend and costs are still valid.
Figure 6: Unit discovery costs in the Western World: 1950-2011, as previously reported by Schodde (2011)
Industry performance in the last decade
The discovery performance per unit of spend (or “bang-per-buck”) varies quite significantly across the regions. It
also varies depending on which measure is used – whether the number, size or quality of deposits found, or the
amount of ounces discovered.
Table 4 shows that, over the last decade, a total of $51 billion (in constant June 2012 US dollars) was spent explor-
ing for gold. At the time of writing, a total of 737 moz of gold had been found in 258 primary gold deposits (that
were greater than 100,000oz in size). This indicates an average discovery cost of (51 ÷ 0.737 =) $69/oz or $198
million per deposit found. However, as previously discussed, it takes several years for a discovery to be reported
and fully drilled out. As a result, the actual discovery costs are likely to be less than half that indicated above (see
Figure 8).
It should be emphasised that Table 4 refers to the exploration and discovery of primary gold deposits only. It ex-
cludes any gold found as a by-product of other metals such as copper8. For consistency, the analysis excludes the
expenditures incurred exploring for other metals.
Notwithstanding the issue of under-reporting, the relative performance ratios for the various regions should reflect
the current situation. As per Table 4:
• Australia accounted for 10% of the spend, and found 12% of the primary gold deposits (by number) but
only 4% of the total ounces – suggesting that many of the discoveries in Australia were small in size.
• The opposite was the case for Canada, which accounted for 20% of the exploration expenditures, 13%
of the deposits (by number) and 31% of the total ounces, most of which were associated with giant dis
coveries such as Snowfield (Tier 2), Chester (Tier 1) and Detour Lake (Tier 1).
• More importantly, Canada accounted for 27% of the highly prized Tier 1 and 2 primary gold deposits
found in the world during that period. Africa performed well, and accounted for 19% of the ounces found
and 29% of the discoveries by number, for 15% of the expenditure.
• By contrast, Pacific/South East Asia and Western Europe (which, for purposes of this study includes
Turkey) performed poorly, with no Tier 1 or 2 primary gold discoveries and only 2% of the total ounces
found in the world over that period.
8
A good example would be Newcrest’s and Harmony’s joint discovery of the Tier 1 Golpu copper deposit in Papua New Guinea. This
deposit has a current resource of 9 Mt of copper and over 20 Moz of gold.
MinEx Consulting Pty Ltd NewGenGold 2013 Page 129GOLD EXPLORATION OUTLOOK Table 4: Gold exploration expenditures and discovery performance by region for 2003-2012 Impact of rising discovery costs The rapid increase in unit discovery costs impacts on the long-term viability of the industry as it makes it harder on average for companies to create value and raise the funds necessary for further work. Figures 7 and 8 show that, in the case of developed countries in the West, over most of the last 30 years, the rate of gold discoveries has tended to move in line with the amount of expenditures on gold exploration and that the unit cost per discovery has progressively increased from $40 million in the early 1980s (1980-85) to $81 million by the early 2000s (2000-05). However, even after adjusting for the likely number of unreported deposits, costs are presently running at over $150 million per discovery. In other words, a large gap has opened up in the last five years between expenditures and the estimated number of discoveries made. Figure 7: Trend in exploration expenditures and primary gold discoveries in the Western World: 1975-2012 Page 130 NewGenGold 2013 MinEx Consulting Pty Ltd
Figure 8: Cost per primary gold discovery (>0.1 Moz) in the Western World: 1975-2012.
         All figures are in constant June 2012 US Dollars

The bottom line is that it now costs twice as much to make a discovery as before. In other words, exploration
productivity has halved in the last five years.
One oft-cited explanation for the decline in performance is the view that the world is running out of easy targets,
and that it is progressively becoming more difficult to make a discovery. Figure 6 confirms this with unit discovery
costs doubling in the last two decades.
Many industry commentators lament that “all of the deposits sticking out of the ground have now been found”.
While this makes for a good sound-bite, it doesn’t match the fact that, over the past decade, 49% of gold deposits
found in the world outcropped. Even in mature countries like Canada, the US and Australia, surprisingly 29% of
the new discoveries had some form of surface exposure. Figure 9 shows that the average tonnes and grade of
outcropping discoveries varies by region.

     Figure 9: Reported tonnes and grade for outcropping primary gold deposits (>0.1 Moz) found in the world since 2003

                                                                            MinEx Consulting Pty Ltd   NewGenGold 2013    Page 131
GOLD EXPLORATION OUTLOOK
In the case of Canada, USA and Australia many of the outcropping discoveries were large but low grade and previ-
ously known9. Putting aside the issue of whether one can economically mine low-grade deposits (which is a real
concern under a low gold price scenario), it is fair to say that the average depth of cover for discovery is progres-
sively increasing over time (Schodde, 2011).
Another, more telling observation, is that the transition away from outcropping gold deposits has been gradual
and, as such, does not fully explain why there has been a sudden decline in exploration productivity in recent
years.
The author argues that a more likely culprit is the dramatic and sustained increase in input costs – such as drilling,
labour, land access and administration. All of these have doubled in real terms over the past decade. For exam-
ple, data compiled by the author (Schodde, 2013) for Canada found that, between 2000 and 2012 average drilling
costs10 (as measured in constant June 2012 US dollars) increased from $112/m to $210/m, and the cost of hiring
an experienced exploration manager increased from $93,000 to $170,000 pa.
Similar rises have been experienced by other services and in other countries. Consequently, given that it costs
twice as much to do the same amount of work in the field, it should be of no real surprise to the reader that the
cost per discovery has also correspondingly doubled.
Ironically, the main factor behind the rise in input costs is the mining boom itself which drove up the demand for
exploration services, as well as strengthening the currencies in many resource-rich countries. Stronger curren-
cies made locally-sourced inputs expensive when measured in US Dollar terms.
While the end of the current boom will result in the industry cycling back to lower exchange rates, cheaper drilling
and more reasonable labour costs, some of the other input costs seem unlikely to fall over time. Of particular con-
cern is the extra administration costs associated with operating in remote areas and/or addressing safety, social
and environmental concerns. These costs, in addition to rising government imposts, are likely to continue to in-
crease over time. Furthermore, the challenge of exploring under deeper cover will continue to increase over time.
Offsetting some of the cost rises are continued innovations in search technologies, drilling methods and better
management practices. The application of innovative geoscience practices along with adoption of technological
advancements represents one of the few avenues to substantially unwind and reduce these cost pressures in
exploration.
Referring back to Figures 1 and 6 show that that the exploration industry’s efficiency varies through the business
cycle. When measured in terms of dollars per ounce found, the industry is least efficient at the top of the explo-
ration boom and most efficient at the bottom of the bust. As discussed above, this is driven by changes in input
costs. It is also driven by changes in the quality of the exploration project portfolio (i.e. in the boom times compa-
nies tend to take on marginal/low quality projects, whereas in bust times, when funds are scarce, they are focused
on advancing their highest quality projects).
Impact of changes in the gold price on the preferred exploration target type
In addition to stimulating increased exploration activity, one side benefit of a rising gold price is that it enabled
companies to profitably mine lower grade deposits. This is especially true for mines already in production. For a
given deposit, using a lower cut-off grade greatly expands the envelope of economic ore thereby adding more
ounces to inventory.
Figure 10 shows the tonnes-grade (TG) relationship for 45 primary gold deposits. The sample data comprises an
equal number of orogenic-, epithermal- and porphyry-style primary gold deposits greater than 500,000oz in size.
As a generalisation, the gold-rich porphyry-style deposits had lower gold grades than the other deposit styles.
The key point to note in this chart is that there is an economic trade-off between tonnes and grade. During times
of high gold prices the optimum point lies at the right end of the TG curve (i.e. large tonnes/low grade), whereas
the opposite situation applies during times of low prices. One strategic consequence from this is that in a low gold
price scenario, orogenic-style deposits are the preferred target type as these can deliver higher grade deposits
(albeit smaller in size).
9
An unpublished review by the author of the discovery history of these large-low grade deposits identified that many of them had evidence
(from earlier explorers) of low-grade mineralization at surface. However, it took higher gold prices to incentivize the company to acquire
the property and drill sufficient holes to recognize the full extent of the mineralisation and report the discovery. As a point of clarification,
if the exploration program leads to an order-of-magnitude increase in the size of the resource, the author considers this to be a new dis-
covery. An example of this would be Cadia where 50 Moz of gold was found in 1993 by Newcrest in an area of old copper workings dating
back to 1841.
10
The reported unit drilling cost excludes the associated cost of analytical services.
Page 132 NewGenGold 2013 MinEx Consulting Pty LtdA subtle, but strategically important point to note is that the general shape of the TG curve varies by deposit style
and that the preferred target type depends on the gold price used. Figure 11 helps clarify this point. Figure 11 is a
“normalised” version of the TG data presented in the previous figure where the information for the largest sized/
lowest grade data point for each deposit curve normalised to equal 1:1. Doing this highlights the fact that porphyry-
style deposits generally have “flatter” tonnes-grade curves than other deposit styles. There is also a practical limit
to how much upgrading a porphyry deposit can handle as they generally don’t have a coherent high-grade core.
The consequence of a flatter TG curve is that, in periods of low gold prices, moving to a higher cut-off grade af-
fects porphyry- deposits more than that for orogenic- or epithermal-style deposits. For example, doubling the cut-
off grade on 100mt @ 1 g/t gold deposit will, on average, reduce it to 27mt @ 2 g/t for an epithermal-style deposit,
25mt for an orogenic-style deposit and 20mt for a porphyry-style deposit. In this example, the total amount of gold
in the resource shrinks from 3.14 to 1.72, 1.59 and 1.31 moz respectively. On a percentage basis, doubling the
cut-off grade (and head-grade) shrinks the available ore tonnes by a factor of 4-5 and total contained ounces by
45-60%.
To summarise, during periods of high gold prices, there is a natural bias to explore for porphyry-style deposits as
these can deliver large inventories of ounces. However, the opposite applies during periods of low gold prices. In
this scenario, epithermal and orogenic systems become relatively more attractive. The final decision, of course,
will be driven by the relative prospectivity for each deposit style in the target area.
Impact of the gold price assumptions used in resource calculations
One of the unintended consequences of the recent run-up (and subsequent collapse) in gold prices is that the
current reported inventory of gold resources is based on a wide range of different gold prices. The rate used is a
function of the date the analysis was done, and the company’s outlook for future gold prices. Table 5 below shows
the distribution in price assumptions used for a randomised sample of 50 undeveloped gold deposits containing a
resource larger than 1 moz. To reflect current practice, the list of deposits used was limited to include only the lat-
est resource statement published by the Company in the last two years (or more precisely, in the period January 1,
2012 to October 1, 2013). It highlights two worrying concerns. Firstly, 24% of the resource statements didn’t have
any supporting text that discussed the price assumptions used. Secondly, for those that did report, the price used
varied by a factor of two – ranging from $800/oz to $2,000/oz. The average figure was $1,333/oz, and the median11
figure was $1,400/oz12. In both cases, the rate is less than the $1,300/oz gold price prevailing at the time of writing.
Table 5: Range of gold price assumptions used in current resource calculations (for Resource Statements published between 1 Jan 2012 to 31
Oct 2013) Based on a random sample of 50 undeveloped primary gold deposits containing >1Moz
11
The median price refers to the price where half of the projects surveyed were above/below this figure.
12
The author’s figures are consistent with a survey carried out by the consulting firm PwC in late 2012 which identified the gold price used
to calculate reserves in 2012 for 32 mid-tier and major gold producers. The reported average and median prices for 2012 were $1303 and
$1250 per ounce respectively (PwC, 2012).
MinEx Consulting Pty Ltd NewGenGold 2013 Page 133GOLD EXPLORATION OUTLOOK
Figure 10: Tonnes-grade curves for 45 primary gold deposits (>0.5 Moz)
Figure 11: NORMALISED Tonnes-grade curves for 45 primary gold deposits (>0.5 Moz). Note: The associated formula is based
on the average of the 15 curves for each deposit style.
As estimated in the previous section, doubling the cut-off grade (which is the same as halving the gold price) will
halve the reported ounces. In practical terms what this means is that, depending on the study date and its com-
mensurate gold price assumption, the same deposit could end up with a wide range of different resource sizes.
A related problem is that updating the existing resource is a time consuming and expensive exercise. Junior com-
panies may not have the funds or the enthusiasm to do this especially if it is going to lead to a significant reduction
in the notional size of their core project. Their logic is “is it in our shareholder’s interest to spend money updating
the resource when we know that the new figure will be smaller than it was before?” As the down-cycle progresses,
funds dry-up and companies go into hibernation, there is a real risk that the industry could end up with an increas-
Page 134 NewGenGold 2013 MinEx Consulting Pty Ltding pool of (what the author calls) “zombie” deposits where the reported resource bears no resemblance to its real
size or value. At its extreme, it could cause investors to lose confidence in the integrity of the exploration sector
and mislead governments with regard to the overall size and health of the industry.
While each company has valid reasons for selecting their own gold price, it is vitally important that outside parties
making investment decisions have a clear understanding of the assumptions underpinning the reported resourc-
es, and lack of industry standardisation. In short, it is an obvious case of “buyer beware”.
Exploration strategies under a low gold price scenario
It is fair to say that the gold price will remain volatile. At the time of writing, the consensus view of the industry
experts is for the gold price to fall below $1,200/oz (in constant June 2012 US dollars) by 2020. If so, expenditure
on gold exploration will correspondingly fall. To survive such a scenario, companies need to develop viable explo-
ration strategies and robust contingency plans.
A good starting point for developing and evaluating a business strategy is Michael E. Porter, who has written sev-
eral management books (Porter, 1980, 1985) on this topic. He developed the following matrix which evaluates a
company in terms of its relative competitive advantage and the competitive scope of the industry.
Figure 12: Porter’s three generic business strategies (Porter, 1980)
The first dimension is fairly obvious and is based on the company’s costs relative to its competitors. If the company
is fortunate enough to be low cost then the best strategy should be to preserve/grow its cost advantage. If the
company doesn’t have a strong cost position the strategy should be to differentiate itself from its competitors by
providing a better service and, in the process, generate better margins.
The second dimension relates to the size of the business relative to the market. If the company is only a small
player then its only strategic option is be ”good” in its niche – either through being the lowest cost producer in that
particular area or by offering a higher-value service.
Given that gold miners produce a product of homogeneous quality and value, the opportunities to gain competi-
tive advantage through product differentiation are very limited. Hence it is no surprise that the industry’s laser-like
focus on reducing costs as the principal way of remaining competitive. Simply put, everyone wants to be in the
bottom quarter of the cost curve.
A more nuanced-approach for developing a successful strategy is to study the various components of the busi-
ness’s value-chain. A company can gain significant strategic advantage by performing key activities more cheaply
or effectively than its competitors (Porter, 1985). Exploration is one such link along this chain. In the context of
exploration, the primary activities of the team include; identification and acquisition of targets, testing and evalu-
ation, and the marketing of any subsequent discoveries. To support this, the exploration team needs to have ap-
propriately skilled and motivated people, as well as the facilities, tools, systems and data for them do their job well.
MinEx Consulting Pty Ltd NewGenGold 2013 Page 135GOLD EXPLORATION OUTLOOK
Finally, they need good management and access to sufficient funds to make it all happen. The timing of this all
needs to be synchronised with the rest of the value-chain.
Given that exploration is a high-risk, high-reward activity, being more effective and efficient in these activities will
have significant pay-offs to the company in general13. In addition to finding valuable new deposits, exploration
plays a vital role in sustaining the mining company’s operations (by finding additional reserves at existing opera-
tions) and by assisting the company’s business development team to identify potential acquisitions. A clear articu-
lation of the exploration team’s role in supporting the business greatly assists in setting the strategic direction and
required capabilities for the team.
On a more practical level, thinking about the relative value and cost of each of the key activities will help craft a
robust set of business strategies for the exploration team.
Some practical examples for each of the three generic strategies include;
• Cost leadership strategy: Develop exploration techniques and management systems that lower the
effective cost per discovery – by boosting the success rate and/or lowering the input costs (such as drilling,
labour and office overheads) associated with the exploration activities.
Alternatively, to conserve cash, the team could put its projects into hibernation and keep them ready for
when the market rebounds.
• Differentiation strategy: i.e. follow a different path to your competitors. For example:
Seek alternate sources of funding. Rather than joint venturing with the usual industry partners,
consider the opportunity to develop strategic partnerships with companies that have strong interest in a
successful outcome of your project. These include the company next door (that owns a hungry mill), the
customers for your product (a key consideration for specialty metals and industrial minerals), key
suppliers (such as the drilling contractor who can provide cheap drilling in return for equity), construction
companies (who will design and build the mine for you). Or, (in what used to be standard practice for
many junior companies), employees exchange part of their salary for sweat-equity in the company.
Another alternate source of funds would be to sell a royalty stream over future production.
Consider diversifying into commodities with better price outlooks. Rather than switching completely out
of gold, one might be able to refocus on multi-metal targets. Doing this would differentiate the business
from the “pure” gold companies.
• Niche (or focused) strategy; Simplify the business by focusing on a limited number of locations/coun-
tries/commodities/deposit styles in the exploration portfolio. The aim is to choose the best projects and
reduce the amount of money spent on overheads. It may be better to fund a few good projects well, than
have a large number of inactive projects with high holding costs.
Alternatively (if you have the funds) grow the footprint of the company’s tenements in the area of focus,
as competitors relinquish their ground.
Focus on projects central to the company’s survival. One common strategy is for the company to
redirect its exploration efforts onto brownfield/near-mine exploration with the aim of extending the mine-
life and protecting the company’s cash flows. Ironically, this actually a high-risk strategy as it effectively
eliminates any options to break out of the current reality.
Related to the above, to generate cash the company may elect to “high-grade” the deposit. This can
dramatically shorten the life of the mine and cause a major write-down in the asset value (and so impact
on the company’s share price and ability to raise funds). It is critical that the geologists have enough
money, ideas and time to replenish the inventory.
The preferred strategy chosen will depend on the local circumstances – which will obviously vary from company
to company.
As a final cautionary note, it is strongly recommended that the exploration team should only choose one generic
strategy. To quote Michael Porter; “if a company is to obtain a competitive advantage, it must make a choice about
the type of competitive advantage it seeks to obtain and the scope within which it will attain it. Being “all things to
all people” is a recipe for strategic mediocrity and below-average performance, because it often means that the
company has no competitive advantage at all” (Porter,1985 page 12).
13
This approach is also valid for a single-link “pure” exploration company, in that the pay-off to shareholders from making a discovery is
that it enables the company to become a producer, or by selling the project to a third party.
Page 136 NewGenGold 2013 MinEx Consulting Pty LtdConclusions
2012 was a peak year for exploration. Global expenditures for gold reached an all-time high $10 billion – up 30-fold
on the $310 million (in constant June 2012 US Dollars) spent back in 1975.
Approximately, once every decade the industry goes through a downturn, with expenditures dropping by as much
as 75% from the cyclical high. The main drivers for this are economic growth and gold prices. The author built a
multi-factor regression model to predict the likely future level of exploration at a regional and global level. Based
on 27 years of historical data the model is accurate to +/- $300 million pa.
A range of gold price scenarios were modelled with the price varying from $800/oz to $1,800oz (in constant June
2012 US dollars) Depending on the price scenario chosen, by 2020 the level of global expenditures on gold explo-
ration could vary from $5.9 to $11.6 billion. At a long-run price of (say) $1,300/oz (which matches the price prevail-
ing at the time of writing this paper), expenditures are forecast to fall from $10 billion in 2012 to $8.3 billion in 2015
before moving slowly back to $8.7 billion by 2020. This translates into a fall of 17% between 2012 and 2015. Due
to price fluctuations and possible over-reactions by industry, the total fall could easily be larger than this.
Over the forecast period to 2020 China and the FSU’s share of the total spend is set to grow at the expense of
Australia and South East Asia. The actual outcome could be quite different, since it will be influenced by changes
in business risk and local exploration success.
MinEx estimates that over the last decade a total of $51 billion (in constant June 2012 Dollars) was spent on ex-
ploring for gold. During that time (2003-present) 238 primary gold deposits (greater than 100,000oz) were found.
These contain 737 moz. A further 67 (mainly base metal) discoveries were made where gold is a by-product,
which contain 156 moz.
The above discovery figures should be treated as being conservative, since they do not include missing discover-
ies or take into account the inherent delays in drilling out and proving up the deposit.
Future surveys are certain to identify more discoveries and ounces.
After adjusting for the above factors, MinEx estimates that unit discovery costs are currently running at around
$40/oz which is double what it was 20 years ago.
A comparison of the number of discoveries versus expenditure shows that for most of the last 40 years, the two
moved together. However, even if one adjusts for the delay in reporting discoveries, in the last five years a large
gap has opened up. It appears that it now costs twice as much to make a discovery as before. In other words,
exploration productivity has halved. The reason for this gap appears to be driven by a dramatic and sustained
increase in input costs such as drilling, labour, land access and administration. All of these have doubled in real
terms over the past decade. This was due to inflationary effects associated with the mining boom, coupled with
stronger currencies for Australia and Canada. The author speculates that, with the end of the mining boom, explo-
ration costs should return back to normal over the next few years.
In terms of discovery performance, some regions do better than others. In particular, Canada accounted for 20%
of the exploration expenditures, 13% of the deposits (by number) and 31% of the total ounces. It also accounted
for 27% of the Tier 1 and 2 deposits found. For comparison, Australia accounted for 10% of the spend, found 12%
of the primary gold deposits (by number) but only 4% of the total ounces and 11% of the Tier 1 and 2 deposits.
Higher gold prices have impacted on the exploration sector in a number of other ways.
One benefit is that higher prices enabled companies to economically mine lower grade deposits/lower grade
ore in existing operations. The associated lower cut-off grade helped grow the resource base. An analysis of the
tonnes-grade characteristics of 45 deposits found that gold-rich porphyry-style deposits became relatively more
attractive (than orogenic- or epithermal-style deposits) under high prices. However, the reverse applied in periods
of low prices.
The recent run-up (and subsequent collapse) in gold prices has affected the size of deposits reported. A study of
50 undeveloped gold deposits containing a resource larger than 1 moz (and a resource date post-January 2012)
found that the owners used a diverse range of price for calculating the resource. These varied from $800/oz and
$2,000/oz, with an average of $1,333/oz. The author estimates that doubling the cut-off grade (which is the same
as halving the gold price) halves the amount of ounces reported.
As a result, the study raises a number of serious risks for investors:
• Firstly, 24% of the resource statements contained no information on the gold price used.
• Secondly, the wide range of prices used mean that, depending on the company and the study date, a
MinEx Consulting Pty Ltd NewGenGold 2013 Page 137GOLD EXPLORATION OUTLOOK
deposit could end up with much bigger or smaller resource than that reported.
• Finally, in a period of low prices and limited funding, there is a real risk that junior explorers may go into
hibernation. As a result, the deposit’s resource figure may not get updated especially if the new number
is likely to be smaller than the old. The end-result is that the deposit becomes a “zombie” where the
reported resource figure bears no resemblance to its real size or value.
It is fair to say that the industry faces a number of severe challenges and will need to develop appropriate business
strategies to remain competitive. Using the Porter model of the value-chain, the three generic (and mutually-ex-
clusive) approaches are cost leadership strategy, differentiation strategy or (for niche players) a focused strategy.
In conclusion, the author’s experience is that unit discovery costs fall during the down-cycle. This is the combined
result of lower input costs, better quality projects and weeding-out of weaker projects and companies. Ironically,
given the long lead times between discovery and development, now is good time to invest in exploration. The chal-
lenge, as always, is to convince your financial backers that this really is the case and that you have a great set of
projects and a strong team to make it happen.
Some things never change.
Appendix A: Tier Definitions
The reader should be cautioned that there are no industry-agreed set of rules regarding the definition of a Tier 1,
2, 3 or 4 discovery. The following are the working definitions used by MinEx Consulting to assess their “quality”:
• Tier 1 deposits are “Company making” mines. They are large, long life and low cost.
Using long run commodity prices it generates >$300-600m pa of revenue (i.e. >200 ktpa Cu or >800
kt Zn+Pb or >5ktpa of U3O8 or >250 kozpa Au) for >20 years and is in the bottom quartile of the cost
curve. The project has very robust economics and will be developed irrespective of where we currently
are in the business cycle and whether the deposit has been fully drilled out. The resource is of a size/
quality that it creates multiple opportunities for expansion.
As at January 2013, Tier 1 deposits have a risk-adjusted NPV at the Decision-to-Build Stage of
>US$1000m, as based on forecast long-run commodity prices.
• Tier 2 deposits are “Significant” deposits - but are not quite as large or long life or as profitable as Tier
1 deposits. I.e., it only meets some of the Tier 1 criteria.
Typically Tier 2 deposits are profitable in all but the bottom of the business-cycle. However, they have
limited “optionality” because of modest size and mine life.
It is noted that, over time, through additional delineation and/or changes in costs or business risk some
Tier 2 deposits may ultimately become Tier 1 deposits.
As at January 2013, Tier 2 deposits have a risk-adjusted NPV at the Decision-to-Build Stage of US$200
- $1000m.
• Tier 3 deposits are small / marginal deposits (most deposits found fall into this category) While they can
be profitable – at best they don’t meet more than one of the Tier 1 or 2 criteria.
Typically these projects only get developed during the top of the business cycle and/or developed only
if they are satellite operations to an existing business (i.e. they would never be developed as a stand-
alone mine).
As at January 2013, Tier 3 deposits have a risk-adjusted NPV at the Decision-to-Build Stage of US$0 -
$200m
• Tier 4 deposits are uneconomic deposits. Using long run price forecasts, the deposit has a negative
NPV at the decision-to-build stage and is unlikely to be developed (even at the top of the business cycle).
As a general rule the above classifications only apply to deposits that “Major” (or larger) in size, where “Major”
is defined as deposits containing a pre-mined resource >1 Moz Au, >1 Mt Cu-eq, > 100kt Ni, >2.5 Mt Zn+Pb,
>50Moz Ag, or >25 kt U3O8. The author recognizes that this may overlook the value of discovering a small but
very high grade deposit.
Page 138 NewGenGold 2013 MinEx Consulting Pty LtdReferences
ABS, “Mineral and Petroleum Exploration: Australia”, 8412.0, various years published by the Australian Bureau of
Statistics (ABS), Canberra, ACT
Consensus Economics, “Energy & Metals Consensus Forecasts”, 17 June 2013, as published by Consensus
Economics Inc., London [access by paid-subscription only]
Doggett, M. and Mackenzie, B.W. “Economic trends in Canadian gold supply”, 1987, Working paper published by
the Centre for Resource Studies, Queen’s University
Doggett, M. and Mackenzie, B.W. “Worldwide trends in gold exploration”, 1992, Working paper published by the
Centre for Resource Studies, Queen’s University
Mackenzie, B.W., “Economic potential of mineral exploration in Australia: Evidence from the Historical Record –
1955-91”, 1997a, published by Centre for Resource Studies Queen’s University
Mackenzie, B.W., et al. “Economic potential of mineral exploration in Chile: evidence from the historical record”,
1997b, technical paper published by the Centre for Resource Studies, Queen’s University
MOLAR, “China Mineral Resources”, various years published by the Geological Publishing House Beijing, for the
Ministry of Land and Resources, PRC
NRCan, “Overview of Trends in Canadian mineral exploration”, Canadian Intergovernmental Working Group on
the Mineral Industry, various years published by Natural Resources Canada (NRCan), Ottawa, Ontario
PwC, “2013 Global Gold Price Report”, published by the consulting firm PwC, Melbourne, December 2012. p.4.
An electronic copy can be downloaded at:
http://www.pwc.com.au/industry/energy-utilities-mining/publications/gold-price-report.htm
Porter, M.E., “Competitive Strategy: Techniques for Analyzing Industries and Competitors”, 1980 (and republished
with a new introduction in 1998), published by The Free Press, New York
Porter, M.E., “Competitive advantage: creating and Sustaining Superior Performance”, 1985, published by The
Free Press, New York
Schodde, R.C., “Recent trends in gold discovery”, Keynote address to the NewGenGold Conference, Perth, No-
vember 2011. An electronic copy can be downloaded at: http://www.minexconsulting.com/publications/nov2011b.
html
Schodde, R.C., “The Long Term Outlook for the Global Exploration Industry – Gloom or Boom?”. Keynote address
to the Geological Society of South Africa (GSSA) GeoForum 2013 Conference, Johannesburg, July 2013. An
electronic copy can be downloaded at: http://www.minexconsulting.com/publications/jul2013.html
Schreiber, H.W. and Emerson, M.E., “North American Hardrock gold Deposits: an analysis of discovery costs and
Cash Flow potential”, Engineering & Mining Journal, Vol. 185, No.10, 1984, pp50-57
SNL-MEG, “Corporate Exploration Strategies”, annual survey for various years as published by SNL Metals Eco-
nomics Group, Halifax, Nova Scotia [access by paid-subscription only]
Tilton, J.E., Eggert, R.G. and Landsberg, H.H. editors, “World mineral exploration trends and economic issues”,
1988, published by Resources for the Future, Washington DC
Trück, S. and Liang, K. “Modelling and forecasting volatility in the gold market”, Journal of International Banking
and Finance, 2012, Vol. 9, No.1 pp. 48-80.
Wallace, A.R.,”1991 Mineral Exploration Statistics United States and Canadian Companies”, Economic Geology,
Vol.88, 1993, pp.495-504
Wallace, A.R.,”1990 Mineral Exploration Statistics United States and Canadian Companies”, Economic Geology,
Vol.87, 1992, pp.463-468
MinEx Consulting Pty Ltd NewGenGold 2013 Page 139You can also read