The Impact of Language of Instruction in Schools on Student Achievement
←
→
Page content transcription
If your browser does not render page correctly, please read the page content below

Public Disclosure Authorized

 Policy Research Working Paper 9517
Public Disclosure Authorized

 The Impact of Language of Instruction
 in Schools on Student Achievement
 Evidence from Malaysia Using the Synthetic Control
 Method
Public Disclosure Authorized

 Yew Chong Soh
 Ximena V. Del Carpio
 Liang Choon Wang
Public Disclosure Authorized

 Development Economics
 Global Indicators Group
 &
 Poverty and Equity Global Practice
 January 2021

Policy Research Working Paper 9517

 Abstract
 This paper employs the synthetic control method to non-native language throughout a student’s schooling
 examine the impact of using a non-native language as the may have greater negative impact on the student’s learning
 medium of instruction in schools on a student’s learning. than switching the language of instruction in the middle of
 Exploiting an unanticipated policy change in Malaysia and the student’s schooling does. This paper sheds light on the
 using data from the Trends in International Mathematics various manners in which a language policy can adversely
 and Science Studies, the results show that changing the affect a student’s learning outcomes. It also highlights how
 medium of instruction negatively influenced eighth graders’ the transition in switching the language of instruction in
 achievement in mathematics and science. The differential schools can be implemented more effectively to mitigate
 performance, by year and gender, suggests that using a its adverse effects.

 This paper is a product of the Global Indicators Group, Development Economics and the Poverty and Equity Global
 Practice in collaboration with the Department of Economics, Monash University Australia. It is part of a larger effort by
 the World Bank to provide open access to its research and make a contribution to development policy discussions around
 the world. Policy Research Working Papers are also posted on the Web at http://www.worldbank.org/prwp. The authors
 may be contacted at ysoh@worldbank.org, xdelcarpio@worldbank.org, or liang.c.wang@monash.edu.

 The Policy Research Working Paper Series disseminates the findings of work in progress to encourage the exchange of ideas about development
 issues. An objective of the series is to get the findings out quickly, even if the presentations are less than fully polished. The papers carry the
 names of the authors and should be cited accordingly. The findings, interpretations, and conclusions expressed in this paper are entirely those
 of the authors. They do not necessarily represent the views of the International Bank for Reconstruction and Development/World Bank and
 its affiliated organizations, or those of the Executive Directors of the World Bank or the governments they represent.

 Produced by the Research Support Team

The Impact of Language of Instruction in Schools on Student Achievement: Evidence from

 Malaysia Using the Synthetic Control Method *

 Yew Chong Soh*, Ximena V. Del Carpio**, Liang Choon Wang***

 (Word count: 11, 493)

 JEL Classifications: I21, I25, I28, J15

 Keywords: Language of instruction, native tongue, TIMSS, test score, synthetic

 control method

*
 Corresponding Author. Consultant, Enterprise Analysis Unit, DECEA, World Bank. Email: ysoh@worldbank.org
**
 Practice Manager, Poverty & Equity Global Practice, World Bank (Latin America & Caribbean Region).
Email: xdelcarpio@worldbank.org
* **
 Senior Lecturer, Monash University Clayton (Australia). Email: liang.c.wang@monash.edu
Funding details: We do not receive specific funding or grant for this research paper.
Disclose statement: We have no relevant or material financial interests that relate to the research presented in this
paper.
1. Introduction

Since gaining independence, many former colonies have faced the dilemma of whether to continue

using the colonial language or revert to their native language in their educational institutions. For

example, the Philippines, Botswana, Mali, and Malawi maintain the colonial language as the

language of instruction in schools, while Morocco, Tanzania, and Pakistan replaced the colonial

language with their native language as the language of instruction in schools. Depending on how

the change and choice of language of instruction influences a student’s learning, it can have a long-

term impact on the human capital and economic development of a nation given the role of cognitive

skills in economic development (Bishop, 1989; Hanushek & Woessmann, 2008).

 Employing the native language as the language of instruction in a school has both

advantages and disadvantages. As students learn through language, learning in the mother tongue,

especially during the first years of formal schooling, may help a student improve their cognitive

skills in numeracy and problem-solving (Cummins, 1994). When a student learns in the language

they command, they enjoy school more and will be more likely to progress to a higher grade

(Eriksson, 2014). Likewise, teachers may also teach more effectively in their native language

(Braine, 2013). However, employing the native language (as opposed to the colonial language) as

the language of instruction in a school may come at a cost given that fluency in the dominant

language used in the local economy may bring better job market outcomes (Angrist and Lavy,

1997; Chiswick, 1991, 1998; Dustmann & van Soest, 2001; Dustmann & Fabri, 2003; Hayfron,

2001). This is especially so in the case of English, where its job market advantages may also be

present in a country in which English is not widely spoken (Ginsburgh and Prieto-Rodriguez, 2010;

Toomet, 2011; Wang et al., 2015).

 2
Estimating the impact of using the native language as the language of instruction on a

student’s cognitive skills is challenging. First, countries that change their language of instruction

in schools typically change it abruptly and apply the new policy to all students. Thus, it is difficult

to differentiate the effect of a switch in the language from the effect of a student learning in their

first or second language, as well as to find a suitable comparison group that is not concurrently

affected to study the impact of the policy change. Second, because many of the language policy

changes across the world occurred decades ago when standardized tests were not widely

conducted, data may not be available for us to study the effect on a student’s cognitive skills. Third,

when the language of instruction is changed, both students and teachers are affected. Even if one

could study the impact of a policy change on test scores, it is difficult to differentiate the effect of

the language change on a student’s ability to learn, from the effect of the language change on the

quality of a teacher’s instruction.

 This paper exploits a language policy change in Malaysia to study the effect of using non-

native language for instruction in schools on a student’s learning. In particular, we use the synthetic

control method and several waves of data from the Trends in International Mathematics and

Science Studies (TIMSS) to construct a counterfactual sample of Malaysian students and estimate

the effects of a switch, and the use of a non-native language as the language of instruction on

Malaysian eighth graders’ achievement in mathematics and science. The multiple ethnic groups of

students with different mother tongues, the test score variations by gender and subject, as well as

quirks in how the language policy change was applied to different cohorts of students provide us

with a unique setting to differentiate between the effect of switching the language of instruction,

the effect of using a non-native language as the language of instruction, and the effect that teachers

have on a student’s learning by instructing in an unfamiliar language.

 3
In Malaysian schools, the language of instruction for mathematics and science subjects was

abruptly changed from the national language, Bahasa Malaysia (BM), to English, in 2003. Prior to

this change, primary school students learned mathematics and science in BM, Mandarin, or Tamil,

depending on the type of school they attended, while all secondary school students learned

mathematics and science in BM. In the first few years after the policy change (between 2003 and

2008), ethnic Malay students who entered secondary school experienced a switch in the language

of instruction in mathematics and science from their mother-tongue of BM to English, while those

who started primary school for the first time in 2003 or later always learned mathematics and

science in English (their non-mother tongue). During this period, ethnic Chinese and Indian

students who entered secondary school also experienced a switch in the language of instruction

from their mother tongue to English (their non-mother tongue), while those who started primary

school for the first time in 2003 or later, always learned mathematics and science in English. By

2008, all students entering primary and secondary school always learned mathematics and science

in English.

 We show that: (i) mathematics and science test scores were negatively affected by the

switch in the language of instruction as both ethnic Malay and non-ethnic Malay students

performed worse after the medium of instruction was switched from Bahasa Malaysia (BM), the

national language, to English; (ii) students learning mathematics and science in English throughout

their primary and secondary schools performed worse than students switching the language of

instruction from their native language to English between primary and secondary schools; (iii)

boys, who typically have poorer command of languages, were negatively affected even more so

than girls. Our results imply that students do not learn well in a non-native language.

 4
Our findings shed light on the effects of language of instruction on schooling and labor

market outcomes previously documented in the literature. As previous findings on the impact of

language of instruction change are mixed, our findings offer a way to reconcile them. For example,

Angrist and Lavy (1997) found that when Arabic (the native language), replaced French (the

colonial language), as the language of instruction in Moroccan schools, their students’ French

language skills and mathematics performance worsened significantly, resulting in lower rates of

return to their schooling. Using the Puerto Rican language reform in 1949, Angrist, Chin and

Godoy (2008), found that Spanish-only schooling did not affect the English proficiency of Puerto

Ricans. Eriksson (2014), on the other hand, found that an increase in the years spent learning in

the mother tongue positively influenced literacy rates, educational attainment, and the wages of

South Africans. Our results indicate that previous findings possibly identify: (i) the impact on a

student of switching the language of instruction in the middle of the student’s schooling, rather

than the impact of using a native language versus that of using a non-native language; and (ii) the

impact of the language policy change on the quality of a teacher’s instruction. Our results also

have policy implications for the cognitive skill development of immigrant children who do not

speak the language of instruction in school.

2. Background

In Malaysia, primary schools (Standard 1 to Standard 6) are generally attended by students

between ages of 6 and 12 years. After graduating from primary schools, these students move into

secondary schools (Form 1 to Form 5). Standard 1 corresponds to grade 1, while Form 1

corresponds to grade 7 in most other countries.

 5
Prior to gaining independence, primary schools in Malaysia were divided into two types

of schools with four different languages of instruction. Bahasa Malaysia (BM) was used as the

sole language of instruction in “National” primary schools, while English, Mandarin or Tamil

was used in “National-type” primary schools. For instance, if a school was a Chinese National-

type school, Mandarin would be the primary language of instruction. Secondary school students,

however, were instructed in BM if they are enrolled in national schools or in English if they are

enrolled in national-type schools. For the period 1970-2010, the ethnic distribution of Malaysian

population is roughly 58% Bumiputera (Malay and other indigenous groups), 28% Chinese, and

8% Indian (Mahari, 2011).

 In July 1969, almost 12 years after Malaya gained independence and 6 years after the

forming of Malaysia, the Malaysian government announced that English National-type schools

would phase out in Malaysia. This process began in January 1970 and by 1985, all English

National-type schools became National schools. However, as Chinese and Indian (Tamil)

vernacular primary schools exclusively catered to Chinese and Indian (Tamil) students,

respectively, they were exempted from this regulation. Ultimately, only the English National-type

primary schools and all secondary schools were affected.

 On July 19, 2002, the decision to implement a BM-English mixed language of instruction

policy was made following the Special Meeting of the Municipal of Ministry (Mohandhas, 2015).

It was then announced formally two days later that beginning in 2003, English would become the

language of instruction in mathematics and science subjects in Standard 1 and Form 1, while BM

would remain as the language of instruction in other non-language subjects. This new policy is

commonly known by its acronym in BM, PPSMI (Pengajaran dan Pembelajaran Sains dan

Matematik dalam Bahasa Inggeris), which translates to “Teaching and Learning of Science and

 6
Mathematics in English.” The switch in policy is essentially an effort in meeting Malaysia’s

ambition to achieve the status of a developed nation. The then prime minister of Malaysia, Tun

Seri Dr. Mahathir Mohammad, was convinced that the introduction of English as the language of

instruction in the teaching of mathematics and science would arrest the declining English

proficiency among Malaysian students and help the country’s technological advancement (Cheah

and Mostafa, 2009).

 One of the main concerns arising from the implementation of the policy is the inability of

most Malaysian teachers to teach in English as they lack the level of competency in English. Most

of the teachers are products of the 1970s education policy; they were instructed in BM with English

only taught as a second language. To overcome the lack of English competency among teachers

teaching mathematics and science, the government took various actions: a) preparation of

multimedia teaching courseware to facilitate teaching and learning of the subjects using

information and communication technology (ICT), and b) teachers were sent for short-term in-

service courses to improve their competency in English as well as equip them with the necessary

skills to handle ICT. There were strong reservations over the effectiveness of these short-term in-

service courses in enhancing the skills of the teachers as the training of teachers to teach in a second

language requires more than linguistic skills as it involves a host of other issues related to teaching

through a second language (Tan and Raman, 2007).

 In July 2009, a new policy was announced whereby effective in 2012, BM would again

replace English as the language of instruction in the teaching of mathematics and science. With

this new policy, mathematics and science subjects would be taught in BM instead of English

beginning in 2012 in Standard 1 and Form 1. This policy is known by its acronym in BM,

MBMMBI (Memartabatkan Bahasa Malaysia Memperkukuh Bahasa Inggeris), which means

 7
“Upholding the Malay Language and Strengthening the Command of English.” Although English

would now only be learned as a second language, more emphasis would be placed on building

students’ English language skills by hiring retired teachers, employing additional assistant teachers

for larger classes, and having extra class hours (Chapman, 2009). Table 1 summarizes the multiple

shifts in the language of instruction policies in Malaysia over the past few decades.

 In this paper, we focus on the shift in the language of instruction policy in 2003 to gauge

its impact on the mathematics and science test scores of Malaysian students. Prior to the

implementation of PPSMI, students learned mathematics and science in BM, Mandarin or Tamil

– depending on the type of primary schools they attend – and when they progressed to secondary

schools, they learned the two subjects in BM. With the implementation of PPSMI, students

entering primary schools for the first time since 2003 had to learn the two subjects in English

regardless of the types of primary schools they attend. Similarly, students progressing to secondary

schools from 2003 onwards also had to learn the two subjects in English. On the other hand,

students who had already started their primary or secondary schools prior to 2003 were not affected

by the policy change. How PPSMI was applied to different types of schools and levels of education

is summarized in Table 2.

 Since students sort into different types of primary schools based on their ethnicity, the pre-

PPSMI language of instruction in a primary school and a student’s ethnicity are highly related.

National primary schools enroll mostly ethnic Malay students, Chinese National-type primary

schools enroll mostly ethnic Chinese students, while Indian National-type primary schools enroll

mostly ethnic Indian students. 1 Nonetheless, a sizable number of ethnic Chinese (8%) and Indian

1
 According to the Ministry of Education of Malaysia’s (2012) statistics for 2000, 98% of ethnic Malay primary school
students enrolled in a National school, 92% of ethnic Chinese primary school students enrolled in a Chinese National-
type school, and 49% of ethnic Indian students enrolled in a Tamil National-type school.

 8
(47%) students also attend National primary schools. Thus, prior to 2003, ethnic Malay students

were instructed in BM, ethnic Chinese students were instructed in Mandarin, and ethnic Indian

students were instructed in Tamil in their primary education. Because of the way that PPSMI was

applied to different cohorts of students, levels of schools, and types of schools, there are variations

in the languages of instruction in mathematics and science across student cohorts and ethnic

groups. Table 3 summarizes the languages in which eighth graders who participated in various

waves of TIMSS learned mathematics and science by school level and ethnic group.

3. Data

We draw data from the Trends in International Mathematics and Science Studies (TIMSS) to

perform the analysis. TIMSS is an international assessment of the mathematics and science

achievement of fourth and eighth grade students. It has been conducted every four years since 1995

with over 50 nations participating in each wave. The data drawn from TIMSS provide participating

students’ test scores along with the background characteristics of these students, their teachers,

and their schools. Similar questionnaires and formal assessments were given to each participating

country to preserve consistency.

 Malaysia has been an active participant of TIMSS since 1999 for the eighth graders’ (Form

2 students in Malaysia) assessments. Therefore, we have data available in 1999, 2003, 2007 and

2011. Eighth graders in 1999 and 2003 were not affected by the language policy change, PPSMI.

On the other hand, eighth graders in 2007 and 2011 were affected by PPSMI. Eighth graders in

2007 are part of the older cohort of students who had to switch their learning language for

mathematics and science subjects from BM, Mandarin or Tamil to English between their primary

and secondary schooling years. On the other hand, eighth graders in 2011 are part of the younger

 9
cohort of students who learned the two subjects in English from the beginning of their schooling

years; this cohort of students never had the chance to learn either subjects in their native language. 2

The availability of the 2007 and 2011 data sets enables us to differentiate the impact of the switch

in the language of instruction and the use of non-native tongue as the language of instruction in

schools respectively.

 Although the data from TIMSS do not provide specific information on a student’s ethnicity,

we can infer whether a student is ethnic Malay or non-ethnic Malay by checking the language

spoken at home. In particular, students who speak the language of test at home are ethnic Malay

and students who do not speak the language of test at home are non-ethnic Malay and we assume

the mother tongue of ethnic Malay students is BM while the mother tongue of non-ethnic Malay

students is neither BM nor English. 3

 Data from other countries are also extracted from TIMSS to serve as the comparison

sample. This sample includes 19 other countries that also participated in the eighth graders’

assessments in 1999, 2003, 2007 and 2011 and did not have any language policy change that

affected participating students during the relevant period. These countries are Australia, Chinese

Taipei, England, Hong Kong SAR, China, Hungary, Indonesia, the Islamic Republic of Iran, Israel,

Italy, Jordan, the Republic of Korea, Lithuania, Morocco, Romania, the Russian Federation,

Singapore, Slovenia, and Tunisia.

 The outcome variables for this study are students’ mathematics and science test scores. We

use a set of correlates of test scores derived from the student, school and teacher background

questionnaires as pre-language-policy-change measures. Because not all questions from the

2
 With the exception of the majority of ethnic Chinese students attending a Chinese National-type school, as they
received supplementary classes with Chinese language as the medium of instruction in mathematics and science
subjects.
3
 Appendix B provides technical details on the robustness of this approach.

 10
questionnaires were consistently answered, we derive only the background questions that were

consistently answered in Malaysia and the 19 comparison countries. 4 These categorical variables

are then coded as dummy variables and measured in percentage form. A full list of the variables

used in the analysis is shown in Table A1 in Appendix A.

4. Conceptual Issues

In this section, we discuss what the differences in test scores across various cohorts, ethnic groups,

genders, and subjects may reveal about the impact of PPSMI.

 The impact on the older cohort of PPSMI-affected students, who participated in TIMSS

2007, embodies: (i) the adjustment cost associated with learning and teaching from the switch in

the language of instruction between primary and secondary education; (ii) the adverse effect on a

student’s ability to learn in their non-native language during secondary education; and (iii) the

adverse effect on a secondary school teacher’s ability to teach in a language they are not well

trained to use. The differences between the Malaysian sample and the counterfactual sample reveal

the average of these three effects.

 The younger cohort of PPSMI-affected students, who participated in TIMSS 2011, learned

the two subjects in English throughout their primary and secondary schools. Thus, the impact on

this younger cohort of students would not include the adjustment cost a student experienced from

switching the language of learning. The impact on the younger cohort of PPSMI-affected students

would thus include: (i) the adverse effect on a student’s ability to learn in their non-mother tongue

throughout primary and secondary education; and (ii) the adverse effect on a teacher’s ability to

4
 The majority of the predictors of test scores are derived from the school background questionnaires. Although this
can potentially pose validity problems, Hanushek (2005) shows that school quality and added school resources play
an important and positive role in determining students’ achievements.

 11
teach in a language they are not well trained to use. Differences between the Malaysian sample

and the counterfactual sample reveal the average of these two effects.

 If the negative impact on the younger cohort of PPSMI-affected students is larger than the

negative impact on the older cohort of PPSMI-affected students, then we have clear evidence that

using a non-native language of instruction is detrimental to a student’s learning in mathematics

and science. It is important to note that we are not able to differentiate between its impact on a

student’s ability to learn and a teacher’s ability to teach.

 The differences between male and female PPSMI-affected students, especially among the

younger cohort, provide evidence on whether using a non-native language is detrimental to a

student’s ability to learn. Since male students tend to have a slower development in language skills

(Gawda and Szepietowska, 2013), they are likely to learn less well when using a non-mother

tongue than female students do. As both male and female students are taught by the same teachers,

the differences between their test scores are likely to be independent of the effect of a teacher’s

ability to teach in an unfamiliar language.

 The difference between a student’s mathematics and science test scores after the

introduction of the PPSMI policy may also provide corroborative evidence on the adverse impact

on a student’s learning of using a non-native language. Specifically, because science curriculum

involves more reading, comprehension, and writing in the language of instruction, the role that

language plays in science is likely stronger than that in mathematics. Thus, we would expect the

negative impact on a student’s performance of using a non-native language to be stronger in

science than in mathematics.

 Finally, the adverse effect of PPSMI on a student’s TIMSS performance is likely to be

more severe for a non-ethnic Malay student than for an ethnic Malay student. TIMSS papers are

 12
always printed in BM. For pre-PPSMI cohort of non-ethnic Malay students, the language of test

and the language of instruction were identical, even though it is not their native language.

However, for PPSMI-affected non-ethnic Malay students, the language of test is different to the

language of instruction, and both are not their native language, making the test more difficult for

them. Thus, we would expect non-ethnic Malay students’ performance in TIMSS to worsen more

than that of ethnic Malay students.

5. Empirical Method

To identify the various effects discussed in the previous section, we compare the differences in

test scores of various groups of Malaysian students with those of various groups of counterfactual

sample students constructed using the synthetic control method (Abadie and Gardeazabal, 2003;

Abadie, Diamond, and Hainmueller, 2010). This approach allows us to compare the test scores for

each group of Malaysian students during post-treatment period with that of a weighted

combination of other non-treated countries chosen to resemble the characteristics of Malaysia in

the pre-treatment period.

 Hence, the test score impact of PPSMI ( ) for student at time is simply the difference

between the test scores of Malaysian students ( ) and the test scores of students at an identical

untreated country ( ):

 = − (1)

 To accomplish unit homogeneity between treated and control countries, synthetic control

method relies on data variation from a pool of donor countries not exposed to treatment. Without

 13
loss of generality, assume that there are donor countries that can be observed for years, and

there are 0 years prior to treatment. Moreover, let = [ 1 , … , ] be vector of non-negative

weights that sum to one, where the components of the vector represent the weights assigned to

each of the donor countries. 5 Choosing a value of creates a counterfactual for the treated

country.

 Abadie and Gardeazabal (2003) suggest a two-step optimization procedure to find the

weights that accomplish unit homogeneity. In particular, their procedure consists in minimizing

the following equation for the treated country:

( 1 − 0 )′ ( 1 − 0 ) (2)

where 1 and 0 are vectors of pre-treatment characteristics of treated and donor countries

respectively; and matrix weights the relative importance of the various characteristics included

in . Abadie and Gardeazabal (2003) solve equation (2) conditional on , which in turns seeks to

minimize the root mean squared prediction error (RMSPE) during pre-treatment period:

 = [ ∑ =1 ∗ ]2 ∈ {1, … , } (3)

 In theory, Abadie and Gardeazabal (2003) show that if the counterfactual resembles closely

a given treated country prior to treatment, then these same weights ( ∗ ) can be used after period

 0 to estimate the treatment effect for the state:

5
 Weights are constrained to positive values between zero and one to avoid extrapolation.

 14
+1 �1 = 1 − ∑ =2 ∗ , ≥ 0 (4) Evidently, Equation (4) resolves in an effect with upward bias if the counterfactual of the treated unit is underestimated, and vice-versa (Abadie, Diamond, and Hainmueller, 2010). In practice, it is hard to find a perfect weight vector such that the RMSPE is exactly equal to zero. 6. Results In this section, we report the effect of PPSMI on test scores, captured by the difference in test scores between Malaysia and its counterfactual sample in the post-PPSMI period. We do so for all Malaysian students regardless of their ethnic background and gender, as well as by gender and ethnic group. It is important to note that since the majority of Malaysian students (approximately 70%) are ethnic Malay who speak BM, the average effects primarily reflect the effects on ethnic Malay students. Before we present the results, we report the weights chosen to construct the counterfactual sample for mathematics test scores and science test scores, respectively. The chosen weights result in a counterfactual sample that best replicates the average value for a set of predictors of Malaysian students’ pre-policy-change test scores. We also perform a series of placebo tests to verify whether the estimated effects for Malaysia are unusually large. 6.1. Average Effects Table 3 shows the weights of each country used to construct the counterfactual Malaysian sample for mathematics and science. The weights reported in the first column in Table 4 indicate that the average values of the predictors of pre-policy-change mathematics test scores are best reproduced by a combination of Chinese Taipei, Hong Kong SAR, China, Israel, Korea, Romania, and Tunisia. 15
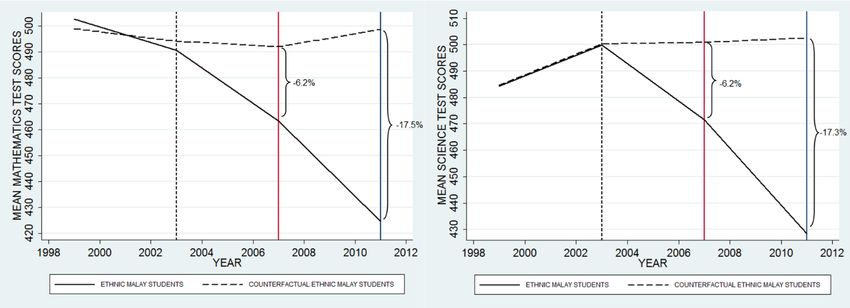
The weights reported in the second column in Table 4 indicate that the average values of the

predictors of pre-policy-change science test scores are best reproduced by a combination of

Chinese Taipei, Hong Kong SAR, China, Indonesia, the Islamic Republic of Iran, Lithuania,

Morocco, Singapore and Tunisia. Note that the weights sum to one. 6 All the other countries in the

donor pool receive a zero weight.

 Table 5 suggests that counterfactual Malaysian students is comparable to actual Malaysian

students in both mathematics and science. The average values of the predictors of test scores are

similar for the pre-PPSMI cohorts (1999-2003). Similarly, Figure 1 displays the mean mathematics

and science test scores trajectory of Malaysian students and its counterfactual for the 1999 – 2011

period. The figure shows that the average mathematics and science test scores of counterfactual

Malaysian students accurately reproduce the average mathematics and science test scores

trajectory of pre-PPSMI Malaysian students (i.e., eighth graders in 1999 and 2003). The close fits

for the predictors of mathematics and science test scores and the pre-policy average mathematics

and science test scores suggest that the counterfactual samples of Malaysian students provide a

sensible approximation. Thus, the counterfactual samples of students would reveal what Malaysian

students would have achieved in 2007 and 2011 in absence of PPSMI.

 Figure 1 also reveals the impact on the mathematics and science test scores of Malaysian

students of PPSMI. Immediately after the implementation of PPSMI in 2003, the performance

trajectories of the pre-PPSMI and the PPSMI-affected cohorts diverge noticeably. The average test

scores of the counterfactual samples are predicted to improve, while the average test scores of

6
 The weights are chosen such that the resulting counterfactual Malaysia minimizes the root mean squared prediction
error (RMSPE). RMSPE measures the lack of fit between the path of the outcome variable for the treated unit and its
counterfactual. RMSPE obtained for the mathematics and science analyses are 0.00566 and 0.00000519 respectively,
indicating that the counterfactual is able to replicate the characteristics of real Malaysia before the policy
implementation with very little error.

 16
Malaysian students declined substantially. The discrepancies in mathematics and science test

scores between the counterfactual sample and Malaysian students grew over time.

 The red vertical line in Figure 1 indicates the older PPSMI-affected cohort of eighth graders

(TIMSS 2007 participants). The estimates show that with the implementation of PPSMI, the

average test scores the older PPSMI-affected cohort of Malaysian students fell by 8.6% in

mathematics and 8.4% in science when compared to the counterfactual sample. This negative

outcome is attributed to the switch in the language of instruction from a native language to a non-

native language between primary and secondary education. The effect contains: (i) the adjustment

cost associated with learning and teaching from the switch in the language of instruction between

primary and secondary education; (ii) the adverse effect on a student’s ability to learn in their non-

native language during secondary education; and (iii) the adverse effect on a secondary school

teacher’s ability to teach in a language they are not well trained to use.

 The blue vertical line in Figure 1 indicates the younger PPSMI-affected cohort of eighth

graders (TIMSS 2011 participants). The estimates show that with the implementation of PPSMI,

the average test scores of the younger PPSMI-affected cohort of Malaysian students fell by 18.6%

in mathematics and 20.6% in science when compared to the counterfactual sample. Since this

younger cohort of students always learned mathematics and science in a non-native language, the

results demonstrate that using a non-native language of instruction is detrimental to a student’s

learning in mathematics and science. The larger negative impact on the younger cohort of PPSM-

affected students than on the older cohort of PPSMI-affected students indicates that the cumulative

negative effects of learning in a non-native language outweigh the negative effects of switching

from using a native language into a non-native language between primary and secondary

education. However, we are unable to differentiate the negative effect on a teacher’s ability to

 17
teach in an unfamiliar language and the negative effect on a student’s ability to learn in a non-

native language based on these differences.

6.2. Effects by Gender

We report the impact on gender differences in this subsection, which provide evidence on whether

the negative impact of using a non-native language captures its adverse effect on a student’s ability

to learn in addition to its adverse effect on a teacher’s ability to teach in an unfamiliar language.

Specifically, because both genders are taught by the same teachers, while male students have

poorer language skills than female students do, the differences between their test scores are likely

to be independent of the effect of a teacher’s ability to teach in an unfamiliar language.

 We report the weights chosen to construct the counterfactual sample of students and the

comparisons of average values of predictors of pre-PPSMI test scores in Appendix A. 7 Figure 2

shows the trajectories of the average mathematics and science test scores of male students and

their counterfactual. Figure 3 shows the trajectories of the average mathematics and science test

scores of female students and their counterfactual.

 In both Figure 2 and Figure 3, the red vertical line indicates the older cohort of PPSMI-

affected students while the blue vertical line indicates the younger cohort of PPSMI-affected

students. Male students suffered a larger decline in test scores than female students did in both

mathematics and science. The decline in test scores exacerbated over time. A male student who

switched from learning in a native language to learning in a non-native language between their

primary and secondary education did much worse than a female student did. This gender difference

worsened for the younger cohort of PPSMI-affected students. The gender gaps widened from

7
 The counterfactual sample is similar to the Malaysian sample. RMSPE in mathematics is 0.22 for male students and
4.28 for female students. RMSPE in science is 0.000000324 for male students and 0.00000195 for female students.

 18
roughly 1% to 3% in mathematics and roughly 4% to 7% in science. Thus, learning mathematics

and science in a non-native language throughout their primary and secondary education is more

detrimental to male students than female students. Since male and female students face the same

teachers and male students likely have poorer language skills, the results indicate that using a non-

native language as the language of instruction inhibits students’ ability to learn mathematics and

science.

 It is also worth noting that female students always outperformed male students in

mathematics throughout the pre-PPSMI and PPSMI periods. However, male students

outperformed female students in science before the implementation of PPSMI, but the gender

performance gap reversed after the implementation of PPSMI.

6.3. Effects by Ethnic Group

We examine the impact of PPSMI by ethnic group to show whether PPSMI affected non-ethnic

Malay students more negatively. As these students must answer the test papers printed in BM,

while they learned mathematics and science using English, neither of which is their native

language, we expect the negative effects on them to be larger.

 We report the weights chosen to construct the counterfactual sample of students and the

comparisons of average values of predictors of pre-PPSMI test scores in Appendix A. 8 Figure 4

shows the trajectories of the average mathematics and science test scores of ethnic Malay students

and their counterfactual. Figure 5 shows the trajectories of the average mathematics and science

test scores of non-ethnic Malay students and their counterfactual.

8
 The counterfactual sample is similar to the Malaysian sample. RMSPE in mathematics is 3.67 for ethnic Malay
students and 4.94 for non-ethnic Malay students. RMSPE in science is 0.0000247 for ethnic Malay students and
0.00089 for non-ethnic Malay students.

 19
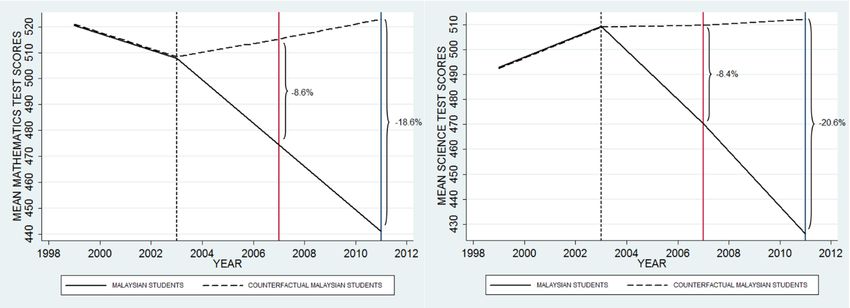
In both Figure 4 and Figure 5, the red vertical line indicates the older cohort of PPSMI-

affected students while the blue vertical line indicates the younger cohort of PPSMI-affected

students. The changes in an ethnic Malay student’s mathematics and science test scores shown in

Figure 4 are fairly similar to the changes in an average Malaysian student’s mathematics and

science test scores shown in Figure 1. This similarity is not too surprising given that ethnic Malay

students account for roughly two-thirds of the sample. Comparing Figure 4 and Figure 5, we can

see that non-ethnic Malay students suffered a larger decline in test scores than ethnic Malay

students did in both mathematics and science. For example, the average reduction in science test

scores is 9.8% for the older cohort of PPSMI-affected non-ethnic Malay students whereas it is

6.2% for the older cohort of PPSMI-affected ethnic Malay students. The extra reduction is

consistent with the interpretation that a non-ethnic Malay student’s performance in TIMSS was

more affected by the difference in the language of the test and the language of instruction.

 It is also worth noting that ethnic Malay students always performed worse than non-ethnic

Malay students in mathematics throughout the pre-PPSMI and PPSMI periods. In contrast, non-

ethnic Malay students outperformed ethnic Malay students in science before the implementation

of PPSMI, but the ethnic performance gap reversed after the implementation of PPSMI.

6.4. Placebo Tests

To evaluate the statistical significance of the estimates, we follow Abadie, Diamond and

Hainmueller’s (2010) method by running a set of placebo tests in which we assume the language

policy hypothetically occurred in one of the countries in the donor pool and apply the synthetic

control method to estimate the impact of this hypothetical language policy. If the placebo test

generates an average test-score gap in the placebo-treatment country with a magnitude similar to

 20
the one estimated for Malaysia, then the estimated impact of PPSMI is interpreted as not

statistically significant. That is, the estimated effect of the intervention in Malaysia is as large as

that in a place that did not receive the intervention. If, on the other hand, the placebo test shows an

average test-score gap in the placebo-treatment country much smaller than the one estimated for

Malaysia, then the estimated impact of PPSMI is interpreted as statistically significant.

 We iteratively apply the synthetic control method to estimate the impact of the placebo

policy in every country in the donor pool. In each iteration, we reassign the hypothetical

intervention to one of the 19 donor countries, and shift the respective Malaysian sample into the

donor pool. In constructing the counterfactual samples, we use comparison countries that provide

a good fit to the placebo-treatment country. Specifically, we include only comparison countries

with pre-policy characteristics that yields a RMSPE of the predicted value of pre-policy test score

that is similar to the RMSPE of the predicted value of pre-policy test score for Malaysia. 9 We

perform the procedures separately for mathematics test scores and science test scores, as well as

for different gender and ethnic groups. We then compute the estimated effect associated with each

placebo test. This iterative procedure provides us with a distribution of estimated average post-

policy test-score gaps for countries where no intervention took place.

 Figure 6 and Figure 7 display the results for the placebo tests for average mathematics and

science test scores, respectively. Each grey bar indicates the estimated effect of the hypothetical

intervention in a placebo country. It shows the percentage difference in average test scores between

the placebo-treatment country and its counterfactual. Since the RMSPEs of the predicted values of

pre-policy test scores for the average Malaysian sample are within 1, we report only countries with

9
 The counterfactuals for the placebo-treatment countries may not be able to replicate their pre-policy characteristics
as accurately as the counterfactuals did for Malaysia. To ensure comparability, we consider only placebo-treatment
countries with counterfactuals that yield RMSPE of similar or lower values than that of Malaysia.

 21
a counterfactual sample that generates RMSPEs in the predicted values of pre-policy test scores

that are also within 1. We also report the estimated effect for Malaysia, indicating by the red bar.

As the figures make apparent, the estimated average test-score gaps for Malaysia are more than

three times of those for the placebo countries. Thus, the estimated effects for Malaysia are

statistically significant.

 Figure 8 and Figure 9 depict the placebo test results for mathematics and science test scores

of male students, respectively, whereas Figure 10 and Figure 11 depict the placebo test results for

mathematics and science test scores of female students, respectively. With the exception of female

students’ mathematics scores, we report placebo countries with a counterfactual sample that

generates a RMSPE of the predicted value of pre-policy test score that is less than 1. Since the

RMSPE of the predicted value of Malaysian female students’ mathematics test scores is 4.28, we

report only placebo countries with a counterfactual sample that generates a RMSPE of the

predicted value of mathematics test score that is less than 5, in Figure 10. Again, as these four

figures make apparent, the estimated effects on the post-policy test score gaps, especially for the

younger cohort of PPSMI-affected students, are unusually large.

 Figures 12 to 15 depict the placebo test results of the mathematics and science test scores

of various ethnic groups. To be consistent with the RMSPE s of the predictor values of pre-policy

test scores for the various Malaysian samples, we report placebo countries with a counterfactual

sample that generates a RMSPE of the predicted value of pre-policy test score that is less than 5

in the case of mathematics and less than 1 in the case of science. Overall, the estimated effects for

Malaysian students, especially the younger cohort of PPSMI-affected students, are considerably

larger than those for students in the placebo countries.

 22
6.5. Discussion

Some of the current findings are consistent with previous findings in the literature, while some

other ones appear to be contradictory. Angrist and Lavy (2007) showed that when Moroccan

students performed worse when they switched from learning in French, a non-native language,

into learning in Arabic, their native language, between primary and secondary schools, relative to

Moroccan students who learned in French throughout primary and secondary schools. In contrast,

Eriksson (2014) showed that South African students who received more years of instruction in

their native language performed better than whose who received fewer years of instruction in their

native language before the language of instruction switched to a non-native language. How to

reconcile the current findings with the previously mixed findings in the literature?

 The current findings that the older cohort of PPSMI-affected students, especially among

ethnic Malay students, performed worse when they switched the language of instruction between

primary and secondary schools are consistent with Angrist and Lavy’s (2007) finding that

changing the language of instruction between primary and secondary education had an adverse

impact on a student. Similarly, the current findings that the pre-policy cohort of students performed

better than the older cohort of PPSMI-affected students, and older cohort of PPSMI-affected

students performed better than the younger cohort of PPSMI-affected students are consistent with

Eriksson’s (2014) finding that more years of instruction in a native language was beneficial to

students.

 The seemingly contradictory findings are that Angrist and Lavy’s (2007) results imply that

using a non-native language throughout primary and secondary schools is beneficial, whereas our

results indicate that using a native language throughout primary and secondary schools is

beneficial. The likely explanation for this apparent contradiction rests in how language policy

 23
change may influence a teacher’s ability to teach. In the case of Morocco, as a result of the

language policy change from French (colonial language) to Arabic (native language), a teacher is

required to switch from teaching in French to teaching in Arabic. While Arabic is the native

language for most Moroccan students and teachers, it is not the language in which teachers are

accustomed to teaching. In the same vein, the language policy change in Malaysia required a

teacher to switch from teaching in BM to teaching in English, a language they were not accustomed

to use in their teaching. This adverse impact of teaching in a “new” language on a teacher’s ability

to teach was well documented by Ong and Tan (2008). It is plausible that the adverse impact on

teacher quality together with the adverse impact on a student’s ability to learn of changing the

language of instruction in Morocco outweighed the positive impact on a student’s ability to learn

in their native language of Arabic. This explanation is also consistent with why Eriksson (2014)

found that the net impact on a student’s learning was positive when the years of instruction in a

native language increased in South Africa. In particular, because South African teachers were

already instructing in their native language when they experienced a change in the language policy,

the increase in the years of native-language instruction did not impede their ability to teach in the

native language.

 Lastly, although our results do not indicate how large the role that the language policy

change had on a student’s ability to learn versus the role that it had on a teacher’s ability to teach,

the differences in performance across genders, subjects, and PPSMI-affected cohorts indicate that

the role it had on a student’s ability to learn is evident.

 24
7. Conclusion

This paper exploits the quirks in the changes of the language of instruction introduced in 2003 in

Malaysia to estimate its effects on students’ mathematics and science test scores. By comparing

the performance of Malaysian students by year, gender, and ethnic group, with respect to that of a

set of counterfactual units constructed on the basis of the synthetic control method, we show that:

(i) changing the language of instruction from a native language to a non-native language in the

middle of a student’s schooling negatively affected their learning; (ii) using a non-native language

as the language of instruction throughout a student’s schooling is more detrimental to a student’s

learning than switching the language of instruction from a native language to a non-native

language in the middle of the student’s schooling; (iii) the negative effect of using a non-native

language on a student’s ability to learn plays an important role in explaining the adverse impact of

the language policy change. Although we are not able to quantify the extent to which changing the

language of instruction negatively affected a teacher’s ability to teach, findings from other studies

indicate that the adverse effect of changing the language of instruction on a teacher’s ability to

teach is likely not negligible.

 Our findings have significant policy implications on the use of language policy to improve

human capital development. It is in the best of interest of a student’s learning to use their native

language as the language of instruction in school, especially at the primary and lower secondary

school levels. However, if a country is considering changing the language of instruction in schools

from a non-native language to a native language, it must anticipate its potential adverse impact on

the quality of teachers. The adjustment cost on existing teachers who have been accustomed to

teaching in a non-native language and the negative effect of using new teachers who have received

 25
training in the native language may outweigh the benefit for students to learn in their native

language.

 26
References
Abadie, Alberto, Alexis Diamond, and Jens Hainmueller. 2010. “Synthetic Control Methods for

Comparative Case Studies: Estimating the Effect of California’s Tobacco Control Programs.”

Journal of American Statistical Association 105 (490): 493-505.

Abadie, Alberto, and Javier Gardeazabal. 2003. “The Economic Costs of Conflict: A Case Study

of the Basque Country.” American Economic Review 93 (1): 113-132.

Angrist, Joshua D., and Victor Lavy. 1997. “The Effect of a Change in the Language of Instruction

on the Returns to Schooling in Morocco.” Journal of Labor Economics 15 (1): 48-76.

Angrist, Joshua D., Aimee Chin, and Ricardo Godoy. 2008. “Is Spanish-only Schooling

Responsible for the Puerto Rican Language Gap?” Journal of Development Economic 85 (1): 105-

128.

Bishop, John H. 1989. “Is the Test Score Decline Responsible for the Productivity Growth

Decline?” American Economic Review 79 (1): 178-197.

Braine, George. 2013. Non-Native Educators in English Language Teaching. New York:

Routledge.

Chapman, Karen. 2009. “It Is Bahasa Again but More Emphasis Will Be Placed On Learning

English.” The Star Online, July 9.

Cheah, Li Na, and Nor Azmi Mostafa. 2009. “Teacher Beliefs and the Teaching of Mathematics

and Science in English.” English Language Journal 3: 83-101.

Chiswick, Barry R.. 1991. “Speaking, Reading and Earnings Among Low-Skilled Immigrants.”

Journal of Labor Economics 9 (2): 149–170.

 27
Chiswick, Barry R.. 1998. “Hebrew Language Usage: Determinants and Effects On Earnings

Among Immigrants In Israel.” Journal of Population Economics 11 (2): 253–271.

Cummins, James. 1994. “Primary Language Instruction And The Education of Language Minority

Students.” Schooling and language minority students: A theoretical framework 2: 3-46.

Dustmann, Christian, and Francesca Fabbri. 2003. “Language Proficiency and Labour Market

Performance of Immigrants in the UK.” Economic Journal 113 (Jul): 695-717.

Dustmann, Christian, and Arthur van Soest. 2001. “Language fluency and earnings: Estimation

with misclassified language indicators.” Review of Economics and Statistics 83 (4): 663-670.

Eriksson, Katherine. 2014. “Does The Language of Instruction in Primary School Affect Later

Labour Market Outcomes? Evidence from South Africa.” Economic History of Developing

Regions 29 (2): 1-15.

Gawda, Barbara, and Ewa Malgorzata Szepietowska. 2013. “Semantic and Affective Verbal

Fluency: Sex Differences.” Psychological Reports: Relationships and Communications 113 (1):

246-256.

Ginsburgh, Victor A., and Juan Prietro-Rodriguez. 2010. “Returns to foreign languages of native

workers in the European Union.” Industrial and Labor Relations Review 64 (3): 599-618

Hanushek, Erik. A. 2005. The Economics of School Quality. German Economic Review 6 (3):

269-286.

Hanushek, Erik. A., and Ludger Woessmann. 2008. “The Role of Cognitive Skills in Economic

Development.” Journal of Economic Literature 46 (3): 607-668.

 28
Hayfron, John E. 2001. “Language Training, Language Proficiency and Earnings of Immigrants

in Norway.” Applied Economics 33: 1971-1979.

Mahari, Zarinah. 2011. “Demographic Transition in Malaysia: The Changing Roles of Women.”

Paper presented at Conference of Commonwealth Statisticians, Delhi, February 7-10.

Mohandhas, Pratheepa. 2015. “A Policy Analysis of the Delivery of Primary and Secondary

School Mathematics and Science in English.” Education Research and Perspective 42: 246-285

Ministry of Education Malaysia. 2012. Education Blueprint, 2013 - 2015. Putrajaya.

Ong, Saw Lan, and May Tan. 2008. “Mathematics and Science in English: Teachers Experience

Inside the Classroom.” Jurnal Pendidik dan Pendidikan [Journal of Educators and Education] 23:

141-150.

Tan, Yao Sua, and Santhiram R. Raman. 2007. “Problems and Challenges of Learning Through

A Second Language: The Case of Teaching of Mathematics and Science in English in the

Malaysian Primary Schools.” Kajian Malaysia [Malaysian Research] 25(2): 29-54.

Toomet, Ott. 2011. “Learn English, not the Local Language. Ethnic Russians in the Baltic States.”

American Economic Review 101 (3): 526-531

United Nations Development Report 2004: Cultural Liberty in Today’s Diverse World. 2004. New

York: Oxford University Press.

Wang, Haining, Russell Smyth, and Zhiming Cheng. 2017. “The Economic Returns to Proficiency

in English in China.” China Economic Review, 43 (Apr): 91-104.

 29
Table 1: Language of instruction policy changes in Malaysia
 Years Policy
 Language of instruction in primary schools depended on the type of school
 Pre-1957 (National or National-type), while Bahasa Malaysia (BM) and English were
 the main languages of instruction in government secondary schools.

 The government announced that English National-type schools would be
 phased out beginning in the year 1970. By 1985, all English National-type
 1969 schools would become National schools, where BM was the primary language
 of instruction.

 The announcement of PPSMI – “Teaching and Learning of Science and
 Mathematics in English.” Beginning in year 2003, mathematics and science
 2002
 subjects would be taught in English for students entering Standard 1 and Form
 1 in 2003.

 The announcement of MBMMBI – “Upholding the Malay Language and
 Strengthening the Command of English.” Beginning in year 2012,
 2009 mathematics and science subjects would be instructed in BM for students
 entering Standard 1 and Form 1 in that year.

 The teaching of mathematics and science subjects in English would be
 2017
 completely phased out.

Table 2: The language of instruction in mathematics and science before and after PPSMI
 Pre-PPSMI (before 2003)
 Type of school Language of instruction
 Primary Secondary
 National BM BM
 Chinese Vernacular Mandarin BM
 Indian (Tamil) Vernacular Tamil Not applicable

 PPSMI (2003-2011)
 Type of school Language of instruction
 Primary Secondary
 National English English
 Chinese Vernacular English and Mandarin English
 Indian (Tamil) Vernacular English Not applicable
Notes: There is no Indian vernacular secondary school. Chinese vernacular secondary schools are similar
to National secondary schools with the exception that Chinese language class is a compulsory subject.

 30
You can also read