The impact of vascular risk factors on the thickness and volume of the choroid in AMD patients - Nature
←
→
Page content transcription
If your browser does not render page correctly, please read the page content below
www.nature.com/scientificreports
OPEN The impact of vascular risk factors
on the thickness and volume
of the choroid in AMD patients
Elżbieta Krytkowska1, Aleksandra Grabowicz1, Katarzyna Mozolewska‑Piotrowska1,
Zofia Ulańczyk2*, Krzysztof Safranow3 & Anna Machalińska1*
Disturbances in choroidal microcirculation may lead to the onset and progression of age-related
macular degeneration (AMD). We aimed to assess changes in the choroidal volume and thickness
in the macular region in AMD eyes and to investigate whether coexisting vascular risk factors alter
choroidal status. We enrolled 354 AMD patients (175 dry, 179 wet AMD) and 121 healthy controls.
All participants underwent a complete ophthalmologic examination and assessment of choroidal
thickness and volume. A multivariate analysis adjusted for age, sex, and smoking status revealed
that wet AMD was an independent factor associated with higher average thickness of the central
ring area (ATC) and average volume of the central ring area (AVC) and lower choroidal vascularity
index (CVI) compared to controls (β = + 0.18, p = 0.0007, β = + 0.18, p = 0.0008, respectively) and to
dry AMD (β = + 0.17, p = 0.00003 for both ATC and AVC and β = − 0.30 p < 0.0001 for CVI). ATC, AVC and
average volume (AV) were lower in AMD patients with hypertension and ischaemic heart disease (IHD).
The duration of hypertension was inversely correlated with ATC, AVC and AV (Rs = − 0.13, p < 0.05;
Rs = − 0.12; p < 0.05, Rs = − 0.12; p < 0.05, respectively) while IHD duration negatively correlated with
AV (Rs = − 0.15, p < 0.05). No such associations were observed in the control group. Our findings show
that the choroidal vascular system in eyes with AMD is much more susceptible to damage in the
presence than in the absence of systemic vascular disease.
Age-related macular degeneration (AMD) is a progressive disease leading to a severe decrease in visual acuity1.
Clinically relevant disease is most prevalent in the elderly population, but early signs of AMD can also be found
in individuals under 50 years of a ge2. Despite extensive research, the pathomechanism of this disease has not
been clarified3.
Recently, the role of the choroid in AMD development has been i nvestigated4,5. This research was made pos-
sible by the introduction of the new technique OCT and enhanced depth imaging (EDI-OCT), which provide bet-
ter penetration and visualization of the entire choroid up to the uveal-scleral junction6. OCT allows noninvasive
quantitative assessment of retinal and choroidal structures in vivo. Technological advancements have initiated a
new age of research on the role of choroidal microcirculation in healthy, aged, and diseased eyes7,8. The choroid
is one of the most vascularized tissues in the body. Its main function is supplying oxygen and nutrients to the
outer retina, particularly the foveal avascular zone (FAZ), where the choroid is the exclusive blood source for the
retina. Recently, the choroid was proven to play a role in the pathophysiology of many vision-threatening ocular
disorders, including central serous chorioretinopathy (CSR) and degenerative myopia9–11. Choroid thinning is
a natural process associated with ageing, but some researchers have shown that in eyes with AMD, this process
is much more p ronounced4,12,13. It is likely that the vascular structure of the choroid undergoes the same patho-
logical changes associated with ageing and the development of atherosclerosis as vessels in other r egions12,13.
Previous studies have evaluated changes upon CT in both dry and wet AMD; however, the results have been
inconsistent14. In a study by Jonas et al. that evaluated patients with unilateral AMD, no statistically significant
difference between the affected eyes and contralateral unaffected eyes was observed15. However, Razavi et al.
found CT values to be significantly higher in eyes with neovascular AMD than in unaffected eyes16. Notwith-
standing, most studies have focused on neovascular or atrophic forms of AMD and have shown that the thinning
of the choroid may be a consequence of late-stage disease rather than a cause. A few studies suggested that the
1
First Department of Ophthalmology, Pomeranian Medical University, Al. Powstancow Wlkp. 72, 70‑111 Szczecin,
Poland. 2Department of General Pathology, Pomeranian Medical University, Al. Powstancow Wlkp. 72,
70‑111 Szczecin, Poland. 3Department of Biochemistry and Medical Chemistry, Pomeranian Medical University,
Al. Powstancow Wlkp. 72, 70‑111 Szczecin, Poland. *email: zofia.litwinska@pum.edu.pl; annam@pum.edu.pl
Scientific Reports | (2021) 11:15106 | https://doi.org/10.1038/s41598-021-94676-6 1
Vol.:(0123456789)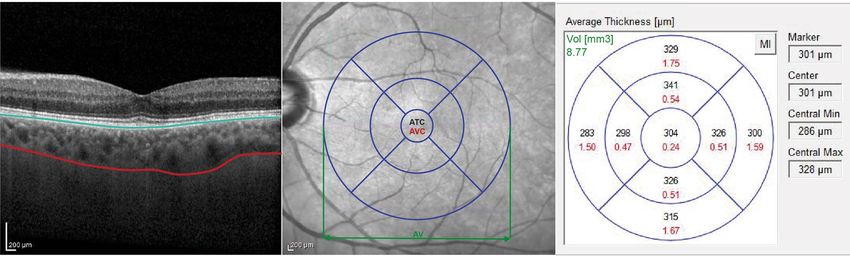
www.nature.com/scientificreports/
thinning of the choroid may originate in the early stages of AMD, although this finding is inconsistent with the
results presented in other s tudies17,18. This discrepancy between studies may be partly due to imperfections in
the subfoveal CT measurement technique. A single manual CT scan in the subfoveal region can lead to biased
results. An analysis of volume based on central 6-mm perifoveal B-scans of the choroid could provide more
precise information about choroidal status, as demonstrated in our previous r esearch19. An additional valuable
parameter recently used in the analysis of choroidal vascularity is the choroidal vascularity index (CVI) obtained
by binarization of OCT i mages20,21. The results of the research indicate that CVI is a parameter with lower vari-
ability and is influenced by fewer physiological factors compared to the thickness of the choroid, therefore it
can be considered a relatively stable parameter for the assessment of changes in choroidal microcirculation20.
CVI values in patients with age related macular degeneration appeared to be significantly lower in patients with
AMD compared to healthy c ontrols22,23. In addition, CVI has been shown to decrease with disease d uration24.
Interestingly, either in the study of Koh et al. or Giannaccare et al. subfoveal choroidal thickness did not differ
between AMD and healthy eyes, while CVI was significantly l ower22,24.
Thus, the aim of the study was to assess choroidal volume, thickness and choroid vascular index changes
for a detailed analysis of choroidal microcirculation in eyes with dry and exudative AMD. We also investigated
whether coexisting vascular risk factors alter the choroidal microvasculature in AMD eyes”.
Methods
Subjects and initial management. Patients with a diagnosis of AMD were enrolled in this study. A
detailed medical and ophthalmological assessment was provided by the First Department of Ophthalmology of
Pomeranian Medical University in Szczecin. We collected data on medical history, current drug use, smoking
status and physical activity status from the enrolled subjects, with a particular focus on their history of clini-
cal cardiovascular diseases, including physician-diagnosed heart and vascular diseases. Before the ophthalmic
examination, arterial blood pressure was measured (three measurements taken at 5-min intervals gave the mean
result) for every participant using a noninvasive blood pressure system with a manual aneroid manometer. Then,
the systemic mean arterial pressure (MAP) was calculated: MAP = diastolic BP + 1/3 (systolic BP − diastolic BP)
mmHg. We also assessed waist circumference [cm], waist/hip ratio (WHR), and body mass index (BMI) [weight
(kg)/height (m)2] of all enrolled subjects. To calculate cumulative pack-years, the reported average number of
cigarettes smoked per day and the number of years the patient smoked were collected. Finally, with the help of
a member of the research team, each participant completed the International Physical Activity Questionnaire
(IPAQ), comprising 7 questions regarding all types of physical activity (lasting 10 min or longer) in the previous
week. Physical activity scores are presented as MET-min per week and were calculated as described previously25.
In brief, each activity-specific factor was multiplied by the number of days spent performing the activity and the
time in minutes spent performing the activity daily. Weekly activity was measured by adding the score for each
of the activities performed.
In accordance with the tenets of the Declaration of Helsinki, a consent form was signed by all patients before
trial enrolment.
Ophthalmologic examination. The patients underwent a complete ophthalmologic examination (biomi-
croscopic examination of the eye anterior and posterior segments, determination of visual acuity, colour fundus
imaging, IOP measurement with a Goldmann applanation tonometer, and axial length and anterior chamber
depth calculation). Only eyes with an axial length within the normal range, i.e. 22–25 mm were included in the
study26. The above mentioned tests were performed to eliminate known factors that interfere with reliable OCT
image analysis. If the presence of a neovascular membrane could not be clearly excluded or confirmed, a fluores-
cence angiography test was performed. Additionally, fundus autofluorescence examination was performed for
more accurate drusen visualization to allow correct determination of the AMD stage.
Optical coherence tomography. Enhanced-depth imaging was performed on both eyes from each sub-
ject using the Heidelberg Spectralis SD OCT (870 nm) device (Heidelberg Engineering, Heidelberg, Germany).
The A-scan rate was 70,000 scans/s, a light source centred on 870 nm was used, and the axial and transverse tis-
sues resolutions were 3.9 and 6 µm, respectively. To exclude confounding factors, measurements were performed
by an experienced technician after 30 min of rest at the same time of the day after pupil dilation with 1% tropi-
camide solution. In addition, the patients were instructed not to smoke for 6 h or drink any fluids for 1 h before
the examination. During scanning, the OCT Spectralis device collected two images using a continuous double
laser scan, including an infrared image from a scanning laser ophthalmoscope (SLO) and an OCT scan. The SLO
images were used as references for the OCT scans. In addition, a system for actively tracking and correcting eye
movements was used. To obtain SD-OCT images of the macular region, a 25° × 25° volume acquisition proto-
col was used to obtain 49 cross-sectional B-scans. Choroidal segmentation was performed manually after the
automated retinal layer segmentation software was disabled. An experienced retina specialist moved the refer-
ence lines of the built-in automated segmentation from the retinal boundaries to the choroidal boundaries. This
method allowed the use of the automatic retinal thickness and volume map features of the built-in software. The
automated software was used to calculate choroidal volume in a similar manner as that used for retinal volume
analysis. The details of obtaining OCT images have been described previously19.
Choroidal volume measurements were made at all points within the 9 Early Treatment Diabetic Retinopathy
Study (ETDRS) subfields, which were automatically provided by Heidelberg Engineering software, were averaged,
and are presented as the AV (average volume). Choroidal thickness and volume measurements from the central
area according to the ETDRS map were calculated as the ATC (average thickness in central ring area) and AVC
(average volume in central ring area) (Fig. 1). For a more precise assessment of choroidal vasculature, we also
Scientific Reports | (2021) 11:15106 | https://doi.org/10.1038/s41598-021-94676-6 2
Vol:.(1234567890)www.nature.com/scientificreports/
Figure 1. Left: enhanced depth imaging-optical coherence tomography (EDI-OCT) scan of macular
region with marked retinal pigment epithelium (blue line) and scleral-uveal junction (red line). Middle:
fundus photography with the Early Treatment Diabetic Retinopathy Study (ETDRS) grid applied. Averaged
measurements from the central ETDRS region are presented as the averaged thickness center (ATC) and to the
average volume center (AVC). Averaged volumetric measurements from the entire area of the ETDRS grid are
presented as average volume (AV). Right: the averaged measurements of choroidal thickness (μm) (marked in
black) and volume (mm3) (marked in red) presented for 9 ETDRS subfields. Values of AV displayed in green.
calculated the choroidal vascularity index (CVI). We used the semi-automated method described previously by
Sonoda et al.27 with later modifications of Agrawal et al.28,29. In brief, EDI OCT scan passing through the subfoveal
region was selected and used for analysis. Images with a poorly demarcated choroidal–scleral interface (CSI)
were excluded from the analysis. Binarization of the choroidal area in that scan was performed using the ImageJ
software (ver. 1.53e; Java 1.8.0_172 (64-bit); https://imagej.nih.gov/ij). The polygon tool was used to select the
region of interest (ROI). Next, the selected region was plotted across the entire length of the EDI OCT scan to
standardize the area of the ROI among all patients. The upper boundary of the ROI was manually traced along
the choroid–RPE junction and the lower boundary along the CSI. Application of auto-threshold was performed
after conversion to eight-bit images. Brightness was reduced to allow clear visualization of the choroidal vessels
and minimize noise. Niblack’s auto local threshold tool was then applied, to allow demarcation of the luminal or
vascular area and the stromal area The image was then converted back to an RGB (red, green, blue) image, and
the luminal area was determined using the colour threshold tool. Across all three different thresholding steps
(auto-threshold, Niblack’s auto local threshold and colour threshold), we used the default standard settings in
the ImageJ plugin that allow us to standardize the thresholding values for all the scans. Choroidal vascularity
index was defined as the proportion of luminal area to the total choroidal area and computed for all images.
Choroidal thickness, volume and CVI measurements were all performed with one grader. Each measurement
was performed three times and averaged. OCT scans in which it was not possible to clearly visualize the choroi-
dal–scleral interface were excluded from the study.
To identify correlations between the stage of the disease and specific systemic and ocular parameters, patients
in the study group were assigned to one of three subgroups depending on the status of the disease. Grading of
AMD based on evaluation of colour fundus images and OCT using the Ferris classification system was per-
formed by the examining c linician21. Group 1 included patients with medium drusen (63–125 μm) but without
pigmentary abnormalities, who were considered to have early AMD. Group 2 patients, who had large drusen or
pigmentary abnormalities associated with at least medium drusen, were considered to have intermediate AMD.
Group 3 included patients with a diagnosis of late-stage AMD including both forms: advanced geographic atro-
phy and macular neovascularization of any type. Patients with no visible drusen or pigmentary abnormalities
and those with small drusen (< 63 μm) were included in the control group because these features are considered
signs of the physiological ageing process.
Patients were diagnosed with the dry subform of AMD when there were drusen, pigmentary abnormalities
and/or atrophic changes, including geographic atrophy found on colour fundus images and OCT. The wet sub-
form of AMD was diagnosed when the existence of the macular neovascular membrane was confirmed by the
presence of intra- and sub-retinal haemorrhages, exudations and/or vascularized PED on colour fundus images,
OCT or a ngiography3. All wet AMD patients enrolled in the study were anti-VEGF treatment naïve”.
Statistical analysis. The Mann–Whitney U test was used to compare quantitative and rank variables
between groups. The strength of associations between quantitative and rank variables was assessed by Spearman
rank correlation coefficients (Rs). Fisher’s exact test was used to compare qualitative variables between groups.
A multivariate general linear regression model (GLM) adjusted for age, gender and smoking status was used to
determine independent factors associated with the thickness and volume of the choroid in AMD patients, trans-
formed logarithmically to normalize their distributions. Standardized β coefficients were calculated to show the
direction and strength of the associations. A p value < 0.05 was considered statistically significant.
Scientific Reports | (2021) 11:15106 | https://doi.org/10.1038/s41598-021-94676-6 3
Vol.:(0123456789)www.nature.com/scientificreports/
Parameter AMD group Control group p value
Number of subjects 354 121 X
Sex (male/female) 135/219 32/89 0.02
Age [years] (mean ± SD) 73.4 ± 8.0 73.1 ± 6.0 0.41
Outdoor/indoor working conditions 40.1/59.9% 33.1/67.0% 0.19
Current smokers [%] 13.6% 6.3% 0.0503
Former smokers [%] 51.4% 30.9% < 0.001
Smoking pack-years [mean ± SD] 13.6 ± 18.9 6.0 ± 13.1 < 0.001
Period without smoking [years] (mean ± SD) 6.8 ± 10.9 5.3 ± 10.2 0.055
BMI [kg/m2] (mean ± SD) 26.9 ± 4.2 26.6 ± 3.7 0.43
WHR [arbitrary units] (mean ± SD) 0.9 ± 0.1 0.9 ± 0.1 0.13
MAP [mmHg] (mean ± SD) 98.3 ± 11.1 98.7 ± 9.7 0.86
Hypertension [%] 64.7% 71.1% 0.27
Duration of hypertension [years] (mean ± SD) 1.2 ± 4.2 9.2 ± 9.9 0.27
History of myocardial infarction [%] 6.2% 6.2% 1
History of ischemic heart disease [%] 16.2% 11.3% 0.33
Duration of ischemic heart disease [years] (mean ± SD) 1.2 ± 4.2 0.8 ± 3.3 0.26
AL [mm] 22.82 ± 1.52 23.13 ± 0.89 0.21
Table 1. Characteristics of the patients in the study groups. Mann–Whitney U test/Fisher’s exact test. Bolded
values indicate significance at p < 0.05.
Parameter Dry AMD group Wet AMD group p value
Number of subjects 175 179 X
Sex (male/female) 52/123 83/96 0.001
Age [years] (mean ± SD) 72.7 ± 8.0 74.1 ± 7.9 0.07
Outdoor/indoor working conditions [%] 38.3/61.7% 41.9/58.1% 0.52
Current smokers [%] 10.6% 16.6% 0.14
Former smokers [%] 45% 57.7% 0.03
Smoking pack-years (mean ± SD) 10.1 ± 16.1 17.0 ± 20.8 0.002
Period without smoking [years] (mean ± SD) 6.3 ± 10.8 7.3 ± 11.0 0.24
BMI [kg/m2] (mean ± SD) 26.9 ± 4.3 26.9 ± 4.2 0.99
WHR [arbitrary units] (mean ± SD) 0.88 ± 0.1 0.91 ± 0.1 0.002
MAP [mmHg] (mean ± SD) 97.1 ± 10.4 99.5 ± 11.7 0.1
Hypertension [%] 65% 64.4% 1.0
Duration of hypertension [years] (mean ± SD) 8.4 ± 9.6 7.9 ± 9.4 0.64
History of myocardial infarction [%] 7.6% 4.9% 0.36
History of ischemic heart disease [%] 15.1% 17.2% 0.65
Duration of ischemic heart disease [years] (mean ± SD) 1.4 ± 4.8 1.1 ± 3.5 0.59
AL [mm] 23.75 ± 0.97 23.12 ± 0.86 0.38
Table 2. Characteristics of the patients in the study groups. Mann–Whitney U test/Fisher’s exact test. Bolded
values indicate significance at p < 0.05.
Ethics approval. The study was conducted according to the guidelines of the Declaration of Helsinki,
and approved by the Ethics Committee of Pomeranian Medical University in Szczecin, Poland (ethical code is
KB-0012/141/13).
Consent to participate. Informed consent was obtained from all subjects involved in the study.
Consent for publication. The manuscript has been read and approved by all named authors.
Results
Study groups characteristics. We enrolled a total of 354 patients with AMD: 175 with dry and 179 with
wet forms of the disease. As a control group, we enrolled 121 healthy subjects. Tables 1 and 2 summarize the
clinical characteristics of the AMD patients (divided into dry and wet subgroups) and the controls. Our study
groups did not differ in age or the occurrence of well-known atherosclerotic risk factors: hypertension, a history
Scientific Reports | (2021) 11:15106 | https://doi.org/10.1038/s41598-021-94676-6 4
Vol:.(1234567890)www.nature.com/scientificreports/
Control Dry AMD Wet AMD p value
Median IQR Median IQR Median IQR (Dry vs. control) (Wet vs. control) (Dry vs. wet)
AV [mm3] 6.96 2.82 6.77 3.55 6.71 2.81 0.641 0.841 0.957
ATC [µm] 273.5 117 269 146 286 161.5 0.907 0.022 0.017
AVC [mm3] 0.21 0.09 0.21 0.11 0.22 0.13 0.937 0.022 0.015
CVI [%] 0.66 0.03 0.65 0.04 0.64 0.05 0.01 < 0.001 < 0.001
Table 3. Differences between choroidal parameters in the dry and wet AMD and control groups. IQR
interquartile range. Statistical significance was established at p < 0.05 (bolded).
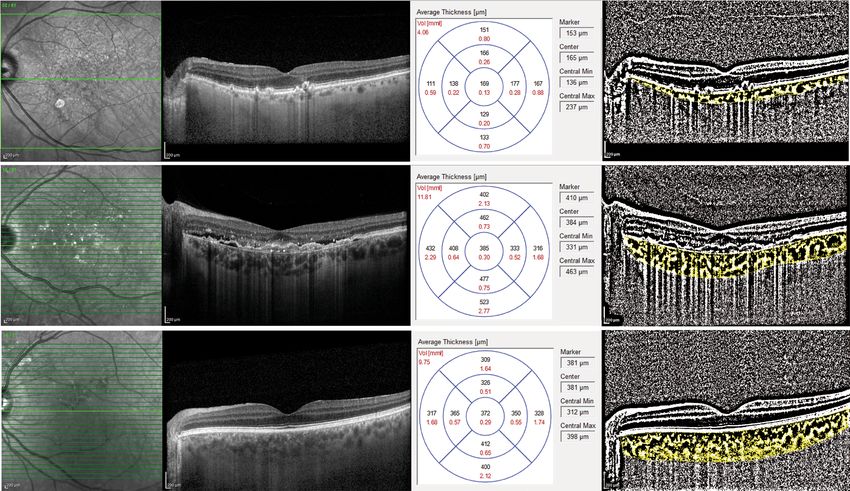
Figure 2. Representative EDI-OCT and CVI scans and averaged measurements of the choroidal thickness and
volume in eyes with dry AMD (top line), wet AMD (middle line) and in healthy eyes (bottom line).
of ischaemic heart disease or myocardial infarction. However, the AMD group had a higher proportion of past
smokers and a longer duration of smoking in pack-years than the controls (p = 0.0004 and p < 0.0001, respec-
tively). We also did not find any correlation between AL and choroidal parameters including AV, ATC, AVC and
CVI in wet (Rs = − 0.21, p = 0.65; Rs = − 0.11, p = 0.82; Rs = − 0.07, p = 0.88; Rs = − 0.03, p = 0.93; respectively),
dry (Rs = − 0.39, p = 0.13, Rs = − 0.36, p = 0.16; Rs = − 0.36, p = 0.16; Rs = − 0.02, p = 0.95; respectively) and con-
trol (Rs = − 0.55, p = 0.1; Rs = − 0.59, p = 0.07; Rs = − 0.6, p = 0.07; Rs = − 0.16, p = 0.68; respectively) study groups.
The proportion of past smokers and the duration of smoking in pack-years were significantly higher in the
wet AMD group than in the dry AMD group (p = 0.03 and p = 0.002, respectively). Furthermore, participants
with dry AMD presented lower WHR values than those with wet AMD, which may have been partially related
to the difference in gender distribution between study groups.
Choroid status in AMD and healthy control eyes. The main outcome of the study was to assess the
differences in choroidal parameters between the dry and wet AMD subgroups and the control group. Table 3
provides the choroidal thickness and eye volume in the three study groups. We found that both the average
thickness and volume in the central ETDRS ring area were significantly higher in wet AMD eyes than in dry
AMD eyes (p = 0.017, p = 0.015, respectively) and control eyes (p = 0.022 and p = 0.022, respectively). Accord-
ingly, CVI values were significantly lower in wet AMD compared to dry subtype of disease, and values recorded
in both AMD subtypes were found to be significantly lower compared to healthy controls”.
Representative choroidal OCT and CVI scans of the patients with exudative AMD and dry AMD are shown
in Fig. 2.
Scientific Reports | (2021) 11:15106 | https://doi.org/10.1038/s41598-021-94676-6 5
Vol.:(0123456789)www.nature.com/scientificreports/
A multivariate analysis of patients and controls adjusted for age, sex, and smoking status (pack-years) revealed
that wet AMD was an independent factor associated with higher ATC, AVC and lower CVI when compared
to controls (β = + 0.18, p = 0.0007, β = + 0.18, p = 0.0008, β = − 0.42 p < 0.0001; respectively) and to dry AMD
(β = + 0.17, p = 0.00003 for both ATC and AVC and β = − 0.30 p < 0.0001 for CVI). The covariate most strongly
associated with ATC and AVC in these analyses was age (β = − 0.32 for wet AMD vs controls, β = − 0.43 for wet
vs dry AMD, p < 0.000001 for both). The wet and dry groups did not differ in terms of average choroidal volume
either between themselves from the control group (p = 0.96, p = 0.64, and p = 0.84, respectively).
In the dry AMD group, choroidal parameters strongly depend on macular morphology and function.
Decreases in total choroidal volume, thickness and volume in the central ETDRS area were all associated with
lower visual acuity (Rs = + 0.14, p < 0.001; Rs = + 0.12, p = 0.002; and Rs = + 0.12, p = 0.002, respectively). Simi-
larly, CVI correlated with visual acuity in AMD group (Rs = + 0.19, p < 0.001). This may indicate that ongoing
atrophy of the choroid in eyes with AMD is associated with a greater degree of functional impairment in the
context of AMD. No such correlations were observed in the control group. Accordingly, in dry AMD group we
observed negative correlations between the stage of the disease and the AV, AVC and ATC (Rs = − 0.18, p = 0.0004;
Rs = − 0.19, p = 0.0002, Rs = − 0.19, p = 0.0003; respectively). Similar association was observed with respect to
CVI (R = − 0.16; p = 0.003). It may indicate that choroidal vascular atrophy appears to be more pronounced in
the later phases of the disease.
Correlations between choroidal parameters and the clinical characteristics of the patients. In
the AMD group, the age of the participants was strongly negatively correlated with both the choroidal thickness
and volume in the central ETDRS area (Rs = − 0.4, p < 0.001, Rs = − 0.4, p < 0.001, respectively) and with the AV
(Rs = − 0.49, p < 0.001). A similar relationship was observed in the control group: the age of participants was
strongly negatively correlated with the ATC (Rs = − 0.22, p < 0.001), the AVC (Rs = − 0.22, p < 0.001) and the AV
(Rs = − 0.45, p < 0.001). In the AMD group, age negatively correlated with CVI (R = − 0.11, p = 0.01), while in the
control group, no statistically significant correlation was observed (R = − 0.006, p = 0.93). The above observa-
tions confirm the fact that choroidal thinning occurs with age and that the process is more severe in patients
with AMD.
Since there is a causative association between vascular diseases and dyslipidemia, we wanted to see if the
concentration of blood lipids in specific fractions affects choroid morphology. In the AMD group, the total
cholesterol level was positively correlated with the average thickness and volume in the central area and with
the total choroidal volume (Rs = 0.14, p = 0.02; Rs = 0.14, p = 0.02; Rs = + 0.16, p = 0.007; respectively). A similar
relationship was shown between all aforementioned choroidal parameters and HDL concentrations (Rs = 0.15,
p = 0.01; Rs = 0.15, p = 0.01; Rs = + 0.15, p = 0.01; respectively). The results suggest that patients with hypercho-
lesterolemia and/or a high HDL concentration have thicker choroids. No such correlations were found in the
control group. There was no correlation between choroidal parameters and blood triglyceride concentration in
any of the studied groups. Interestingly, choroidal parameters did not statistically differ between statin users
and non treated patients.
Because smoking is one of the proven risk factors for the development of vascular diseases, we also evaluated
the effect of smoking on parameters of choroid. We considered the duration of smoking, the time since smoking
cessation for former smokers, the impact of active smoking and the number of smoked cigarettes expressed in
pack-years. Surprisingly, we observed no effect of smoking on measured choroidal parameters in either patients
with AMD or in healthy controls.
Since there is evidence that habitual physical activity significantly decreases the risk of vascular diseases,
we investigated the association between choroidal parameters and regular physical activity. In the AMD group,
physical activity (calculated in MET) appeared to be positively correlated with choroidal thickness and volume
in the central ETDRS subfield (Rs = + 0.13, p = 0.04 and Rs = + 0.12, p = 0.04, respectively) and with the average
volume (Rs = + 0.15, p = 0.009). There were no such relationships in the control group. We also checked whether
obesity affects choroidal parameters and found a negative correlation between CVI and WHR in the AMD group
(Rs = − 0.13, p = 0.008).
Relationship between choroid parameters and systemic vascular diseases. Since available
data suggest that choroidal parameters are dependent on underlying systemic vascular disease, we investigated
the association between choroidal parameters and several systemic risk factors and conditions. We noted that
AMD patients with concurrent vascular diseases had significant reductions in choroidal thickness and volume
(Table 4). In the AMD group, patients with concomitant hypertension had a significantly smaller average cho-
roidal thickness and volume in the central ring area and a significantly smaller total choroidal volume than those
without hypertension (p = 0.001, p = 0.002, and p = 0.003, respectively). Importantly, the duration of hyperten-
sion inversely correlated with both the ATC and AVC (Rs = − 0.13, p = 003; Rs = − 0.12; p = 0.04, respectively)
and with the AV (Rs = − 0.12; p = 0.04) which indicates that AMD patients with longer HA durations had thin-
ner choroids. No such associations were observed in the control group. Subsequently, we assessed the effect
of concurrent IHD on choroidal parameters in AMD patients and found that those with IHD presented a sig-
nificantly smaller central average choroidal thickness, volume and total choroidal volume than patients without
IHD (p = 0.003, p = 0.01, and p = 0.0006, respectively). Accordingly, in the control group, patients with ischaemic
heart disease had significantly lower average choroidal volume parameters than patients without IHD (p = 0.05
for AVC and p = 0.01 for AV). Importantly, negative correlations between IHD duration and the AV were identi-
fied (Rs = − 0.15, p = 0.01), corroborating the observed relationship. Analogous associations regarding a history
of myocardial infarction were observed. In the AMD group, patients with MI had significantly lower AVCs and
ATCs than patients without MI (p = 0.04 and p = 0.05, respectively). No such associations were observed in the
Scientific Reports | (2021) 11:15106 | https://doi.org/10.1038/s41598-021-94676-6 6
Vol:.(1234567890)www.nature.com/scientificreports/
AMD group Control group
H+ H− H+ H−
Hypertension (H) Median (IQR) Median (IQR) p value Median (IQR) Median (IQR) p value
ATC [µm] 256.5 (119.5) 315 (163) 0.001 264 (98.25) 296.7 (109.75) 0.21
AVC [mm3] 0.2 (0.1) 0.25 (0.13) 0.002 0.21 (0.08) 0.24 (0.09) 0.20
AV [mm3] 6.37 (2.85) 6.98 (3.76) 0.003 6.56 (2.84) 7.29 (3.65) 0.15
IHD+ IHD− IHD+ IHD−
Ischemic heart disease (IHD) Median (IQR) Median (IQR) p value Median (IQR) Median (IQR) p value
ATC [µm] 243.25 (89.25) 286 (143) 0.011 238.5 (198.5) 280.5 (93.5) 0.057
AVC [mm3] 0.19 (0.07) 0.23 (0.11) 0.009 0.19 (0.16) 0.22 (0.08) 0.052
AV [mm3] 5.97 (1.63) 6.79 (3.33) 0.003 5.47 (3.99) 6.98 (2.51) 0.010
MI+ MI− MI+ MI−
Myocardial infarction (MI) Median (IQR) Median (IQR) p value Median (IQR) Median (IQR) p value
ATC [µm] 225 (96.5) 281.75 (141) 0.045 248 (79.5) 278 (101.5) 0.49
AVC [mm3] 0.18 (0.08) 0.22 (0.11) 0.042 0.19 (0.07) 0.22 (0.08) 0.14
AV [mm3] 5.81 (1.94) 6.67 (3.16) 0.228 5.86 (2.61) 6.92 (2.91) 0.10
IS+ IS− IS+ IS−
Ischaemic stroke (IS) Median (IQR) Median (IQR) p value Median (IQR) Median (IQR) p value
ATC [µm] 251.75 (51.5) 280.5 (143.75) 0.435 280.5 (174.5) 270.5 (101.5) 0.48
AVC [mm3] 0.2 (0.04) 0.22 (0.11) 0.434 0.22 (0.14) 0.21 (0.08) 0.50
AV [mm3] 5.74 (1.01) 7.14 (3.13) 0.275 6.9 (4.56) 6.86 (2.53) 0.41
LI+ LI− LI+ LI−
Limb ischaemia (LI) Median (IQR) Median (IQR) p value Median (IQR) Median (IQR) p value
ATC [µm] 240.5 (110) 280 (143) 0.587 301.75 (72) 269.5 (121) 0.34
AVC [mm3] 0.19 (0.09) 0.22 (0.11) 0.58 0.24 (0.06) 0.21 (0.1) 0.34
AV [mm3] 5.82 (2.78) 6.64 (3.09) 0.459 6.63 (1.46) 6.92 (2.74) 0.68
Table 4. Differences in choroidal parameters between the AMD group and the control group depending on
the presence of concomitant vascular diseases and vascular risk factors. IQR interquartile range. Statistically
significant differences with p < 0.05 are in bold.
control group. The results show that vascular disorders affect choroidal flow, as indicated by decreased choroidal
thickness and volume, and this phenomenon is much more pronounced in patients with AMD.
Additionally, we checked whether systemic therapy for vascular diseases influences the choroidal structure.
In the AMD group, use of antihypertensive treatment was associated with a lower ATC (hypotensive drug
use: median = 250.75 µm, no hypotensive drug use: median = 320.75 µm, p < 0.001), AVC (hypotensive drug
use: median = 0.2 mm3, no hypotensive drug use: median = 0.25 mm3, p < 0.001) and AV (hypotensive drug
use: median = 6.23 mm3, no hypotensive drug use: median = 7.05 m m3, p < 0.001). A similar relationship was
identified in the eyes of AMD patients using nonsteroidal anti-inflammatory drugs. Both ATC (NSAID use:
median = 244 µm, no NSAID use: median = 287 µm, p = 0.004), AVC (NSAID use: median = 0.19 mm3, no NSAID
use: median = 0.24 mm3, p = 0.003) and AV (NSAID use: median = 5.99 m m3, no NSAID use: median = 6.88 m m3,
p < 0.001) were reduced in patients taking nonsteroidal anti-inflammatory drugs compared to individuals not
receiving such therapy. In contrast, no such differences were found in the control group.
Discussion
Choroidal structure is of particular interest in AMD because abnormalities in choroidal circulation have been
hypothesized to contribute to or even precede the development of A MD5,14. Some studies suggested that AMD
might have a vascular origin, with inadequate choroidal perfusion leading to ischaemia of the retinal pigment
epithelium and subsequent production of VEGF, which can result in the formation of a choroidal neovascular
membrane5,30. This is in line with the results of the current study, which showed that choroidal atrophy increased
with age in AMD patients. The reduction in blood flow in the choroidal vessels observed in AMD eyes may be
the result of accelerated ageing processes. This leads to narrowing of the choriocapillaris lumen, loss of tissue
cellularity, and thinning of the choroid, especially the choriocapillaris l ayer13,31. In the present study, the average
values of choroidal thickness and volume in the central ring area of the ETDRS grid in wet AMD eyes were sig-
nificantly higher than those in both control eyes and dry AMD eyes. Additionally, dry AMD eyes did not exhibit
differences in these parameters compared to healthy control eyes. This finding is in agreement with a study by
Noori et al., who showed that both the mean CT and CV of the subfoveal area in wet AMD eyes were significantly
greater than those in dry AMD and healthy eyes32,33. Similarly, Razavi et al. showed thicker choroids in wet AMD
eyes than in healthy control eyes in the central ring and in all 9 subfields of the ETDRS grid. This result may be
attributed to the presence of oedema, exudation and haemorrhages secondary to the active choroidal neovas-
cular membrane. According to Invernizzi et al., increasing CT in a ctive34 neovascularization was secondary to
an enlargement of choroidal vessel diameters with or without a corresponding increase in vessel density rather
Scientific Reports | (2021) 11:15106 | https://doi.org/10.1038/s41598-021-94676-6 7
Vol.:(0123456789)www.nature.com/scientificreports/
than from tissue thickening secondary to oedema35. This might be the result of elevated levels of intraocular
VEGF, which leads to choroidal vessel dilation, an increase in blood flow and proinflammatory and proedematic
effects36. However, in the presence study, CVI was significantly lower in both AMD study groups compared to the
control group that confirms the presence of vascular atrophy in AMD. Interestingly, unlike choroidal thickness
and volume, the CVI in the wet form of AMD was lower compared to the control group as well as compared
to the dry form of the disease. Since the choroidal vascularity index is derived from the ratio of luminal area to
total choroid area, a decrease in its value may result from either advanced vascular atrophy or an increase in the
volume of all tissue. In the latter case, it may result from the development of the fibrovascular membrane and
inflammatory infiltrates in the extravascular tissue of the choroid in response to the increased concentration of
proinflammatory and proangiogenic mediators, including VEGF. Other studies assessing choroidal thickness in
AMD eyes using OCT imaging have shown mixed results. Chung et al. showed a decrease in choroidal thickness
at four points located 1500 µm nasally, temporally, above and below the foveal centre in both dry and exudative
subtypes of AMD compared to healthy controls37. Similar results were documented by Jonas et al., who showed
that CT at a horizontal distance of 1000 µm from the centre of the fovea was not significantly associated with
any AMD subtype15. It is worth noting that in both studies, point choroidal thickness measurements taken at
certain distances from the centre of the fovea were analysed separately (not averaged). CT measurements limited
to one or even several points provide a very limited indication of choroidal status. Central choroidal thickness
is not, in general, a good predictor of the wider distribution of choroidal thickness on this scale. In contrast, we
assessed the averaged thickness parameter obtained from the central ring of the ETDRS grid, which allows the
evaluation of the area most frequently affected by the disease in the course of AMD. Moreover, we analysed the
average choroidal volume, which allows avoidance of a possible error of a single measurement and errors result-
ing from the physiological difference in the thickness of the choroid in different quadrants, as the lower nasal
sector always presents the lowest value due to the neural tube closure process, while the upper sector, especially
the upper temporal sector, physiologically presents the greatest thickness36.
The current study showed a negative correlation between average choroidal thickness, volume, choroidal
vascularity index and stage of the disease. This indicates a progressive loss of tissue thickness as the disease pro-
gresses. Accordingly, in the current study, there was a strong correlation between choroidal thickness, volume
as well as CVI and visual acuity. Thus, a smaller choroidal thickness was associated with poorer visual function.
Interestingly, Kang et al. found a significant correlation positive between choroidal thickness and visual out-
comes in the eyes of patients with nAMD treated with an intravitreal injection of ranibizumab38. They concluded
that thicker choroids have more potential for recovery due to a relatively preserved choriocapillaris. Similarly,
Metelitsina et al. showed that visual loss was associated with decreased choroidal c irculation39. We would like to
emphasize that this is the first study using averaged choroidal thickness and volume measurements to describe the
state of the choroid in eyes with different AMD subtypes and at subsequent stages of the disease. This approach
provides detailed and reliable information regarding the choroidal parameters of the eyes of AMD patients.
In the present study, we confirmed that concomitant hypertension affected the choroidal microcirculation in
AMD patients, leading to the loss of thickness and volume. This leads to the conclusion that the choroidal tissue
of AMD patients is more prone to injury due to hypertension than those of healthy eyes. Indeed, the thickness
and volume of the choroid in AMD patients in our study was negatively correlated with the duration of hyper-
tension. The results of a study by Ellakwa et al. demonstrated that choroidal thickness was decreased in patients
with systemic arterial hypertension. The authors attributed this finding to the process of arteriolar sclerosis and
vascular contraction caused by high intravascular pressure in the c horoid40. Thus, we conclude that prolonged
elevated systemic blood pressure impairs compensatory mechanisms and leads to decreased choroidal blood
flow, which is followed by ischaemia.
The current evidence suggests that there are multiple similarities between pathogenic mechanisms of AMD
and cardiovascular disease41,42. However, epidemiological studies have not found a consistent association between
AMD and C VD43–46. In the current study, patients with AMD and coexisting ischaemic heart disease had sig-
nificantly lower thickness and volume values than those who did not present CAD. Based on these results, we
conclude that the presence of CVD more strongly affects the choroidal microcirculation in patients with AMD
than in those without macular degeneration. However, the term CVD generally refers to atherosclerotic disease
of medium and large vessels, while the diameter of the choroid is more closely related to the microvessels than to
large-diameter coronary vessels47. Most likely, the results of our study do not show a simple connection between
the two diseases but rather reflect the state of systemic processes associated with biological ageing and other
mechanisms underlying the development of cardiovascular disease and AMD. We found that the choroidal
thickness and volume were all significantly lower in the eyes of AMD patients receiving antihypertensive and
antiplatelet drugs as well as anticoagulants than in the eyes of patients who did not receive such pharmacotherapy.
This may suggest that improvements in blood rheological parameters (platelet function) and a decrease in the
level of systemic blood pressure or refinement of heart function do not reduce the rate of choroid atrophy in
patients with AMD. It is possible that changes in these parameters do not affect the real cause of AMD, which
has not been fully established.
There have been a few studies on changes in choroidal parameters directly after exercises in healthy partici-
pants, but no studies have analysed the influence of habitual physical activity on choroidal parameters in AMD
patients48,49. We showed a significant positive correlation between choroidal thickness and volume and physical
activity in AMD patients, as patients with AMD who reported more intensive physical activity had a thicker
choroid than those with a less active lifestyle. Indeed, an active lifestyle was found to be associated with a lower
risk of AMD in several previous studies, probably due to increased antioxidant enzyme activity and increased
resistance to oxidative stress, which is thought to be one of the key processes in the pathogenesis of AMD50–54.
Because lipids represent at least 40% of the volume of drusen, it can be presumed that lipid metabolism is
involved in the pathogenic mechanism of age-related macular d egeneration55. In this study, plasma levels of
Scientific Reports | (2021) 11:15106 | https://doi.org/10.1038/s41598-021-94676-6 8
Vol:.(1234567890)www.nature.com/scientificreports/
total cholesterol and HDL were positively correlated with choroidal thickness and volume. Wong et al. linked
the occurrence of a thicker choroid in patients with hypercholesterolaemia and the accumulation of lipids in
the suprachoroid region and hypertrophy of endothelial cells and vascular smooth muscle, which was previ-
ously observed in animal m odels56. Interestingly, the use of statins did not appear to adversely affect choroidal
parameters in our study. This may be due to the pleiotropic effects of statins, which at least partially regulate
certain disturbances that contribute to the pathogenesis of AMD.
Conclusions
AMD is a disease with an unexplained pathomechanism; therefore, effective therapeutic and prevention strategies
are still lacking. The results of the current study indicate a relationship between vascular risk factors and choroidal
thinning, which suggests an involvement of the choroid in the pathogenesis of age-related macular degeneration.
Additionally, our findings show that the choroidal vascular system in eyes with AMD is much more susceptible
to damage in the context of coexisting systemic vascular disease. This indicates a double-impact mechanism in
which choroids that are altered due to genetic predisposition and/or as the result of certain pathological processes
become more susceptible than the choroids of non-AMD eyes to progressive damage resulting from ageing and/
or blood circulation disorders.
Data availability
The data that support the findings of this study are available on request from the corresponding author, A.M.
Received: 19 March 2021; Accepted: 29 June 2021
References
1. Lambert, N. G. et al. Risk factors and biomarkers of age-related macular degeneration. Prog. Retin. Eye Res. 54, 64–102. https://
doi.org/10.1016/j.preteyeres.2016.04.003 (2016).
2. Pennington, K. L. & DeAngelis, M. M. Epidemiology of age-related macular degeneration (AMD): Associations with cardiovascular
disease phenotypes and lipid factors. Eye Vis. 3, 34. https://doi.org/10.1186/s40662-016-0063-5 (2016).
3. Al-Zamil, W. M. & Yassin, S. A. Recent developments in age-related macular degeneration: A review. Clin Interv. Aging 12,
1313–1330. https://doi.org/10.2147/cia.s143508 (2017).
4. Farazdaghi, M. K. & Ebrahimi, K. B. Role of the choroid in age-related macular degeneration: A current review. J. Ophthalmic Vis.
Res. 14, 78–87. https://doi.org/10.4103/jovr.jovr_125_18 (2019).
5. Gelfand, B. D. & Ambati, J. A revised hemodynamic theory of age-related macular degeneration. Trends Mol. Med. 22, 656–670.
https://doi.org/10.1016/j.molmed.2016.06.009 (2016).
6. Margolis, R. & Spaide, R. F. A pilot study of enhanced depth imaging optical coherence tomography of the choroid in normal eyes.
Am. J. Ophthalmol. 147, 811–815. https://doi.org/10.1016/j.ajo.2008.12.008 (2009).
7. Sezer, T., Altınışık, M., Koytak, İA. & Özdemir, M. H. The choroid and optical coherence tomography. Turk. J. Ophthalmol. 46,
30–37. https://doi.org/10.4274/tjo.10693 (2016).
8. Bhende, M., Shetty, S., Parthasarathy, M. K. & Ramya, S. Optical coherence tomography: A guide to interpretation of common
macular diseases. Indian J. Ophthalmol. 66, 20–35. https://doi.org/10.4103/ijo.IJO_902_17 (2018).
9. Iacono, P., BattagliaParodi, M., Falcomatà, B. & Bandello, F. Central serous chorioretinopathy treatments: A mini review. Ophthalmic
Res. 55, 76–83. https://doi.org/10.1159/000441502 (2015).
10. Zhang, Y. & Wildsoet, C. F. RPE and choroid mechanisms underlying ocular growth and myopia. Prog. Mol. Biol. Transl. Sci. 134,
221–240. https://doi.org/10.1016/bs.pmbts.2015.06.014 (2015).
11. Mrejen, S. & Spaide, R. F. Optical coherence tomography: Imaging of the choroid and beyond. Surv. Ophthalmol. 58, 387–429.
https://doi.org/10.1016/j.survophthal.2012.12.001 (2013).
12. Ehrlich, R. et al. Age-related macular degeneration and the aging eye. Clin. Interv. Aging 3, 473–482. https://doi.org/10.2147/cia.
s2777 (2008).
13. Chirco, K. R., Sohn, E. H., Stone, E. M., Tucker, B. A. & Mullins, R. F. Structural and molecular changes in the aging choroid:
Implications for age-related macular degeneration. Eye (London) 31, 10–25. https://doi.org/10.1038/eye.2016.216 (2017).
14. Manjunath, V., Goren, J., Fujimoto, J. G. & Duker, J. S. Analysis of choroidal thickness in age-related macular degeneration using
spectral-domain optical coherence tomography. Am. J. Ophthalmol. 152, 663–668. https://d oi.o
rg/1 0.1 016/j.a jo.2 011.0 3.0 08 (2011).
15. Jonas, J. B., Forster, T. M., Steinmetz, P., Schlichtenbrede, F. C. & Harder, B. C. Choroidal thickness in age-related macular degen-
eration. Retina 34, 1149–1155. https://doi.org/10.1097/iae.0000000000000035 (2014).
16. Razavi, S., Souied, E. H., Darvizeh, F. & Querques, G. Assessment of choroidal topographic changes by swept-source optical
coherence tomography after intravitreal ranibizumab for exudative age-related macular degeneration. Am. J. Ophthalmol. 160,
1006–1013. https://doi.org/10.1016/j.ajo.2015.08.009 (2015).
17. Wood, A. et al. Retinal and choroidal thickness in early age-related macular degeneration. Am. J. Ophthalmol. 152, 1030-1038.
e1032. https://doi.org/10.1016/j.ajo.2011.05.021 (2011).
18. Ahn, S. M. et al. Retinal vascular flow and choroidal thickness in eyes with early age-related macular degeneration with reticular
pseudodrusen. BMC Ophthalmol. 18, 184. https://doi.org/10.1186/s12886-018-0866-3 (2018).
19. Krytkowska, E. et al. Impact of carotid endarterectomy on choroidal thickness and volume in enhanced depth optical coherence
tomography imaging. J. Ophthalmol. 2020, 8326207. https://doi.org/10.1155/2020/8326207 (2020).
20. Agrawal, R. et al. Exploring choroidal angioarchitecture in health and disease using choroidal vascularity index. Prog. Retin. Eye
Res. 77, 100829. https://doi.org/10.1016/j.preteyeres.2020.100829 (2020).
21. Singh, S. R., Vupparaboina, K. K., Goud, A., Dansingani, K. K. & Chhablani, J. Choroidal imaging biomarkers. Surv. Ophthalmol.
64(3), 312–333. https://doi.org/10.1016/j.survophthal.2018.11.002 (2019).
22. Koh, L. H. L., Agrawal, R., Khandelwal, N., Sai Charan, L. & Chhablani, J. Choroidal vascular changes in age-related macular
degeneration. Acta Ophthalmol. 95(7), e597–e601. https://doi.org/10.1111/aos.13399 (2017).
23. Ozcaliskan, S., Balci, S. & Yenerel, N. M. Choroidal Vascularity Index determined by binarization of enhanced depth imaging
optical coherence tomography images in eyes with intermediate age-related macular degeneration. Eur. J. Ophthalmol. 30(6),
1512–1518. https://doi.org/10.1177/1120672120919341 (2020).
24. Giannaccare, G. et al. Choroidal vascularity index quantification in geographic atrophy using binarization of enhanced-depth
imaging optical coherence tomography scans. Retina 40(5), 960–965. https://doi.org/10.1097/IAE.0000000000002459 (2020).
Scientific Reports | (2021) 11:15106 | https://doi.org/10.1038/s41598-021-94676-6 9
Vol.:(0123456789)www.nature.com/scientificreports/
25. Ulańczyk, Z. et al. Dietary and lifestyle factors modulate the activity of the endogenous antioxidant system in patients with age-
related macular degeneration: Correlations with disease severity. Antioxidants (Basel, Switzerland) 9, 954. https://doi.org/10.3390/
antiox9100954 (2020).
26. Bhardwaj, V. & Rajeshbhai, G. P. Axial length, anterior chamber depth—A study in different age groups and refractive errors. J.
Clin. Diagn. Res. 7(10), 2211–2212. https://doi.org/10.7860/JCDR/2013/7015.3473 (2013).
27. Sonoda, S. et al. Choroidal structure in normal eyes and after photodynamic therapy determined by binarization of optical coher-
ence tomographic images. Investig. Ophthalmol. Vis. Sci. 55(6), 3893–3899. https://doi.org/10.1167/iovs.14-14447 (2014).
28. Agrawal, R. et al. Choroidal vascularity index as a measure of vascular status of the choroid: Measurements in healthy eyes from
a population-based study. Sci. Rep. 12(6), 21090. https://doi.org/10.1038/srep21090 (2016).
29. Agrawal, R., Li, L. K., Nakhate, V., Khandelwal, N. & Mahendradas, P. Choroidal Vascularity Index in Vogt–Koyanagi–Harada
disease: An EDI-OCT derived tool for monitoring disease progression. Transl. Vis. Sci. Technol. 5(4), 7. https://doi.org/10.1167/
tvst.5.4.7 (2016).
30. Ferris, F. L. 3rd. et al. Clinical classification of age-related macular degeneration. Ophthalmology 120, 844–851. https://doi.org/10.
1016/j.ophtha.2012.10.036 (2013).
31. Friedman, E. A hemodynamic model of the pathogenesis of age-related macular degeneration. Am. J. Ophthalmol. U. S. 124,
677–682 (1997).
32. Grunwald, J. E. et al. Foveolar choroidal blood flow in age-related macular degeneration. Investig. Ophthalmol. Vis. Sci. 39, 385–390
(1998).
33. Noori, J., RiaziEsfahani, M., Hajizadeh, F. & Zaferani, M. M. Choroidal mapping; a novel approach for evaluating choroidal thick-
ness and volume. J. Ophthalmic Vis. Res. 7, 180–185 (2012).
34. Invernizzi, A. et al. Choroidal structural changes correlate with neovascular activity in neovascular age related macular degenera-
tion. Investig. Ophthalmol. Vis. Sci. 59, 3836–3841. https://doi.org/10.1167/iovs.18-23960 (2018).
35. Wang, X. & Ohji, M. Vascular endothelial growth factor and its inhibitor in age-related macular degeneration. Taiwan J. Ophthalmol.
3, 128–133. https://doi.org/10.1016/j.tjo.2013.09.002 (2013).
36. Chhablani, J. & Barteselli, G. Clinical applications of choroidal imaging technologies. Indian J. Ophthalmol. 63, 384–390. https://
doi.org/10.4103/0301-4738.159861 (2015).
37. Chung, S. E., Kang, S. W., Lee, J. H. & Kim, Y. T. Choroidal thickness in polypoidal choroidal vasculopathy and exudative age-
related macular degeneration. Ophthalmology 118, 840–845. https://doi.org/10.1016/j.ophtha.2010.09.012 (2011).
38. Kang, H. M., Kwon, H. J., Yi, J. H., Lee, C. S. & Lee, S. C. Subfoveal choroidal thickness as a potential predictor of visual outcome
and treatment response after intravitreal ranibizumab injections for typical exudative age-related macular degeneration. Am. J.
Ophthalmol. 157, 1013–1021. https://doi.org/10.1016/j.ajo.2014.01.019 (2014).
39. Metelitsina, T. I. et al. Foveolar choroidal circulation and choroidal neovascularization in age-related macular degeneration. Investig.
Ophthalmol. Vis. Sci. 49, 358–363. https://doi.org/10.1167/iovs.07-0526 (2008).
40. Ellakwa, A., Ibraheem, A. & Yousef, A. The effect of hypertension on choroidal thickness measured by optical coherence tomog-
raphy. Menoufia Med. J. 32, 678–682. https://doi.org/10.4103/mmj.mmj_887_17 (2019).
41. Jager, R. D., Mieler, W. F. & Miller, J. W. Age-related macular degeneration. N. Engl. J. Med. 358, 2606–2617. https://doi.org/10.
1056/NEJMra0801537 (2008).
42. Klein, R., Peto, T., Bird, A. & Vannewkirk, M. R. The epidemiology of age-related macular degeneration. Am. J. Ophthalmol. 137,
486–495. https://doi.org/10.1016/j.ajo.2003.11.069 (2004).
43. Risk factors for neovascular age-related macular degeneration. The eye disease case-control study group. Arch. Ophthalmol. 110,
1701–1708. https://doi.org/10.1001/archopht.1992.01080240041025 (1992).
44. Smith, W. et al. Risk factors for age-related macular degeneration: Pooled findings from three continents. Ophthalmology 108,
697–704. https://doi.org/10.1016/s0161-6420(00)00580-7 (2001).
45. Hyman, L. G., Lilienfeld, A. M., Ferris, F. L. 3rd. & Fine, S. L. Senile macular degeneration: A case-control study. Am. J. Epidemiol.
118, 213–227. https://doi.org/10.1093/oxfordjournals.aje.a113629 (1983).
46. Tan, J. S., Mitchell, P., Smith, W. & Wang, J. J. Cardiovascular risk factors and the long-term incidence of age-related macular
degeneration: The Blue Mountains Eye Study. Ophthalmology 114, 1143–1150. https://d oi.o
rg/1 0.1 016/j.o
phtha.2 006.0 9.0 33 (2007).
47. Ahmad, M., Kaszubski, P. A., Cobbs, L., Reynolds, H. & Smith, R. T. Choroidal thickness in patients with coronary artery disease.
PLoS ONE 12, e0175691. https://doi.org/10.1371/journal.pone.0175691 (2017).
48. Sayin, N., Kara, N., Pekel, G. & Altinkaynak, H. Choroidal thickness changes after dynamic exercise as measured by spectral-domain
optical coherence tomography. Indian J. Ophthalmol. 63, 445–450. https://doi.org/10.4103/0301-4738.159884 (2015).
49. Kinoshita, T. et al. Effects of exercise on the structure and circulation of choroid in normal eyes. PLoS ONE 11, e0168336. https://
doi.org/10.1371/journal.pone.0168336 (2016).
50. Mares, J. A. et al. Healthy lifestyles related to subsequent prevalence of age-related macular degeneration. Arch. Ophthalmol. 129,
470–480. https://doi.org/10.1001/archophthalmol.2010.314 (2011).
51. Seddon, J. M., George, S., Rosner, B. & Rifai, N. Progression of age-related macular degeneration: Prospective assessment of
C-reactive protein, interleukin 6, and other cardiovascular biomarkers. Arch. Ophthalmol. 123, 774–782. https://doi.org/10.1001/
archopht.123.6.774 (2005).
52. Williams, P. T. Prospective study of incident age-related macular degeneration in relation to vigorous physical activity during a
7-year follow-up. Investig. Ophthalmol. Vis. Sci. 50, 101–106. https://doi.org/10.1167/iovs.08-2165 (2009).
53. Knudtson, M. D., Klein, R. & Klein, B. E. Physical activity and the 15-year cumulative incidence of age-related macular degenera-
tion: The Beaver Dam Eye Study. Br. J. Ophthalmol. 90, 1461–1463. https://doi.org/10.1136/bjo.2006.103796 (2006).
54. Radak, Z., Taylor, A. W., Ohno, H. & Goto, S. Adaptation to exercise-induced oxidative stress: From muscle to brain. Exerc. Immu-
nol. Rev. 7, 90–107 (2001).
55. Kishan, A. U., Modjtahedi, B. S., Martins, E. N., Modjtahedi, S. P. & Morse, L. S. Lipids and age-related macular degeneration.
Surv. Ophthalmol. 56, 195–213. https://doi.org/10.1016/j.survophthal.2010.08.008 (2011).
56. Wong, I. Y., Wong, R. L., Zhao, P. & Lai, W. W. Choroidal thickness in relation to hypercholesterolemia on enhanced depth imaging
optical coherence tomography. Retina 33, 423–428. https://doi.org/10.1097/IAE.0b013e3182753b5a (2013).
Author contributions
Conceptualization, A.M.; ophthalmologic examination, E.K., K.M-P.; database management, A.G.; statistical anal-
ysis, K.S.; writing—original draft preparation, E.K., Z.U.; writing—review and editing, A.M.; supervision, A.M.
Funding
This work was supported by Polish National Centre for Research and Development (grant number:
STRATEGMED1/234261/2NCBR/2014) and European Union funds from the European Union Regional Devel-
opment Fund, Interreg Cooperation Program V A Mecklenburg-Western Pomerania/Brandenburg/Poland for
2014–2020: “Consolidating cross-border cooperation through ex-change of knowledge and skills in the field of
modern diagnostic imaging methods in ophthalmology”.
Scientific Reports | (2021) 11:15106 | https://doi.org/10.1038/s41598-021-94676-6 10
Vol:.(1234567890)www.nature.com/scientificreports/
Competing interests
The authors declare no competing interests.
Additional information
Correspondence and requests for materials should be addressed to Z.U. or A.M.
Reprints and permissions information is available at www.nature.com/reprints.
Publisher’s note Springer Nature remains neutral with regard to jurisdictional claims in published maps and
institutional affiliations.
Open Access This article is licensed under a Creative Commons Attribution 4.0 International
License, which permits use, sharing, adaptation, distribution and reproduction in any medium or
format, as long as you give appropriate credit to the original author(s) and the source, provide a link to the
Creative Commons licence, and indicate if changes were made. The images or other third party material in this
article are included in the article’s Creative Commons licence, unless indicated otherwise in a credit line to the
material. If material is not included in the article’s Creative Commons licence and your intended use is not
permitted by statutory regulation or exceeds the permitted use, you will need to obtain permission directly from
the copyright holder. To view a copy of this licence, visit http://creativecommons.org/licenses/by/4.0/.
© The Author(s) 2021
Scientific Reports | (2021) 11:15106 | https://doi.org/10.1038/s41598-021-94676-6 11
Vol.:(0123456789)You can also read