Water vapor isotopes indicating rapid shift among multiple moisture sources for the 2018-2019 winter extreme precipitation events in southeastern ...
←
→
Page content transcription
If your browser does not render page correctly, please read the page content below
Hydrol. Earth Syst. Sci., 26, 117–127, 2022
https://doi.org/10.5194/hess-26-117-2022
© Author(s) 2022. This work is distributed under
the Creative Commons Attribution 4.0 License.

Water vapor isotopes indicating rapid shift among multiple
moisture sources for the 2018–2019 winter extreme
precipitation events in southeastern China
Tao Xu1 , Hongxi Pang1,2 , Zhaojun Zhan1 , Wangbin Zhang1 , Huiwen Guo1 , Shuangye Wu3 , and Shugui Hou1,4
1 Key Laboratory of Coast and Island Development of Ministry of Education, School of Geography and Ocean Science,
Nanjing University, Nanjing 210023, China
2 Collaborative Innovation Center of Climate Change, Jiangsu Province, Nanjing 210023, China
3 Department of Geology and Environmental Geosciences, University of Dayton, Dayton, OH 45469, USA
4 School of Oceanography, Shanghai Jiao Tong University, Shanghai 200240, China

Correspondence: Hongxi Pang (hxpang@nju.edu.cn) and Shugui Hou (shuguihou@sjtu.edu.cn)

Received: 19 May 2021 – Discussion started: 12 July 2021
Revised: 21 November 2021 – Accepted: 6 December 2021 – Published: 11 January 2022

Abstract. In the East Asian monsoon region, winter extreme        10 % of the total annual precipitation (Wang and Feng, 2011).
precipitation events occasionally occur and bring great so-       However, persistent extreme winter precipitation events still
cial and economic losses. From December 2018 to Febru-            occur occasionally (Huang et al., 2018a; X. Li et al., 2020a),
ary 2019, southeastern China experienced a record-breaking        such as the disastrous snowstorm in January 2008 (Ding et
number of extreme precipitation events. In this study, we an-     al., 2008), which caused great losses in agriculture, trans-
alyzed the variation in water vapor isotopes and their control-   portation, and electric power facilities (Zhou et al., 2011).
ling factors during the extreme precipitation events in Nan-      Such extreme events are likely to become more frequent with
jing, southeastern China. The results show that the variations    global warming (Rahmostorf and Coumou, 2011; Qin et al.,
in water vapor isotopes are closely linked to the change in       2021). Therefore, improving the understanding of the char-
moisture sources. Using a water vapor d-excess-weighted           acteristics, controlling factors, and moisture sources of win-
trajectory model, we identified the following five most im-       ter extreme precipitation events over South China could have
portant moisture source regions: South China, the East China      great scientific as well as economic significance.
Sea, the South China Sea, the Bay of Bengal, and continen-           It is well known that extreme weather events are often
tal regions (northwestern China and Mongolia). Moreover,          caused by a combination of anomalous conditions in mul-
the variations in water vapor d excess during a precipita-        tiple atmospheric circulation systems (Li et al., 2019). Previ-
tion event reflect rapid shifts in the moisture source regions.   ous studies attributed the winter extreme precipitation events
These results indicate that rapid shifts among multiple mois-     over South China to anomalies in the western Pacific subtrop-
ture sources are important conditions for sustaining winter-      ical high, the East Asian major trough, the India–Myanmar
time extreme precipitation events over extended periods.          trough, and the formation of the European blocking high
                                                                  (Wang et al., 2000; Zong et al., 2014; Ding and Li, 2017;
                                                                  Huang et al., 2018b). In addition, the variation in winter pre-
                                                                  cipitation was also found to be closely related to sea surface
1   Introduction                                                  temperature over the eastern tropical Indian Ocean and the
                                                                  South China Sea (Zhou et al., 2010; X. Li et al., 2015). In ad-
South China is under the influence of the East Asian Winter       dition to dynamic and thermal conditions, abundant moisture
Monsoon during winter, with a prevailing northeasterly wind.      supply is also an essential condition for winter extreme pre-
As a result, winter precipitation is significantly less than in   cipitation events (Yang et al., 2019; Zhao et al., 2021). There-
summer (Yao et al., 2015), accounting for approximately

Published by Copernicus Publications on behalf of the European Geosciences Union.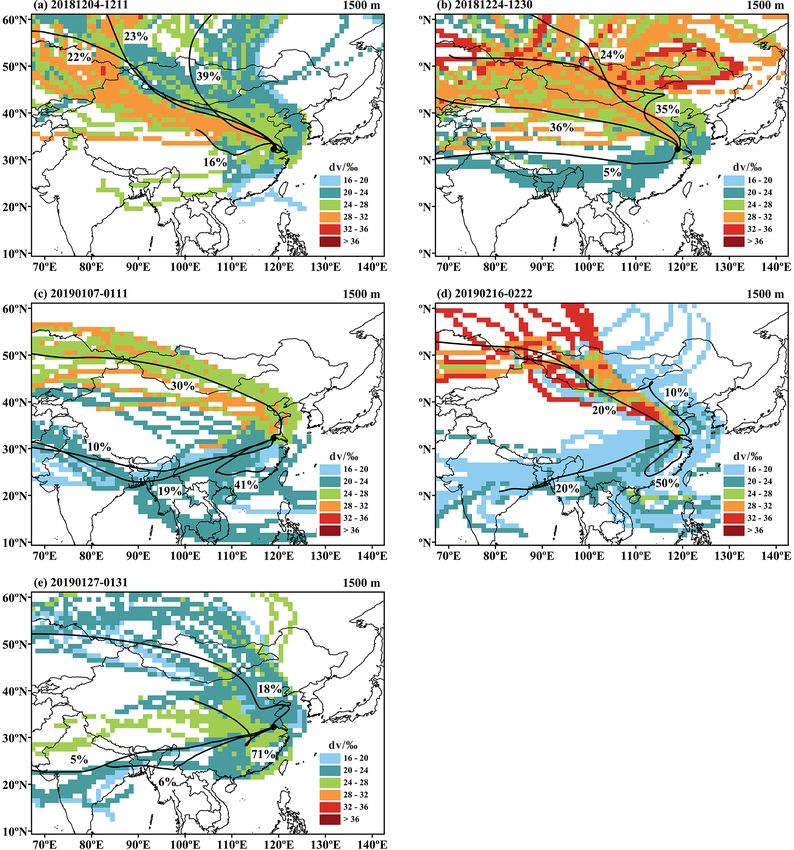
118                              T. Xu et al.: Water vapor isotopes indicating rapid shift among multiple moisture sources

fore, exploring the moisture sources for the extreme precip-           From December 2018 to February 2019, the joint influ-
itation events is a crucial part of understanding factors con-      ence of the central Pacific El Niño and East Asian winter
trolling these events. Previous climatological studies suggest      monsoon quasi-biweekly oscillation led to a long period of
that the most important moisture source regions for winter-         persistent rainfall in southeastern China. The 51 accumulated
time precipitation in South China were the South China Sea,         rainy days had the highest regional effective precipitation
western North Pacific, and the Bay of Bengal (Baker et al.,         since 1981 (Guo et al., 2019; Wang et al., 2020). The regional
2015; Sun and Wang, 2015). However, detailed information            sunshine duration was only half of the normal conditions,
about moisture transport and source regions of individual ex-       with the lowest number of sunshine hours recorded since
treme precipitation events is largely lacking. Moreover, the        1961 (X. Li et al., 2020b). This record-breaking event pro-
large-scale atmospheric circulation patterns are not changing       vided an opportunity for using stable isotopes to understand
significantly at short timescales, so it is difficult for clima-    the possible causes and moisture sources of winter extreme
tological studies to capture the possible rapid switching of        precipitation. In this study, we monitored and analyzed the
moisture sources during an extreme precipitation event.             stable isotopic compositions of water vapor (with hourly res-
   Stable isotopes in precipitation and water vapor (δ 18 O         olution) and precipitation (with daily resolution) during this
and δ 2 H) are useful natural tracers for the hydrological cy-      extreme precipitation period in Nanjing, southeastern China.
cle (Araguás-Araguás et al., 2000; Galewsky et al., 2016).          We utilized these high temporal resolution data to investi-
They have been used to trace moisture sources (Bonne et             gate the evolution of the stable isotopic compositions in wa-
al., 2014; He et al., 2016) and identify water vapor trans-         ter vapor during this period and understand how event-scale
port pathways (Tian et al., 2007; Cai and Tian, 2016). Ear-         isotopic variation is affected by climate factors and moisture
lier studies have improved our understanding of the varia-          sources during winter extreme precipitation events.
tions in stable isotopic compositions at different timescales,
especially at the monthly and daily scales. The variability
in stable isotopic compositions is not only affected by local       2     Materials and methods
meteorological factors, such as temperature and precipitation
                                                                    2.1    Study site
amount (Dansgaard, 1964; Yu et al., 2015), but also by large-
scale atmospheric circulations (Zhou and Li, 2017; Gao et           Sampling and measurement of stable isotopes in water va-
al., 2018) and sources of moisture (Peng et al., 2010; Wang         por and precipitation were carried out at the Station for Ob-
et al., 2017). In addition, deuterium excess (d excess), de-        serving Regional Processes of the Earth System of Nanjing
fined as d = δ 2 H − 8 × δ 18 O, is influenced by the evaporative   University (SORPES-NJU; 32.12◦ N, 118.95◦ E; 55 m a.s.l.
and meteorological conditions in the moisture source region         – above sea level) at the Xianlin Campus of Nanjing Univer-
(Dansgaard, 1964; Merlivat and Jouzel, 1979) and is often           sity, about 20 km east of downtown Nanjing in southeastern
used as an indicator for changes in relative humidity at the        China (Y. Li et al., 2020).
source region or shifts in the moisture origin (Benetti et al.,        Nanjing is located in the lower reaches of the Yangtze river
2014). In addition to monthly and daily scales, precipitation       in China and has a typical subtropical monsoon climate. Un-
and water vapor isotopes have also been used to study pre-          der the influence of the East Asian monsoon, it has a strongly
cipitation processes at the event scale. For instance, Tremoy       seasonal climate, with hot and rainy summers and cold and
et al. (2014) used high-frequency, near-surface water vapor         dry winters. In the winter (December–February – DJF), Nan-
isotopic composition measurements to classify precipitation         jing is under the influence of the East Asian winter mon-
events in the Niamey region in Niger into three categories          soon. From December 2018 to February 2019, affected by
and established the role of mesoscale subsidence and rain           the continuous rainy weather, Nanjing has 46 accumulated
evaporation on the isotopic evolution. J. Li et al. (2015) re-      rainy days.
vealed the abundant water vapor supply from different mois-
ture sources through the continuous isotopic observation of         2.2    Sampling and measurement
a summer extreme precipitation event in Beijing. Han et al.
(2020), based on a data set with a 10 min sampling inter-           Water vapor sampling was carried out on the roof of the
val, showed that the rapid change in stable isotopes in pre-        SORPES-NJU double-story building from 1 November 2012
cipitation is related to different moisture sources and trans-      to the present. Data from December 2018 to February 2019
port paths in the marginal zone of the East Asian monsoon.          were used for this study. The stable isotopic compositions of
These studies demonstrated that high-resolution precipitation       water vapor (δ 18 Ov and δ 2 Hv ) were measured by a Picarro
and/or water vapor isotopes observations are an effective tool      wavelength-scanned cavity ring-down spectrometer (WS-
for identifying more detailed information about precipitation       CRDS; model – Picarro L2120–i). We calibrated the samples
processes. However, observations of precipitation and/or wa-        against various deviations (such as memory effect, drift ef-
ter vapor isotopes during an extreme precipitation event is         fect, and concentration effect), following a set of procedures
sparse, which limits our ability to study extreme precipita-        described in Gu et al. (2019) and Y. Li et al. (2020). We col-
tion processes by water isotopes.                                   lected one sample every 2–3 s and summarized the raw data

Hydrol. Earth Syst. Sci., 26, 117–127, 2022                                             https://doi.org/10.5194/hess-26-117-2022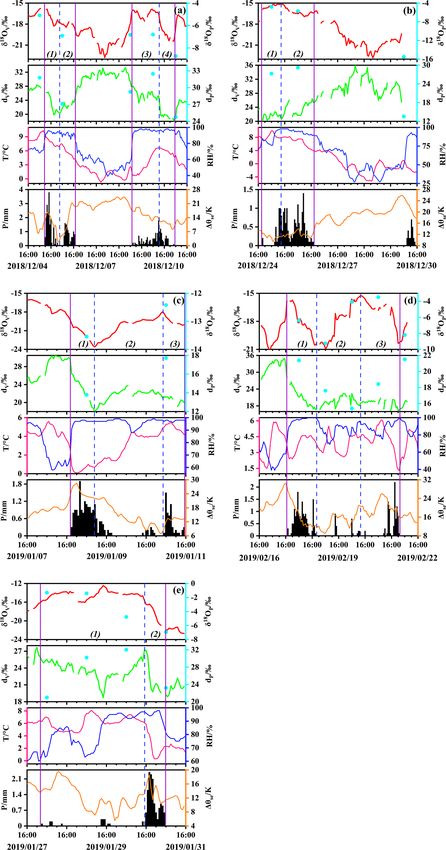
T. Xu et al.: Water vapor isotopes indicating rapid shift among multiple moisture sources                                       119

into hourly averages for this study. The instrumental uncer-
tainties were less than 0.2 ‰ for δ 18 Ov and 1.0 ‰ for δ 2 Hv
(Gu et al., 2019).
   Along with regular water vapor sampling, precipitation
samples were collected on rainy days with an amount of
> 0.1 mm from September 2011 to the present. Data from
December 2018 to February 2019 were used for this study.
All samples were poured into 100 mL polyethylene bottles
immediately after collection. In order to avoid evaporation,
all samples were refrigerated until being analyzed. The sta-
ble isotopic compositions in precipitation (δ 18 Op and δ 2 Hp )
were measured by a Picarro L2120–i in the Key Laboratory
of Coast and Island Development of the Ministry of Educa-
tion at Nanjing University, China. The precision of the mea-
surements is 0.05 ‰ for δ 18 Op and 0.5 ‰ for δ 2 Hp (Tang et
al., 2015).
                                                                   Figure 1. Winter (December–February) precipitation anomalies
2.3   Trajectory-weighted concentration field                      (shading; units in millimeters) over China in the winter of 2018–
                                                                   2019. The cross symbols (×) represent the sampling site at Nan-
In order to trace the moisture source, we used the National        jing. The anomalies were calculated with respect to the 1981–2010
Oceanic and Atmospheric Administration (NOAA) Hy-                  climatology (precipitation data from the Global Precipitation Cli-
brid Single-Particle Lagrangian Integrated Trajectory (HYS-        matology Centre).
PLIT) model and calculated the backward trajectories of
air masses associated with individual extreme precipitation
events, using the Global Data Assimilation System (GDAS)           February 2019, including relative humidity, specific humid-
with a spatial resolution of 1◦ × 1◦ as the background meteo-      ity, temperature, and zonal and meridional wind components
rological data (ftp://ftp.arl.noaa.gov/pub/archives/gdas1; last    from the European Centre for Medium-Range Weather Fore-
access: 20 August 2020). The 8 d backward trajectories were        casts (ECMWF) Copernicus Climate Data Store (https://cds.
calculated every 1 h with the starting height of 1500 m above      climate.copernicus.eu; last access: 24 December 2020) and
the ground because the average residence time of water va-         monthly Global Precipitation Climatology Centre (GPCC)
por in the atmosphere is about 8 to 10 d (van der Ent and          precipitation data (1◦ × 1◦ ) from the NOAA Physical Sci-
Tuinenburg, 2017).                                                 ences Laboratory (https://psl.noaa.gov/data/gridded/, last ac-
   Based on the HYSPLIT results, we calculated the                 cess: 22 January 2021).
concentration-weighted trajectory (CWT) field at 1◦ ×1◦ res-          Unless explicitly noted, the anomalies for climate vari-
olution to establish potential source regions that influence the   ables are calculated with respect to the average of 1981–
isotopic variability in water vapor at the study site (Salama-     2010.
likis et al., 2015; Bedaso and Wu, 2020; Y. Li et al., 2020).
The CWT (Cij ) was calculated with the following equation:         2.5   Definition of the 2018–2019 winter extreme
        PK                                                               precipitation in southeastern China
           k=1 Ck τij k
Cij = P      K
                        ,                                    (1)
             k=1 τij k                                             In the 2018–2019 winter, the regional average cumulative
where (i, j ) are grid indices, k is the trajectory index, K is    effective precipitation days in southeastern China exceeded
the total number of trajectories that pass each 1◦ × 1◦ grid,      51 d, breaking the historical record that had been in place
Ck is the concentration (d excess) measured upon arrival of        since 1981 (Guo et al., 2019). In Nanjing, where our re-
trajectory k, and τij k is the residence time of trajectory k in   search site is located, the seasonal average DJF precipita-
grid cell (i, j ).                                                 tion of 1981–2010 is 126 mm. Accumulated precipitation is
                                                                   259 mm in the 2018–2019 winter, which is more than double
2.4   Meteorological and reanalysis data                           the seasonal average of 1981–2010 (Fig. 1). As a result, we
                                                                   defined the 2018–2019 winter as a typical long-term extreme
We obtained long-term monthly mean (1981–2010) and                 precipitation period. Because some water vapor isotopic data
hourly meteorological data (air temperature, precipitation         at Nanjing were missing due to instrument repair or main-
amount, and relative humidity) from December 2018 to               tenance, five large-scale precipitation events were finally se-
February 2019 at the Nanjing meteorological station from           lected for analysis, including (a) 4–11 December, (b) 24–30
the China Meteorological Data Service Centre. We also used         December 2018, (c) 7–11 January, (d) 16–22 February, and
ERA5 hourly data (2.5◦ × 2.5◦ ) from December 2018 to              (e) 27–31 January 2019.

https://doi.org/10.5194/hess-26-117-2022                                           Hydrol. Earth Syst. Sci., 26, 117–127, 2022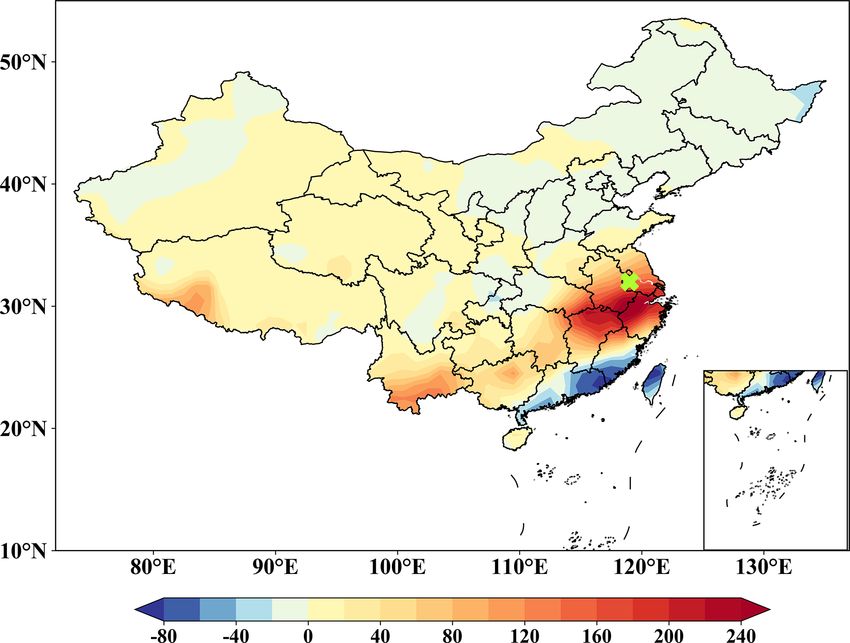
120                                T. Xu et al.: Water vapor isotopes indicating rapid shift among multiple moisture sources

Figure 2. Time series of hourly water vapor (δ 18 Ov and dv ), daily precipitation (δ 18 Op and dp ; cyan dots), air temperature (T ), relative
humidity (RH), precipitation amount (P ), and atmospheric stability (1θse ) at Nanjing. Atmospheric stability is the difference between the
pseudo-equivalent potential temperature of 700 and 850 hPa (1θse = θse700 − θse850 ). (a) The event on 4–11 December 2018. (b) The event
on 24–30 December 2018. (c) The event on 7–11 January 2019. (d) The event on 16–22 February 2019. (e) The event on 27–31 January
2019. The vertical purple lines and blue dashed lines indicate the concentrated rainfall period and different stages of each precipitation event,
respectively.

Hydrol. Earth Syst. Sci., 26, 117–127, 2022                                                    https://doi.org/10.5194/hess-26-117-2022
T. Xu et al.: Water vapor isotopes indicating rapid shift among multiple moisture sources                                                121

Figure 3. Latitude–time cross section of the meridional wind component (shading; units in meters per second; hereafter m s−1 ) and tem-
perature (contour; units in degrees Celsius) at 850 hPa along 120◦ E. The horizontal green lines indicate the latitude of the sampling site at
Nanjing (32.12◦ N).

3   Results                                                              crease, and the atmospheric stability was gradually increas-
                                                                         ing (Fig. 2a and b). Towards the end of the event, the site re-
Figure 2 shows the hourly average δ 18 Ov and dv (water va-              turned to a southerly wind with a temperature increase, and
por d excess), daily δ 18 Op and dp (precipitation d-excess),            the atmospheric stability decreased. Under this circulation
and hourly air temperature, relative humidity, precipitation             background, the δ 18 Ov value was generally high at the begin-
amount, and atmospheric stability for those five extreme pre-            ning, decreased significantly during the events, and gradually
cipitation events. δ 18 Ov varies from −23.6 ‰ to −12.4 ‰                increased again toward the end of the events, whereas the dv
(with an average of −18.1 ‰) and dv ranges from 16.3 ‰ to                value showed the opposite trends (Fig. 2a and b).
35.9 ‰ (with an average of 24.6 ‰). δ 18 Op has a range from                The second class (events c and d) is defined as warm-air-
−15.5 ‰ to −1.3 ‰ and an average of −7.0 ‰. dp ranges                    mass-dominated events. Northerly wind and low temperature
from 13.5 ‰ to 32.5 ‰, with an average of 23.6 ‰. Stable                 occurred only at the beginning of the precipitation event,
isotopes in precipitation and water vapor have a similar vari-           whereas the majority of the event period was characterized
ation pattern. Therefore, only high temporal resolution water            by a southerly wind and a warm temperature (Fig. 3c and d).
vapor isotope data are used for further analysis. Based on               The atmospheric stability was relatively high at the beginning
the large-scale atmospheric circulation patterns (Fig. 3), we            but soon decreased and remained low throughout the events
group these precipitation events into three classes.                     (Fig. 2c and d). Similar to the first class, the δ 18 Ov value was
   The first class (including events a and b) is defined as              generally high at the beginning, decreased significantly dur-
cold-air-mass-dominated events. The beginning of the pre-                ing the events, and gradually increased again toward the end
cipitation event was characterized by the southerly wind and             of the events (Fig. 2c and d). However, different from the first
higher temperature (Fig. 3a and b), and the atmospheric sta-             class, both δ 18 Ov and dv values in this class showed changes
bility was low (Fig. 2a and b). With the invasion of the                 in the same direction throughout the event (Fig. 2c and d).
cold air mass through the majority of the event period, the                 In addition to the above two classes, the third class (event
study site experienced a northerly wind and a temperature de-            e) is characterized by alternating cold and warm air masses.

https://doi.org/10.5194/hess-26-117-2022                                                  Hydrol. Earth Syst. Sci., 26, 117–127, 2022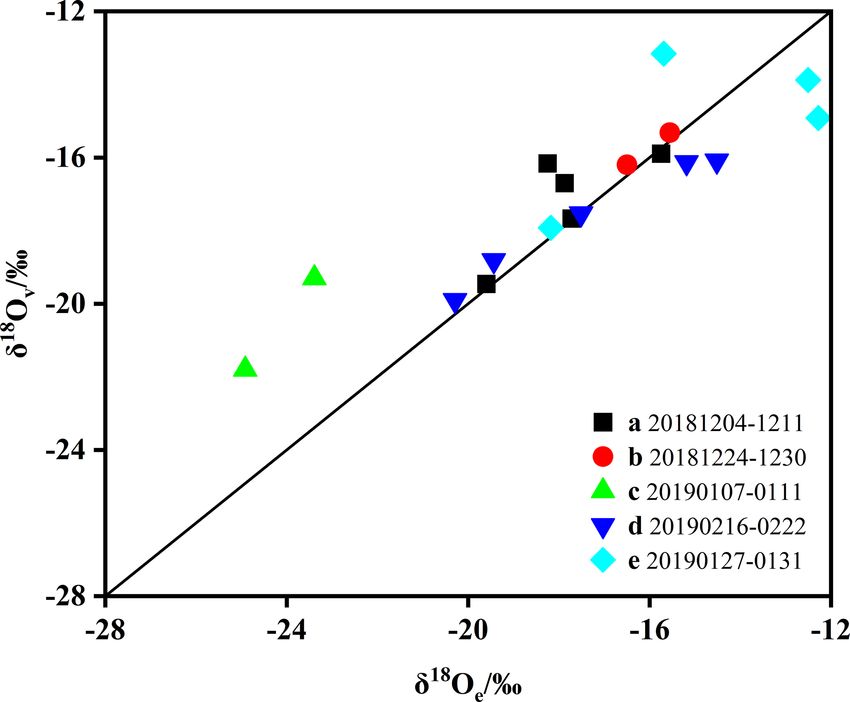
122 T. Xu et al.: Water vapor isotopes indicating rapid shift among multiple moisture sources
The event started with a northerly wind and a low temper-
ature, followed by a southerly wind and a temperature in-
crease, and ended with a northerly wind and a tempera-
ture decrease (Fig. 3e). The atmospheric stability was rela-
tively high at the beginning, gradually decreased, and then in-
creased in the later stage (Fig. 2e). The δ 18 Ov value remained
constant in the early stage, until it decreased suddenly at the
end, whereas the dv value showed great fluctuations (Fig. 2e).
4 Discussion
4.1 Controlling factors for water vapor isotopic
variations during precipitation events
Significant variations in δ 18 Ov and dv in water vapor are ob-
served within each event. In order to explore the control- Figure 4. The relationship between observed (δ 18 Ov ) and equilib-
rium (δ 18 Oe ) vapor isotopic ratios in the five typical precipitation
ling factors for the isotopic variations, we divided the con-
events. The isotopic composition of the water vapor theoretically in
centrated rainfall period of each event into different stages equilibrium with that of the precipitation (δ 18 Oe ) is calculated by
(Fig. 2) based on temporal variation patterns of δ 18 Ov and δe = (δp − ε)/α, where ε is the equilibrium enrichment factor, and
dv . α is the liquid-to-vapor equilibrium fractionation factor (Mercer et
The first class (Fig. 2a and b) of the precipitation events al., 2020). The solid black line is the line of equilibrium.
can be divided into four stages (the last stage of event b is
not delineated because of missing data). In stages 1 and 2,
the δ 18 Ov value continued to decrease with decreasing tem- ward trend, and dv showed a slight decrease, reflecting the
perature due to the temperature effect, i.e., the isotopic com- continuous influence of oceanic water vapor. Previous stud-
position has a significant positive correlation with air tem- ies indicated that raindrop re-evaporation could contribute to
perature. The dv value first decreased (or remained stable) changes in isotopic composition in precipitation and water
and then increased, suggesting a gradual shift of water va- vapor (Laskar et al., 2014; Conroy et al., 2016; Tian et al.,
por source from ocean to land (Fig. 2a and b). Generally, at- 2020; Li et al., 2021). Thus, we compared the observed wa-
mospheric water vapor from the dry and cold regions shows ter vapor isotopic ratios (δ 18 Ov ) with the theoretical isotopic
a more negative δ 18 O value and a relatively high d-excess composition of the water vapor in equilibrium with that of
value (Uemura et al., 2008; Kostrova et al., 2020). In stage the precipitation at local temperature (δ 18 Oe ) during the five
3, the δ 18 Ov and dv values fluctuated without any obvious precipitation events (Fig. 4). The δ 18 Oe values of the third
trends as a whole, mainly due to the mixing of oceanic and and fourth precipitation days of event (d) are slightly larger
inland water vapor. In stage 4, the δ 18 Ov value continued to than the observed water vapor δ 18 Ov values, indicating the
decline due to the rainout effect of precipitation. The lower re-evaporation of falling raindrops. The relative fluctuations
atmospheric stability at the same time suggests increasing δ 18 Ov and dv (especially lower δ 18 Ov in Fig. 2d) during
convection, which tends to lower the stable isotopes in water stages 2 and 3 of event (d) may be caused by the effect of
vapor. The dv value is lower in stage 4 than it in stage 3, with re-evaporation of precipitation.
no obvious trend, reflecting the stable influence of oceanic The third class (Fig. 2e) of the precipitation event can be
water vapor. The period in between precipitation (between divided into two stages. The δ 18 Ov value was relatively high
stages 2 and 3) experienced the lowest δ 18 Ov and highest with some fluctuations in stage 1, possibly due to the influ-
dv values with the lowest temperature and relative humid- ence of local inland water vapor in South China where the
ity (Fig. 2a and b), suggesting the dominant influence of the air temperature remained high (Fig. 2e), leading to enriched
large-scale activity of cold air masses (Fig. 3a and b). isotopic values. The δ 18 Ov value started to decline in stage 2,
The second class (Fig. 2c and d) of the precipitation events likely caused by the rainout effect, reflecting the influence of
can be divided into three stages. In stage 1, the δ 18 Ov value increased convection (indicating the decrease in atmospheric
continued to decrease due to the rainout effect of precipita- stability) on the stable isotopes in water vapor. The dv value
tion. The dv value continued to decrease, suggesting a shift was relatively high in stage 1, likely due to the main contri-
of the water vapor source from land to ocean. In stage 2, both bution of local inland water vapor. The rapid decrease in dv
the δ 18 Ov and dv values increased but were still lower than in the middle may indicate the influence of oceanic water va-
the initial values in stage 1, suggesting increasing contribu- por. In stage 2, the dv value decreased rapidly, reflecting the
tion of local inland water vapor in the mixture of oceanic and rapid change in moisture sources from land water vapor to
inland water vapor. In stage 3, the δ 18 Ov showed a down- oceanic water vapor. The δ 18 Oe values of the first and second
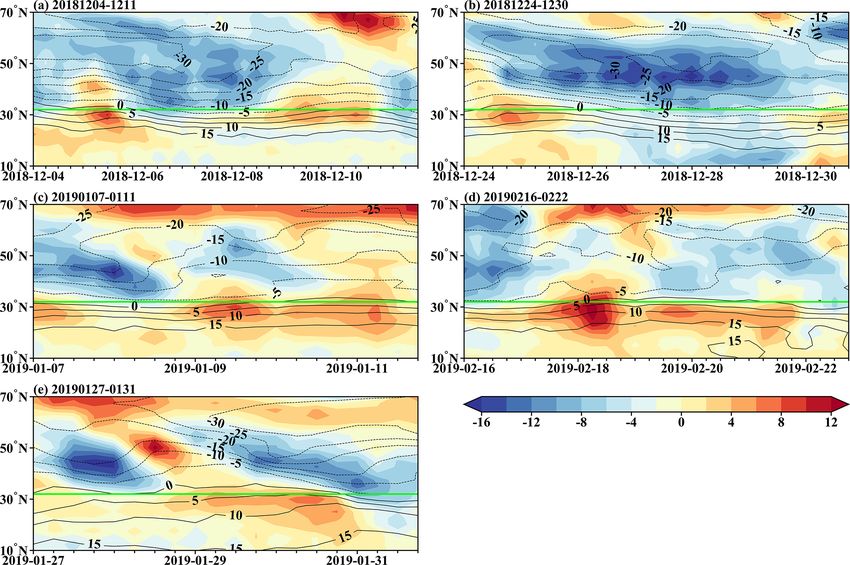
Hydrol. Earth Syst. Sci., 26, 117–127, 2022 https://doi.org/10.5194/hess-26-117-2022T. Xu et al.: Water vapor isotopes indicating rapid shift among multiple moisture sources 123 Figure 5. Concentration field of water vapor dv for 192 h HYSPLIT back trajectories and clusters for the five typical precipitation events. The black circle indicates the location of Nanjing. https://doi.org/10.5194/hess-26-117-2022 Hydrol. Earth Syst. Sci., 26, 117–127, 2022
124 T. Xu et al.: Water vapor isotopes indicating rapid shift among multiple moisture sources
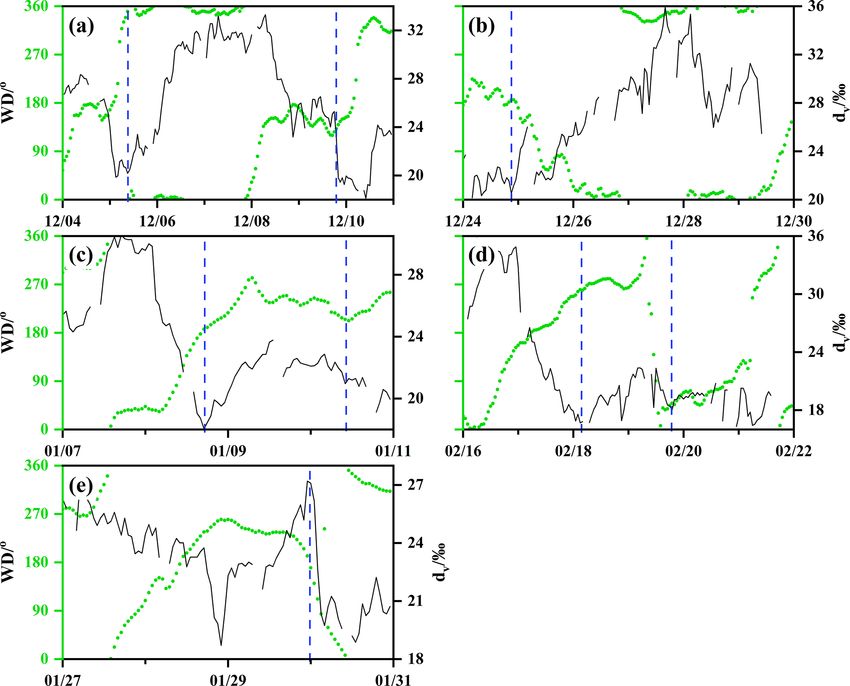
Figure 6. Time series of hourly water vapor dv (black lines) and 850 hPa wind direction (green dots) of precipitation events. The vertical blue
dashed lines indicate the different stages of precipitation events. (a) The event on 4–11 December 2018. (b) The event on 24–30 December
2018. (c) The event on 7–11 January 2019. (d) The event on 16–22 February 2019. (e) The event on 27–31 January 2019.
precipitation days of event (e) are significantly greater than Kostrova et al., 2020). Therefore, based on the HYSPLIT
the observed water vapor δ 18 Ov values (Fig. 4), which also model, we calculated the dv value concentration fields to in-
indicates the re-evaporation of falling raindrops. Thus, in ad- vestigate differences among moisture source regions and wa-
dition to the alternating influence of inland and oceanic water ter vapor transport pathways.
vapor, the effect of re-evaporation of precipitation could also As seen in Fig. 5, we identified five major moisture source
partly account for the relatively large fluctuations of δ 18 Ov regions that affect the sampling site based on cluster analysis
and dv during stage 1. of backward trajectories during these precipitation events at
South China, the East China Sea, the South China Sea, the
4.2 Moisture sources for five precipitation events Bay of Bengal, and continental regions (northwestern China
and Mongolia). The air parcels passing areas indicated with
Previous studies demonstrated that seasonal variations in the warm colors exhibit high d-excess values in the sampling
stable isotopic compositions of precipitation are caused not site. Trajectories passing North China, northwestern China,
only by local meteorological conditions (Dansgaard, 1964) and Mongolia correspond to higher dv values in the sam-
but also by the different moisture sources (Bonne et al., pling site (Fig. 5), as they are associated with relatively dry
2020). The above analysis results show that the large-scale and cold air masses from the inland region. Moisture from
circulation patterns have an important influence on the event- other sources show lower dv values, due to higher relative
scale stable isotopes in water vapor, and the variation in humidity at the oceanic source regions (Fig. 5). These results
meridional wind often corresponds to the change in moisture clearly indicate that the changes in moisture source regions
source regions. Some studies indicated that the air masses could play an important role in the variation in water vapor
could obtain specific isotopic signatures based on the mete- isotopic compositions in winter extreme precipitation events.
orological conditions in the moisture source region before We believe that abundant moisture supply through multiple
reaching a given sampling site (Salamalikis et al., 2015;
Hydrol. Earth Syst. Sci., 26, 117–127, 2022 https://doi.org/10.5194/hess-26-117-2022T. Xu et al.: Water vapor isotopes indicating rapid shift among multiple moisture sources 125
moisture sources is one of the necessary conditions for the ter vapor d excess during a precipitation event reflected the
2018–2019 winter extreme precipitation events to last for a rapid shift in moisture source regions. Our results imply that
long time. multiple moisture sources and the rapid shift among them
are important conditions for sustaining extreme precipitation
4.3 Rapid shift of moisture sources during a events, especially in the relatively cold and dry winter.
precipitation event
Figure 2 shows the variation in stable isotopic values in dif- Data availability. The data set of daily water vapor (δ 18 Ov
ferent stages of the precipitation events divided by vertical and δ 2 Hv ), air temperature, water vapor concentration, relative
blue dashed lines. From the above analysis, it can be seen humidity, precipitation amount, and precipitation (δ 18 Op and
that the intra-event variation in stable isotopic values in wa- δ 2 Hp ) at Nanjing is available at https://data.tpdc.ac.cn/en/data/
ter vapor was mainly controlled by the change in moisture d117f51c-b47f-4bfd-9030-0c54f15067cf/ (Pang, 2021).
sources. Therefore, we believe that the turning points at the
blue dashed lines reflected rapid shifts in moisture source re-
Author contributions. HP and SH conceived this study. Material
gions. In order to verify this hypothesis, we plotted the re-
preparation, data collection, and analysis were performed by TX,
lationship between the dv value and 850 hPa wind direction
ZZ, and WZ. The first draft of the paper was written by TX. All
in the study region. Figure 6 shows that the variation in the authors contributed to the discussion of the results.
dv value is closely related to rapid change in the wind direc-
tion, especially near the turning point. For example, during
event (a) (Fig. 6a), the dv value was relatively low in the early Competing interests. The contact author has declared that neither
stage, and the main wind directions are easterly and south- they nor their co-authors have any competing interests.
easterly, reflecting the influence of water vapor from the East
China Sea. From the first vertical blue dashed line, the wind
direction turned northerly. As a result, the dv value gradually Disclaimer. Publisher’s note: Copernicus Publications remains
increased and remained high, mainly due to the influence of neutral with regard to jurisdictional claims in published maps and
water vapor transported by cold air mass from northwestern institutional affiliations.
China and Mongolia. In the later stage, the wind direction
near the second vertical blue dashed line turned to southerly
and southeasterly, and the dv value decreased due to the water Acknowledgements. This work has been supported by the Na-
vapor from the East China Sea. Therefore, the high temporal tional Natural Science Foundation of China (grant nos. 41771031,
resolution dv value in water vapor can be used to identify the 91837102, and 41830644) and the Priority Academic Program De-
velopment of Jiangsu Higher Education Institutions (PAPD). We
rapid shift of moisture source regions during the continuous
would also like to thank the NOAA Air Resource Laboratory (ARL)
extreme precipitation process. Our results are in good agree-
for providing the HYSPLIT model used in this paper.
ment with previous studies by J. Li et al. (2015) and Han et
al. (2020), who found that the moisture source and transport
path can change rapidly during a precipitation event. In ad- Financial support. This research has been supported by the Na-
dition, the HYSPLIT trajectories before and after the turning tional Natural Science Foundation of China (grant nos. 41771031,
points of dv are significantly different (not shown), providing 91837102, and 41830644).
further evidence that the turning points of dv correspond to
the rapid shift in moisture source regions.
Review statement. This paper was edited by Bob Su and reviewed
by Li Maoshan and two anonymous referees.
5 Conclusions
In this study, we presented stable isotopes in atmospheric wa- References
ter vapor and precipitation for five extreme winter precipi-
tation events in Nanjing, from December 2018 to February Araguás-Araguás, L., Froehlich, K., and Rozanski, K.: Deu-
2019. Our analyses suggest that the variations in water va- terium and oxygen-18 isotope composition of precipitation
and atmospheric moisture, Hydrol. Process., 14, 1341–1355,
por isotope are largely influenced by the change in mois-
https://doi.org/10.1002/1099-1085(20000615)14:83.0.CO;2-Z, 2000.
sampling site received different proportions of water vapor Baker, A., Sodemann, H., Baldini, J., Breitenbach, S., Johnson, K.,
from multiple sources throughout the study period, including Hunen, J. V., and Zhang, P. Z.: Seasonality of westerly moisture
South China, the East China Sea, the South China Sea, the transport in the East Asian summer monsoon and its implications
Bay of Bengal, and continental regions (northwestern China for interpreting precipitation δ 18 O, J. Geophys. Res.-Atmos.,
and Mongolia). In particular, the turning points of the wa- 120, 5850–5862, https://doi.org/10.1002/2014JD022919, 2015.
https://doi.org/10.5194/hess-26-117-2022 Hydrol. Earth Syst. Sci., 26, 117–127, 2022126 T. Xu et al.: Water vapor isotopes indicating rapid shift among multiple moisture sources Bedaso, Z. and Wu, S. Y.: Daily precipitation isotope varia- He, S. and Richards, K.: Stable isotopes in monsoon precip- tion in Midwestern United States: Implication for hydrocli- itation and water vapour in Nagqu, Tibet, and their im- mate and moisture source, Sci. Total. Environ., 713, 136631, plications for monsoon moisture, J. Hydrol., 540, 615–622, https://doi.org/10.1016/j.scitotenv.2020.136631, 2020. https://doi.org/10.1016/j.jhydrol.2016.06.046, 2016. Benetti, M., Reverdin, G., Pierre, C., Merlivat, L., Risi, C., Steen- Huang, W., He, X., Yang, Z., Qiu, T., Wright, J. S., Larsen, H. C., and Vimeux, F.: Deuterium excess in marine wa- Wang, B., and Lin, D.: Moisture sources for winter- ter vapor: Dependency on relative humidity and surface wind time extreme precipitation events over South China dur- speed during evaporation, J. Geophys. Res.-Atmos., 119, 584– ing 1979–2013, J. Geophys. Res.-Atmos., 123, 6690–6712, 593, https://doi.org/10.1002/2013JD020535, 2014. https://doi.org/10.1029/2018JD028485, 2018a. Bonne, J.-L., Masson-Delmotte, V., Cattani, O., Delmotte, M., Huang, W., Yang, Z., He, X., Lin, D., Wang, B., Wright, J. S., Chen, Risi, C., Sodemann, H., and Steen-Larsen, H. C.: The iso- R., Ma, W., and Li, F.: A possible mechanism for the occurrence topic composition of water vapour and precipitation in Ivit- of wintertime extreme precipitation events over South China, tuut, southern Greenland, Atmos. Chem. Phys., 14, 4419–4439, Clim. Dynam., 52, 2367–2384, https://doi.org/10.1007/s00382- https://doi.org/10.5194/acp-14-4419-2014, 2014. 018-4262-8, 2018b. Bonne, J.-L., Meyer, H., Behrens, M., Boike, J., Kipfstuhl, S., Kostrova, S. S., Meyer, H., Fernandoy, F., Werner, M., and Tarasov, Rabe, B., Schmidt, T., Schönicke, L., Steen-Larsen, H. C., and P. E.: Moisture origin and stable isotope characteristics of pre- Werner, M.: Moisture origin as a driver of temporal variabil- cipitation in southeast Siberia, Hydrol. Process., 34, 51–67, ities of the water vapour isotopic composition in the Lena https://doi.org/10.1002/hyp.13571, 2020. River Delta, Siberia, Atmos. Chem. Phys., 20, 10493–10511, Laskar, A., Huang, J., Hsu, S., Bhattacharya, S., Wang, https://doi.org/10.5194/acp-20-10493-2020, 2020. C., and Liang, M.: Stable isotopic composition of near Cai, Z. and Tian, L.: Processes governing water vapor iso- surface atmospheric water vapor and rain–vapor inter- tope composition in the Indo-Pacific region: Convection action in Taipei, Taiwan. J. Hydrol., 519, 2091–2100, and water vapor transport, J. Climate, 29, 8535–8546, https://doi.org/10.1016/j.jhydrol.2014.10.017, 2014. https://doi.org/10.1175/JCLI-D-16-0297.1, 2016. Li, C., Yang, H., and Zhao, J.: Combinational anomalies of Conroy, J. L., Noone, D., Cobb, K. M., Moerman, J. W., and Ko- atmospheric circulation system and occurrences of extreme necky, B. L.: Paired stable isotopologues in precipitation and weather/climate events, Trans. Atmos. Sci., 42, 321–333, vapor: A case study of the amount effect within western trop- https://doi.org/10.13878/j.cnki.dqkxxb.20190302001, 2019 (in ical Pacific storms, J. Geophys. Res.-Atmos., 121, 3290–3303, Chinese with English abstract). https://doi.org/10.1002/2015jd023844, 2016. Li, J., Tao, T., Pang, Z., Tan, M., Kong, Y., Duan, W., and Zhang, Dansgaard, W.: Stable isotopes in precipitation, Tellus, 16, 436– Y.: Identification of different moisture sources through isotopic 468, https://doi.org/10.3402/tellusa.v16i4.8993, 1964. monitoring during a storm event, J. Hydrometeorol., 16, 1918– Ding, F. and Li, C.: Subtropical westerly jet waveg- 1927, https://doi.org/10.1175/JHM-D-15-0005.1, 2015. uide and winter persistent heavy rainfall in south Li, X., Li, J., and Li, Y.: Recent winter precipitation increase in China, J. Geophys. Res.-Atmos., 122, 7385–7400, the Middle-Lower Yangtze River Valley since the Late 1970s: A https://doi.org/10.1002/2017JD026530, 2017. response to warming in the Tropical Indian Ocean, J. Climate, 28, Ding, Y., Wang, Z., Song, Y., and Zhang, J.: Causes of the unprece- 3857–3879, https://doi.org/10.1175/JCLI-D-14-00701.1, 2015. dented freezing disaster in January 2008 and its possible associa- Li, X., Wang, C., Ling, T., Sun, C., Zhang, Y., and Wang, J.: Fea- tion with the global warming, Acta Meteorol. Sin., 66, 808–825, tures and possible causes of the extreme precipitation anomaly 2008 (in Chinese with English abstract). in China during winter 2019/2020, Front. Earth. Sci., 8, 596753, Gao, J., He, Y., Masson-Delmotte, V., and Yao, T.: ENSO effects https://doi.org/10.3389/feart.2020.596753, 2020a. on annual variations of summer precipitation stable isotopes in Li, X., Wen, Z., and Huang, W.: Modulation of South Asian Lhasa, southern Tibetan Plateau, J. Climate, 31, 1173–1182, Jet wave train on the extreme winter precipitation over https://doi.org/10.1175/JCLI-D-16-0868.1, 2018. Southeast China: Comparison between 2015/16 and 2018/19, Galewsky, J., Steen-Larsen, H. C., Field, R. D., Worden, J., Risi, C., J. Climate, 33, 4065–4081, https://doi.org/10.1175/JCLI-D-19- and Schneider, M.: Stable isotopes in atmospheric water vapor 0678.1, 2020b. and applications to the hydrologic cycle, Rev. Geophys., 54, 809– Li, X., Tang, C., and Cui, J.: Intra-event isotopic changes in wa- 865, https://doi.org/10.1002/2015RG000512, 2016. ter vapor and precipitation in South China, Water, 13, 940, Gu, X., Pang, H., Li, Y., Zhang, W., and Wang, J.: Study on cal- https://doi.org/10.3390/w13070940, 2021. ibration method for atmospheric water vapor stable isotopes Li, Y., An, W., Pang, H., Wu, S. Y., Tang, Y., Zhang, observed by cavity ring-down spectroscopy, Spectrosc. Spect. W., and Hou, S.: Variations of stable isotopic composi- Anal., 39, 1700–1705, 2019. tion in atmospheric water vapor and their controlling fac- Guo, L., Liu, B., and Zhu, C.: Extraordinary long wet spell in tors – A 6-Year continuous sampling study in Nanjing, East- south of Yangtze River during 2018/2019 winter and its possi- ern China, J. Geophys. Res.-Atmos., 125, e2019JD031697, ble causes, Chinese Sci. Bull., 64, 3498–3509, 2019 (in Chinese https://doi.org/10.1029/2019JD031697, 2020. with English abstract). Mercer, J. J., Liefert, D. T., and Williams, D. G.: Atmospheric Han, T., Zhang, M., Wang, S., Qu, D., and Du, Q.: Sub- vapour and precipitation are not in isotopic equilibrium in a hourly variability of stable isotopes in precipitation in the continental mountain environment, Hydrol. Process., 34, 3078– marginal zone of East Asian monsoon, Water, 12, 2145, 3101, https://doi.org/10.1002/hyp.13775, 2020. https://doi.org/10.3390/w12082145, 2020. Hydrol. Earth Syst. Sci., 26, 117–127, 2022 https://doi.org/10.5194/hess-26-117-2022
T. Xu et al.: Water vapor isotopes indicating rapid shift among multiple moisture sources                                                 127

Merlivat, L. and Jouzel, J.: Global climatic interpretation of the      Wang, L. and Feng, J.: Two major modes of the wintertime
   deuterium-oxygen 18 relationship for precipitation, J. Geophys.        precipitation over China, Chin. J. Atmos. Sci., 35, 1105–
   Res., 84, 5029–5033, https://doi.org/10.1029/JC084iC08p05029,          1116, https://doi.org/10.3878/j.issn.1006-9895.2011.06.10, 2011
   1979.                                                                  (in Chinese with English abstract).
Pang, H.: Daily water vapor and precipitation isotopes                  Wang, S., Zhang, M., Crawford, J., Hughes, C. E., Du, M., and Liu,
   in Nanjing of eastern China, National Tibetan Plateau                  X.: The effect of moisture source and synoptic conditions on pre-
   Data Center [data set], https://data.tpdc.ac.cn/en/data/               cipitation isotopes in arid central Asia, J. Geophys. Res.-Atmos.,
   d117f51c-b47f-4bfd-9030-0c54f15067cf/ last access: 25                  122, 2667–2682, https://doi.org/10.1002/2015JD024626, 2017.
   January 2021.                                                        Wang, Z., Sun, J., Wu, J., Ning, F., and Chen, W.: Attribu-
Peng, T. R., Wang, C. H., Huang, C. C., Fei, L. Y., Chen,                 tion of persistent precipitation in the Yangtze-Huaihe river
   C. T. A., and Hwong, J. L.: Stable isotopic characteris-               basin during February 2019, Adv. Atmos. Sci., 37, 1389–1404,
   tic of Taiwan’s precipitation: A case study of western pa-             https://doi.org/10.1007/s00376-020-0107-6, 2020.
   cific monsoon region, Earth Planet. Sc. Lett., 289, 357–366,         Yang, Z., Huang, W., He, X., Wang, Y., Qiu, T., Wright, J. S., and
   https://doi.org/10.1016/j.epsl.2009.11.024, 2010.                      Wang, B.: Synoptic conditions and moisture sources for extreme
Qin, P., Xie, Z., Zou, J., Liu, S., and Chen, S.: Future pre-             snowfall events over East China, J. Geophys. Res.-Atmos., 124,
   cipitation extremes in China under climate change and their            601–623, https://doi.org/10.1029/2018JD029280, 2019.
   physical quantification based on a regional climate model and        Yao, Y., Lin, H., and Wu, Q.: Subseasonal variability of precipita-
   CMIP5 model simulations, Adv. Atmos. Sci., 38, 460–479,                tion in China during boreal winter, J. Climate, 28, 6548–6559,
   https://doi.org/10.1007/s00376-020-0141-4, 2021.                       https://doi.org/10.1175/JCLI-D-15-0033.1, 2015.
Rahmstorf, S. and Coumou, D.: Increase of extreme events in a           Yu, W., Tian, L., Ma, Y., Xu, B., and Qu, D.: Simultaneous mon-
   warming world, P. Natl. Acad. Sci. USA, 108, 17905–17909,              itoring of stable oxygen isotope composition in water vapour
   https://doi.org/10.1073/pnas.1101766108, 2011.                         and precipitation over the central Tibetan Plateau, Atmos. Chem.
Salamalikis, V., Argiriou, A. A., and Dotsika, E.: Stable isotopic        Phys., 15, 10251–10262, https://doi.org/10.5194/acp-15-10251-
   composition of atmospheric water vapor in Patras, Greece: A            2015, 2015.
   concentration weighted trajectory approach, Atmos. Res., 152,        Zhao, N., Manda, A., Guo, X., Kikuchi, K., Nasuno, T.,
   93–104, https://doi.org/10.1016/j.atmosres.2014.02.021, 2015.          Nakano, M., Zhang, Y., and Wang, B.: A Lagrangian view
Sun, B. and Wang, H.: Analysis of the major atmospheric moisture          of moisture transport related to the heavy rainfall of July
   sources affecting three sub-regions of East China, Int. J. Clima-      2020 in Japan: Importance of the moistening over the sub-
   tol., 35, 2243–2257, https://doi.org/10.1002/joc.4145, 2015.           tropical regions, Geophys. Res. Lett., 48, e2020GL091441,
Tang, Y., Pang, H., Zhang, W., Li, Y., Wu, S., and Hou, S.: Ef-           https://doi.org/10.1029/2020GL091441, 2021.
   fects of changes in moisture source and the upstream rain-           Zhou, B., Gu, L., Ding, Y., Shao, L., Wu, Z., Yang, X., Li, C., Li, Z.,
   out on stable isotopes in precipitation – a case study in Nan-         Wang, X., Cao, Y., Zeng, B., Yu, M., Wang, M., Wang, S., Sun,
   jing, eastern China, Hydrol. Earth Syst. Sci., 19, 4293–4306,          H., Duan, A., An, Y., Wang, X., and Kong, W.: The great 2008
   https://doi.org/10.5194/hess-19-4293-2015, 2015.                       Chinese ice storm: Its socioeconomic-ecological impact and sus-
Tian, L., Yao, T., Macclune, K., White, J., Schilla, A., Vaughn, B.,      tainability lessons learned, B. Am. Meteorol. Soc., 92, 47–60,
   Vachon, R., and Ichiyanagi, K.: Stable isotopic variations in west     https://doi.org/10.1175/2010BAMS2857.1, 2011.
   China: A consideration of moisture sources, J. Geophys. Res.-        Zhou, J. and Li, T.: A tentative study of the relationship between
   Atmos., 112, D10112, https://doi.org/10.1029/2006JD007718,             annual δ 18 O & δD variations of precipitation and atmospheric
   2007.                                                                  circulations – A case from Southwest China, Quatern. Int., 479,
Tian, L., Yu, W., Schuster, P. F., Wen, R., Cai, Z., Wang, D., Shao,      117–127, https://doi.org/10.1016/j.quaint.2017.05.038, 2017.
   L., Cui J., and Guo, X.: Control of seasonal water vapor isotope     Zhou, L., Tam, C. Y., Zhou, W., and Chan, J. C. L.: Influ-
   variations at Lhasa, southern Tibetan Plateau, J. Hydrol., 580,        ence of South China Sea SST and the ENSO on winter
   1–11, https://doi.org/10.1016/j.jhydrol.2019.124237, 2020.             rainfall over South China, Adv. Atmos. Sci., 27, 832–844,
Tremoy, G., Vimeux, F., Soumana, S., Souley, I., Risi, C.,                https://doi.org/10.1007/s00376-009-9102-7, 2010.
   Favreau, G., and Oï, M.: Clustering mesoscale convective             Zong, H., Bueh, C., and Ji, L.: Wintertime extreme pre-
   systems with laser-based water vapor δ 18 O monitoring in              cipitation event over southern China and its typical cir-
   Niamey (Niger), J. Geophys. Res.-Atmos., 119, 5079–5103,               culation features, Chinese Sci. Bull., 59, 1036–1044,
   https://doi.org/10.1002/2013JD020968, 2014.                            https://doi.org/10.1007/s11434-014-0124-x, 2014.
Uemura, R., Matsui, Y., Yoshimura, K., Motoyama, H., and
   Yoshida, N.: Evidence of deuterium excess in water vapor as an
   indicator of ocean surface conditions, J. Geophys. Res.-Atmos.,
   113, D19114, https://doi.org/10.1029/2008JD010209, 2008.
van der Ent, R. J. and Tuinenburg, O. A.: The residence time of
   water in the atmosphere revisited, Hydrol. Earth Syst. Sci., 21,
   779–790, https://doi.org/10.5194/hess-21-779-2017, 2017.
Wang, B., Wu, R. G., and Fu, X. H.: Pacific-East Asian
   teleconnection: How does ENSO affect East Asian cli-
   mate? J. Climate, 13, 1517–1536, https://doi.org/10.1175/1520-
   0442(2000)0132.0.CO;2, 2000.

https://doi.org/10.5194/hess-26-117-2022                                                 Hydrol. Earth Syst. Sci., 26, 117–127, 2022
You can also read