The Kent and Medway Workforce Skills Evidence Base 2021 - Steve Matthews, Dr Jonathan Pratt and Ross Gill May 2021
←
→
Page content transcription
If your browser does not render page correctly, please read the page content below
The Kent and Medway
Workforce Skills Evidence Base 2021

Steve Matthews, Dr Jonathan Pratt and Ross Gill

May 2021

                                                  i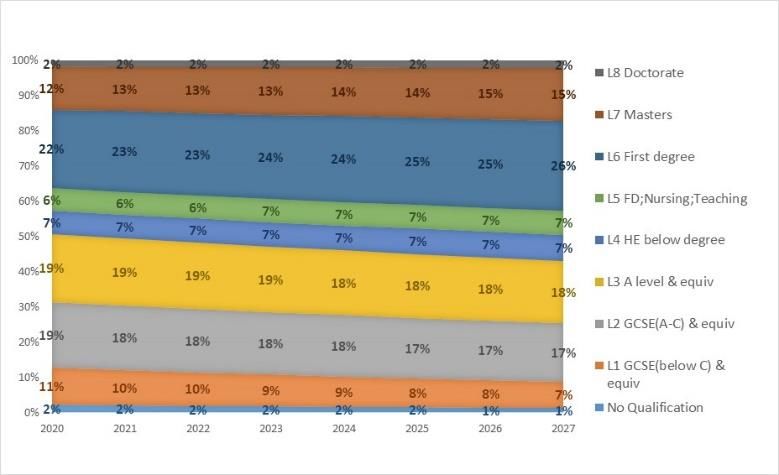
Workforce Skills Evidence Base
Labour Market Intelligence for Kent & Medway
Executive Summary
There are over 72,000 businesses employing 720,000
people in Kent and Medway, and a further 158,000
This Workforce Skills Evidence Base provides an
self-employed people. As elsewhere in the UK, most
overview of current and future skills demand in Kent
businesses (90%) employ 9 or fewer people, but
and Medway, alongside an assessment of community
almost half of all jobs are in medium-sized and large
needs and the ‘supply’ of skills in terms of the resident
companies.
population’s qualifications. The document has been
prepared to inform the strategies, plans and funding
‘Job density’ data suggests that there are fewer jobs
decisions of key local and regional stakeholders. The
than might be expected: in Kent and Medway there
analysis is based on an assessment of a wide range of
are 0.77 jobs for every working-age person, while
existing data sets and published reports, as well as
across Great Britain as a whole there are 0.87,
interviews with key stakeholders and a series of sector
perhaps suggesting a need to encourage new job
workshops with employers.
creation through business start ups and scale ups. An
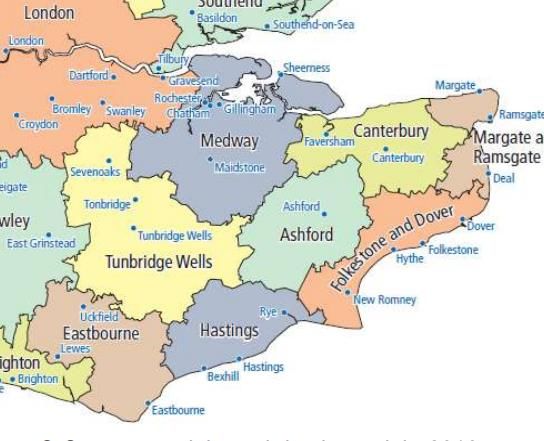
analysis of out-commuting and job density shows that
While the analysis includes consideration of workforce
job density is lowest in East Kent, where the level of
qualifications, skills are not just about a contribution
out-commuting is also the lowest. Significant numbers
to economic output. Instead, the report starts from a
of residents do commute into London, especially from
more comprehensive idea of ‘skills’ in order to
the northern part of the sub-region, and there is also
recognise the importance to the economy and society
significant commuting between the different parts of
of work that might be considered ‘low skilled’; to
Kent and Medway.
acknowledge that employer and individual skills
requirements go beyond formal qualifications to also
Average workplace wages in Kent and Medway are
include a wide range of transferable ‘soft skills’,
slightly below the UK average. However, resident
personal attributes, behaviours and attitudes; and to
earnings are slightly higher than the UK average,
consider the wider importance of skills to the health
suggesting that many commute out to earn better.
and wellbeing of individuals and communities.
While construction and professional services account
Economy, Business and Employment
for the largest numbers of companies, the largest
The Kent and Medway economy generated a total
sectors in terms of employment are education, health
output (measured in gross value added, or GVA) of
and retail, which together account for 34% of all jobs.
around £41 billion in 2018. Until the pandemic in
While these are also the leading employment sectors
2020, total output had grown steadily for a decade,
nationally, Kent and Medway differs from the national
following a slow recovery from the 2009/10 recession.
picture through relatively high employment shares in
construction, motor trades, retail and (although a
Productivity (measured as GVA per filled job) was
small sector in overall job numbers) agriculture.
around £52,000 in 2018. This was around 93% of UK
productivity levels. Over time, productivity growth has
Relative to national averages there are particular
been relatively weak in Kent and Medway (as it has in
concentrations of certain sectors in individual
the UK as a whole), averaging 1.9% per year between
localities, including Agriculture in Maidstone and
2008-18, slightly below the UK growth rate. The result
more rural local authority areas, Manufacturing in
of this is that the differential between Kent and
Swale, Retail in Canterbury, Dartford and Thanet,
Medway and UK levels of productivity has been
Transport and Storage in localities with ports and
virtually unchanged for 20 years.
motorway hubs, business services in Dartford,
Gravesham and Folkestone & Hythe, and Education
Within Kent and Medway, there is considerable
and Health in Canterbury, Medway and Thanet.
diversity in productivity at local level, ranging from
£66,000 in Sevenoaks to less than £40,000 in Thanet.
ii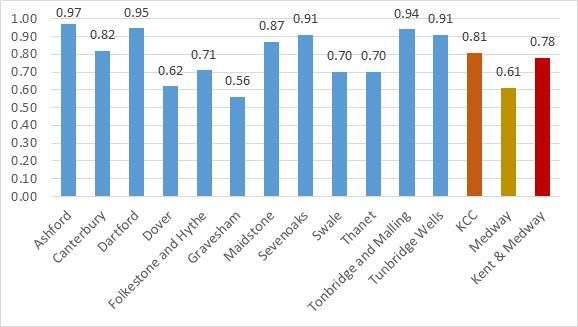
The occupational profile of the workforce is similar to      Figure A: Forecasts by Occupation
the national average, albeit with slightly fewer people                                                                                   Net
                                                                                                                Expansion      Repl    Annual
in professional occupations and slightly more in             Standard Occupations SOC 2010           Est jobs     demand    Demand    Demand
associate professional occupations. Nevertheless,            11 Corporate managers                    78,400         2.2%     3.2%      4,300
                                                             12 Other managers                        28,700         0.8%     3.6%      1,300
professional occupations are the largest single              21 Science, eng. & tech profs            47,100         0.8%     2.4%      1,500
occupational group in Kent and Medway with 187,000           22 Health professionals                  34,100         1.1%     3.4%      1,500
                                                             23 Teaching & ed profs                   41,000         1.6%     3.3%      2,000
people, followed by associate professional and               24 Busn, media & public profs            46,600         1.0%     3.1%      1,900
technical occupations (145,000) and managers,                31 Sci, eng & tech assoc. profs          15,700         0.0%     2.5%        400
                                                             32 Health & care assoc profs             12,000         0.4%     3.6%        500
directors and senior officials (105,000).
                                                             33 Protective service occs               11,300         0.0%     2.1%        200
                                                             34 Culture, media & sports               23,600         0.1%     2.9%        700
Employment in the sectors referenced by KMEP in its          35 Busn & public assoc profs             67,800         1.6%     2.9%      3,100
                                                             41 Admin occupations                     67,800        -1.7%     2.9%        800
Renewal and Resilience Plan is highest in Financial,         42 Secretarial & related                 17,400        -2.4%     2.3%        -
Professional and Business Services (20,190),                 51 Skilled agric & related                7,900         0.1%     3.2%        300
                                                             52 Skilled metal, elec & electronic      28,400        -0.9%     2.2%        400
Development and Construction (15,385) and Retail             53 Skilled construction                  32,200        -0.3%     2.6%        700
and Wholesale (9,390).                                       54 Textiles, print & othr skilled        18,200        -0.5%     2.4%        400
                                                             61 Caring personal service occs          68,900         3.3%     3.5%      4,700
                                                             62 Leisure, travel & personal service    22,200         0.0%     3.0%        700
Employ jobs have grown by 2% in Kent and Medway in           71 Sales occupations                     49,200        -0.9%     2.6%        800
                                                             72 Customer service occs                 16,300         0.4%     2.9%        600
recent years (16,000 additional jobs) with most              81 Process, plant & machine              14,200        -0.7%     2.0%        200
growth in Construction and Accommodation & Food.             82 Transport & machine ops               32,000         0.0%     3.1%      1,000
Overall employment both nationally and in the SELEP          91 Elementary trade occs                 12,300        -0.3%     2.2%        200
                                                             92 Elementary admin occs                 86,500         0.3%     2.9%      2,700
region is forecast to grow by a further 2% by 2027.          Total                                   880,000         0.3%     2.9%     28,400
                                                             Source: DfE Working Futures 2017-2027. SELEP workbook. Local figures
                                                             estimated using Working Futures and ONS BRES 2019.
While new jobs will contribute to demand for skilled
labour, most demand is to replace those already in
work who leave an existing job. When this                    The Wider Context: Emerging Challenges and
‘replacement demand’ is considered alongside                 Opportunities
anticipated new jobs, it is possible to forecast overall     In the short term, employment is likely to be set back
labour demand for people needing to be recruited.            by the economic shock of Covid-19, and be followed
Figure A (below) summarises net anticipated annual           by a recovery, assuming that Covid-related impacts
demand for a range of occupations.                           are reduced or mitigated. Nationally, the Office for
                                                             Budget Responsibility anticipates a return to GDP
The overall net annual demand for new recruits is            growth of 4% in 2021 and 7.7% in 2022, with output
over 28,000 people across Kent & Medway. This                returning to pre-crisis levels by the middle of 2022.
includes 4,700 care workers and 3,100 business               The employment outlook in the medium term is
associate professionals as well as 4,100 corporate           uncertain, although in previous recessions, the
managers and 1,500 science, engineering, and                 economy has returned to output growth before
technology professionals. Given the wide range of            unemployment has started to fall.
roles that need to be filled, skills and qualifications at
all levels will be needed. However, forecasts for the        Sectoral employment dynamics and skills demand in
SELEP region suggest that, by 2027, the proportion of        the medium and long term will also be shaped by a
the workforce with a degree is expected to increase          series of major technological and social trends in the
by 6%, whilst the proportion requiring qualifications        coming years:
at level 1 or below will fall from 13% to 8%.
                                                                  •      Digitalisation will change existing industries
                                                                         and create new ones, blurring the boundaries
                                                                         between some sectors too. Automation is
                                                                         believed to place around 30% of current jobs
                                                                         at risk, and less well-educated workers are
                                                                         expected to be most affected. Recent
                                                                         research also suggests that digitalisation will
                                                                         drive increased demand for higher-level
                                                                         technical skills; a need for more digital
                                                                         technology to be embedded across the
                                                                         curriculum in schools; a need to upskill the
                                                                         existing workforce in digital tech; a
                                                                                                                                            ii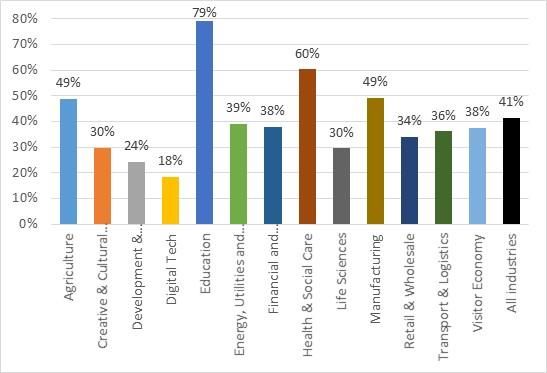
requirement to improve diversity in digitally        engagement by companies in work to raise awareness
        advanced occupations; and a need to expand           and understanding of career opportunities; a need to
        the supply of digital skills training.               manage talent pipelines collectively in some sectors;
                                                             and newer skills needs that reflect wider economic
    •   Decarbonisation will drive a range of new
                                                             trends like digitalisation and de-carbonisation,
        activities in construction, retrofit, energy
                                                             alongside longstanding shortage areas, such as chefs
        generation and supply, more resource
                                                             and some health and care roles.
        efficient methods of production, low-carbon
        transport, natural carbon storage, creating a
                                                             Figure B: Key Issues to be Addressed by Sector
        range of new green jobs and skills, changing
                                                              Agriculture and horticulture
        existing jobs and expanding the numbers of            1. Improve image and perceptions of the sector
        relevant existing jobs.                                   through better communication of the range of
    •   Demographic change is expected to increase                career options available.
        demand for goods and services required by an          2. Address likely labour shortages arising from Brexit.
                                                              3. Improve the match between the education and
        ageing population; spur a productivity gain in
                                                                  skills offer and employer requirements, including in
        response to a rising ‘dependency ratio’, and              new technology, and increase the take up of
        require longer working lives.                             Apprenticeships.
    •   Working practices are also changing, including        4. Improve engagement between the sector and
                                                                  education and skills to raise awareness of career
        more part-time working, increased self-
                                                                  opportunities, update the curriculum and make
        employment, more (e-enabled) independent                  skills services easier for sector companies to access.
        work (including AirB&B and E-bay), zero-hours
        contracts, and the ‘gig economy’.                     Manufacturing
                                                              1. Address the ageing workforce issue through closer
                                                                 engagement with education and skills, use of
Skills demand and provision will also be affected by
                                                                 Apprenticeships and T Levels, and adoption of new
national and local policy. At a national level, the Plan
                                                                 technology.
for Growth (March 2021) set out new measures to               2. Improve access by women to manufacturing and
improve productivity and to invest in low carbon                 engineering careers.
technologies. The Skills White Paper (January 2021)           3. Improve the image and perceptions of the sector,
proposed greater alignment between provision and                 communicating more clearly the attractiveness of
employer needs, the production of local skills plans,            STEM careers.
college business centres to increase collaboration            4. Develop the local skills offer, making the business
between colleges and employers, access to finance for            benefits clearer of programmes, making
re-training, and increasing the quality and uptake of            administration of Apprenticeships more company
                                                                 friendly and more trainee support. There is
higher-level skills.
                                                                 probably untapped potential for companies to
                                                                 engage with schools, FE and HE.
At a Kent and Medway level, the Economic Renewal              5. Improve the local specialist and technical short
and Resilience Plan adopted by KMEP in August 2020               course offer in subjects like computer-aided design,
focused on three principles of ‘greener futures’ (linked         digital automation, Big Data, Internet of Things and
with the decarbonisation agenda); ‘productive and                digital skills.
open’, and ‘better opportunities, fairer chances’
                                                              Development and construction
(linked with ‘fair work’ and higher-pay, more                 1. Undertake workforce and skills pipeline planning to
productive employment). The Employment Task Force                ensure that major projects and house building
was established to drive economic recovery through               activity can secure the workforce they need and to
specific, strategic actions.                                     open up opportunity to a wide range of local
                                                                 people.
Skills Needs in Key Sectors                                   2. Encourage more collaboration among sector
Figure B (below) summarises the key conclusions from             companies and involvement in the education and
the workshops held with industry representatives                 skills system, through existing initiatives like the
                                                                 Enterprise Adviser network.
from the KMEP key sectors. While some of the
                                                              3. Improve image and perceptions of the sector by
priorities are particular to individual sectors, there are       emphasising the range of career options available
also a number of common or frequently mentioned                  and tailoring communications to target audiences
priorities. These include a need to improve a given              (e.g., ‘relatable role models’).
sector’s image and perceptions; better alignment
between curriculum and employer needs; better

                                                                                                                           iii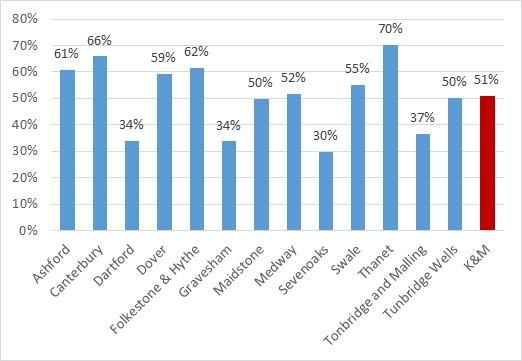
4.   Improve workforce diversity to access new talent           streamlined and more strategic (rather than
     pools and increase the inclusion of under-                 transactional).
     represented groups, such as women.
5.   Address specific skills shortages in areas like
                                                            Finance, professional and business services
     planning, quantity surveying and technology-
                                                            1. Develop soft skills / ‘employability skills’ in the
     related activities such as Modern Methods of
                                                                population, including personal resilience.
     Construction.
                                                            2. Skills for digitalisation, including standard packages
Retail and wholesale                                            like Office 365, common applications like Microsoft
1. Ensure that potential new recruits have and are              EXCEL and PowerPoint.
    able to develop the necessary soft skills and           3. Improve recruitment and retention in response to
    attitudes required for the many entry-level jobs.           the challenge of London salaries becoming
    This includes communication, customer focus,                accessible for more home-based Kent workers
    flexibility and a positive attitude.                        employed in London by, for example, re-training of
2. Make curriculum much more directly relevant to               the existing workforce, accessing new talent pools
    the sector by recruiting more tutors with an                through improved equality, diversity and inclusion.
    industry background and teaching subjects in a          4. Engage more closely with the education and skills
    practical applied way (e.g. marketing applied to a          system by building upon existing positive
    retail context).                                            relationships with FE and HE, and through the
3. More engagement between the sector and                       Enterprise Adviser network, reaching more
    education and skills to help people make careers            potential recruits through digital technology.
    decisions, to make programmes more industry
                                                            Health and social care
    relevant, and to increase take up of opportunities
                                                            1. Address growing recruitment and retention issues,
    such as Apprenticeships.
                                                                made worse by Covid and underpinned by an
Transport and logistics                                         ageing workforce. Shortage areas include nurses in
1. Improve workforce diversity and inclusion, building          social care, nurses generally and registered care
    on existing good practice locally.                          managers.
2. Improve image and perceptions of the sector,             2. Address the skills and workforce aspects of the
    emphasising the wide range of career options that           service integration agenda set out in the recent
    are available (including STEM careers) and working          Health and Social Care White Paper. Collaborative
    through successful existing mechanisms like the             work is needed with education and skills partners to
    Enterprise Adviser network and education-business           take a ‘one workforce’ approach across Health and
    partnerships.                                               Social Care, defining care pathways and associated
3. Address ongoing skills shortages (especially HGV             workforce planning, education and training for each
    drivers) and for vehicle maintenance technicians            of the 4 Kent and Medway Integrated Care Systems.
    and engineers, reflecting the growth of low carbon      3. Better promotion of sector careers, building on the
    engine technology. Scope for adult re-skilling.             400 different roles available in the sector, and
4. Encourage greater collaboration among companies              promoting social care more as a route in and to
    in the sector in addressing skills and workforce            develop a career.
    issues, such as developing a shared talent pipeline
                                                            Energy, utilities and environmental technologies
    and specialist training.
                                                            1. Engaging a more diverse talent pool in sector
Visitor economy                                                 careers, in particular women. This can build on
1. Improve image and perceptions of the sector,                 existing links to education and skills partners and
     emphasising the growth of the ‘high end’                   initiatives like the Enterprise Adviser network.
     experience economy and communicating the full              There is also scope for more collaboration among
     range of career opportunities. Develop aspiring            sector companies themselves in addressing shared
     talent through mentoring, engaging more in careers         workforce challenges.
     activities and collaborating as companies to create    2. Address new and emerging skills needs, especially
     more career and learning progression                       those arising from the de-carbonisation agenda and
     opportunities.                                             digital technology.
2. Help to address post-Covid unemployment: the             3. Ongoing work is needed to meet longstanding skills
     sector is very good at diversity and inclusion and         needs for fitters, engineers, trades and
     can provide re-skilling opportunities for people who       management / administration roles. Good hand
     have lost jobs in the pandemic.                            skills are important to the sector in technician, fitter
3. Address specific skills shortages for chefs, and             and engineering roles.
     ensure that new entrants have the necessary soft
                                                            Life sciences
     skills and attitudes needed in the sector.
                                                            1. Address growing needs for digital skills, as desk-
4. Improve engagement with the education and skills
                                                                 based digital work grows alongside an ongoing
     system, making engagement simpler, more
                                                                 need for lab skills.

                                                                                                                           iv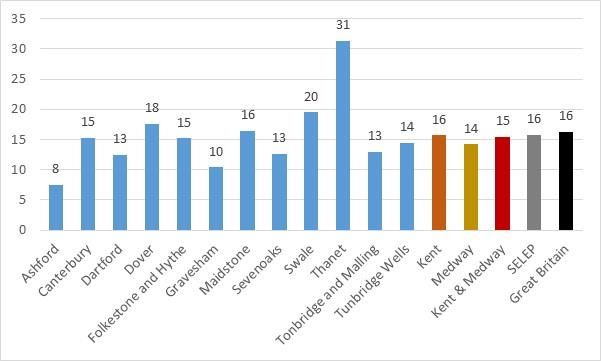
2.   Ensure a good supply of people with STEM skills,                   Other major projects are especially transformational
      including chemistry, chemical engineering and                      in nature: London Resort would create 8,000
      biology, including an emphasis on practical skills as              construction jobs and eventually 17,000 jobs
      well as academic knowledge.                                        associated with its ongoing operation, and Lower
 3.   Increase links to the education and skills system
                                                                         Thames Crossing is expected to require 22,000 people
      building on good work already happening, including
                                                                         to work on its construction. Newtown Works would
      the potential to grow Apprenticeships.
                                                                         create around 700 film and media-related jobs and act
 Creative and cultural industries                                        as a major stimulus to the creative and digital
 1. Consider a wider and more appropriate ‘creative                      economy.
     and digital’ sector, given the convergence of digital
     with all things creative.
                                                                         Job volumes for Ebbsfleet Garden City are in the
 2. Increase awareness of career opportunities in the
     sector, communicating effectively the range of                      process of being forecast, but there will be extensive
     good, well-paid and fulfilling employment that is                   construction activity and new employment space, as
     available.                                                          well as the new HEiQ innovation quarter.
 3. Take a strategic and structural approach to the skills
     needs sector through major transformative                           Skills Supply / Community Needs
     projects, like Newtown Works, as this is needed to                  There are just over 1,129,000 working age (16-64)
     make the most of the growth potential available.                    people resident in Kent and Medway. While the area
 4. Ensure that people are given ample opportunities                     has more retirement age people than the national
     to develop their real-world practice in the sector
                                                                         average, there is also a higher proportion of young
     through commissions with a training element,
     industry-led short courses, and practice-based                      people (19 and under). The Office for National
     longer programmes led by industry.                                  Statistics forecasts that the population will grow by
                                                                         8% by 2030, above the national average of 6%. The
 Digital technology                                                      population of 15-19-year-olds will grow by 20% over
 1. Increase awareness and understanding of career
                                                                         the same period.
      and enterprise opportunities through involvement
      in education and skills partner careers activities.
 2. Engage more widely with schools, FE and HE in                        About 9% of Kent and Medway residents are
      respect of placements and Apprenticeships, and to                  estimated to come from minority ethnic backgrounds,
      influence curriculum to address industry skills                    compared with 14% nationally. Around 20% of
      shortages for coders, developers, animators,                       working age people report having a core disability in
      analytics specialists and data scientists, while also              terms of the Equality Act or some other work limiting
      ensuring that relevant soft skills are also developed.             disability. The pattern varies significantly by locality,
 3. Embrace, post-Covid, flexible working, which is now                  from just 8% in Ashford to 31% in Thanet.
      opening up scope to recruit or contract new staff
      from around the world.
                                                                         67,000 people were unemployed in January 2021. A
 4. Increase re-skilling opportunities for people looking
      to change career and go into tech.
                                                                         further 32,700 were economically inactive but looking
 5. Boost the sector through complementary actions                       for work. There was considerable variation by locality,
      besides skills. There is scope to attract more                     with Thanet having the highest level of claimant count
      entrepreneurs into Kent and Medway if more                         unemployment, for example, and Sevenoaks and
      innovation / incubation hub facilities can be                      Tonbridge and Malling the lowest. Unemployment
      provided which offer a ‘landing space’ and access to               increased significantly in spring 2020 coinciding with
      a local professional network.                                      the first Covid-19 lockdown, has remained at roughly
Source: sector skills workshops conducted sector companies, March 2021   that higher level since and is currently mitigated by
                                                                         the Government’s furlough scheme.
Skills Needs Arising from Major Projects
Seven major projects are identified which will have a                    191,000 working age people in Kent and Medway are
major impact on the Kent and Medway labour market                        in receipt of some form of benefits, including 54,000
if they go ahead.                                                        on Universal Credit. The proportion of children in
                                                                         relatively low income families varies considerably by
While most are still subject to final planning approval,                 locality, being higher than the national average in
the potential number of jobs is very significant.                        Dover, Folkestone & Hythe, and Thanet. There is also
Innovation Park Medway, for example, could create                        a similar pattern to deprivation, the Index of Multiple
around 3,000 high value-added jobs, Kent Medical                         Deprivation placing Swale and Thanet in the bottom
Campus about 4,000 jobs, and Manston eventually                          quartile of districts nationally for overall deprivation.
over 8,000.
                                                                                                                                     v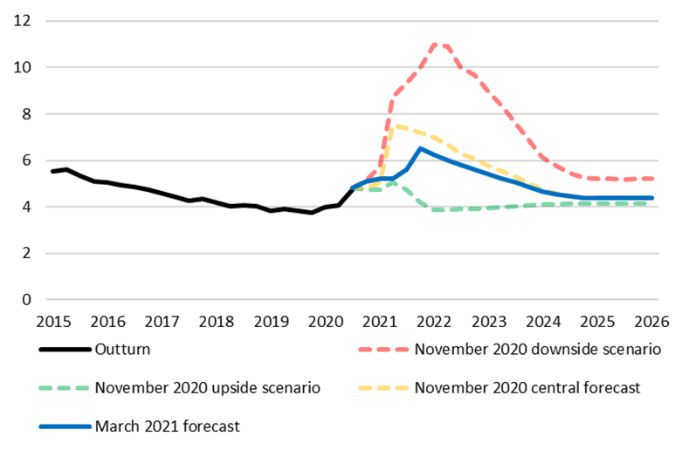
While a similar proportion of Kent and Medway
residents have a Level 1 qualification when compared
with the national average, they are less likely to have
qualifications at Level 3 and above or Level 4 and
above. Given the expected trend in workforce
qualification needs already identified, this is worrying.
Indeed, over 125,000 residents only have
qualifications at Level 1 and 88,000 have no
qualifications at all (see Figure C below).

Fig C: Highest Qualification Obtained
                              Kent and
                              Medway         %
Level 4                         402,900    36%
Level 3                         206,100    18%
Level 2                         194,000    17%
Level 1                         125,400    11%
Other                            70,400     6%
None                             88,100     8%
Trade Apprenticeship             30,700     3%
Total aged 16-64              1,117,600   100%
Source: ONS APS Jan19-Dec19

The proportion of adults with level 4 qualifications or
above is particularly low in Swale and Thanet but
above the national average in Sevenoaks and
Tunbridge Wells.

                                                            vi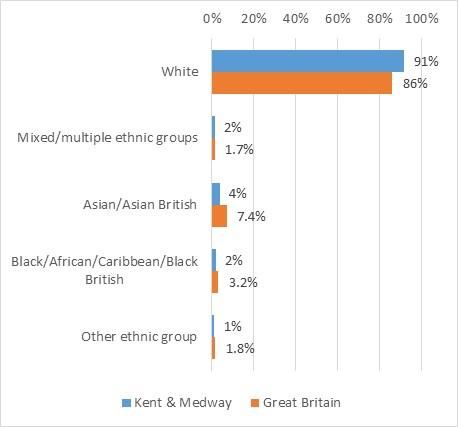
Workforce Skills Evidence Base

                              Table of Contents

1. Introduction                                                   1
       1.1 This Report                                            1
       1.2 What we Mean by ‘Skills’                               1

2. Economy, Businesses & Employment                               3
       2.1 Scale and Productivity                                  3
       2.2 Jobs                                                    4
       2.3 Employment by Sector                                    4
       2.4 Employment by Occupation                                6
       2.5 Travel to Work Patterns                                 7
       2.6 Earnings                                                8
       2.7 Business Stock                                          8
       2.8 Forecast Employment and Skills Needs                   10

3. The Wider Context: Emerging Challenges and Opportunities       13
       3.1 The Medium-term Outlook                                13
       3.2 Longer-term Drivers                                    13
       3.3 Policy Context                                         16
4. Skills Needs in Key Sectors                                    18
       5.1 Key Sectors – Introduction                             18
       5.2 Skills Issues in Key Sectors                           18

5. Skills Needs Arising from Major Projects                       29

6. Skills Supply and Community Needs                              31
       6.1 Kent & Medway Community Profile                        31
       6.2 Unemployment and Economic Inactivity                   32
       6.3 Social Needs                                           33
       6.4 Current Qualifications                                 35

Annexes                                                           36

(i) Workshop and Interview Participants                           36
(ii) Local Sector Employment Strengths                            38
(iii) KMEP Key Sector Definitions                                 39
(iv) Detailed Sector Skills Annexes                               41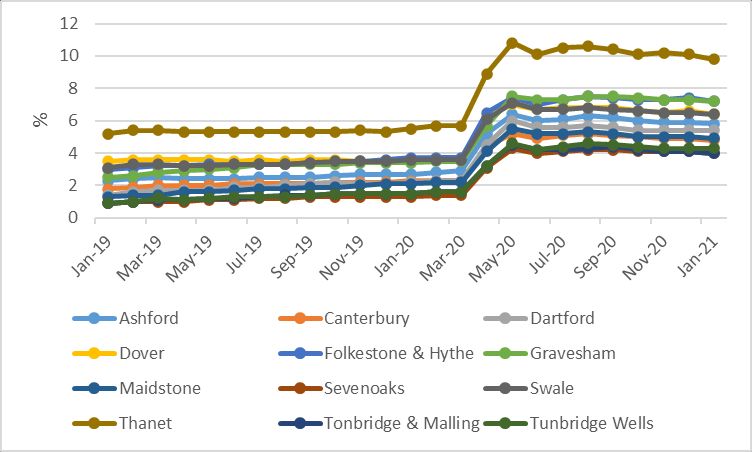
Workforce Skills Evidence Base

                                                                           opportunities faced by the Kent and Medway
    1. Introduction                                                        economy and society.
                                                                       •   Section 4 presents industry stakeholder views on
                                                                           the key skills issues in KMEP priority sectors.
1.1 This Report
                                                                       •   Section 5 provides the latest available intelligence
This Kent & Medway Workforce Skills Evidence Base                          on potential skills needs arising from large
(WSEB) 2021 has been developed to:                                         infrastructure projects and other major
                                                                           developments in Kent and Medway.
a) Provide an overview of current and future skills                    •   Section 6 considers resident qualifications and
   demand in Kent and Medway.                                              social needs of relevance to skills.

b) Provide an overview of social needs and                             The Annexes provide a full list of sector workshop
   workforce skills supply.                                            attendees (i); a summary of key local sector
                                                                       employment strengths (ii); a note on KMEP sector
c) Identify areas in which there are, or are likely to                 definitions (iii); and a detailed analysis for each of the
   be, supply and demand imbalances which could                        KMEP priority sectors (iv).
   impact economic growth and employment and
   household income levels in Kent and Medway
   over the medium to long term.
                                                                       1.2 What We Mean by ‘Skills’
                                                                       The term ‘skills’ is open to multiple interpretations.
It is anticipated that the WSEB will be useful to skills
                                                                       The Chartered Institute for Personnel and
providers in planning for future provision and to local
                                                                       Development, for example, highlights the distinction
economic and social actors in identifying priorities for
                                                                       between skills and qualifications1:
additional provision and initiatives.
                                                                               ‘Although they are often treated
The Evidence Base involves primarily an analysis of
                                                                               interchangeably, skills are not the same as
secondary data, but also draws on a series of
                                                                               qualifications. Skills associated with the ability
employer workshops held with businesses in key Kent
                                                                               to write and understand reports and
& Medway industry sectors in March 2021.
                                                                               communicate with others, to perform
                                                                               numerical and analytical tasks, and use
Sectors are defined in two ways: 1) using standard,
                                                                               computers to help solve problems are at the
mutually exclusive industry sector definitions that are
                                                                               heart of how organisations function in the
commonly used in national statistics, and 2) using the
                                                                               digital age. Other attributes, such as the
bespoke sector definitions used by KMEP in the
                                                                               ability to work well with customers and
Renewal and Resilience Plan. The latter are considered
                                                                               clients, and being caring and creative, are also
by stakeholders to be more appropriate when
                                                                               highly valued in some jobs, although these are
engaging employers and so may be better suited to
                                                                               harder to pin down as specific skills.’
formulating and implementing policy responses to
identified needs.
                                                                       The research conducted for this report surfaced a
                                                                       number of interesting perspectives on what is meant
The structure of the report is as follows:
                                                                       by the term ‘skills’, and what knowledge, capabilities,
                                                                       attitudes, behaviours and attributes are most valued
•    Section 2 looks at the Kent and Medway economy
                                                                       by employers and most needed by Kent and Medway
     and labour market, describing the sectoral and
                                                                       residents.
     occupational structure of employment, and
     providing forecasts as to future skills needs.
                                                                       The report was produced one year into the Covid-19
•    Section 3 sets out the wider context for the study,               pandemic, which brought to light the idea of ‘key
     exploring some of the emerging challenges and                     workers’, many of whom might not be especially
                                                                       highly qualified, but do undertake essential and

1
 https://www.cipd.co.uk/Images/from-inadequate-to-outstanding_2017-
making-the-UK-skills-system-world-class_tcm18-19933.pdf

                                                                                                                             1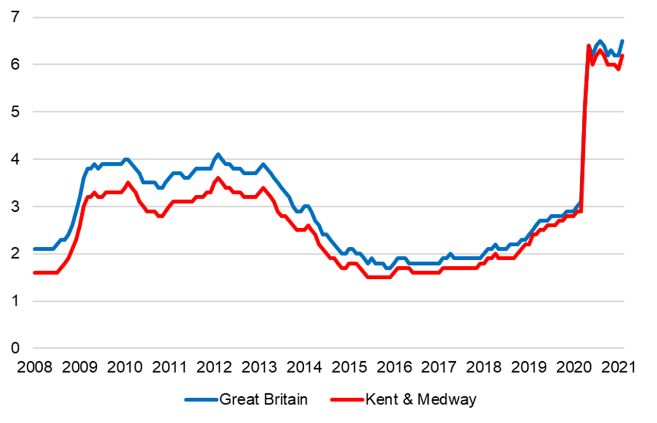
Workforce Skills Evidence Base

sometimes low-paid work. This highlighted the                           This can include the need for some people to make
limitations of using the level of the level of a person’s               their own livelihoods, given the growth in self-
qualifications as a measure of how valuable they are                    employment and the importance of business start-up
to the economy and society.                                             and scale-up to a region in which the business stock is
                                                                        dominated by SMEs. The scale of some of the social
It was pointed out in the sector workshops that so-                     challenges faced in Kent and Medway also suggests an
called ‘elementary occupations’ and people with                         important role for people to create and grow
skilled trades play as essential a role in companies as                 organisations and careers in the social economy.
professionals and graduates. In Development and
Construction, for example, consultancy firms might be                   Finally, education and skills can play an important role
heavily dependent upon the skills of computer-                          in the health, wellbeing and resilience of Kent and
assisted design technicians, while people with trade                    Medway’s communities, which have suffered during
and craft skills are essential to successful building                   the pandemic and may face further pressure in the
firms. Similarly, in Transport and Logistics stevedores                 coming years. These ‘social outcomes’ also need to be
qualified to Level 2 play a vital role and can develop                  factored into the planning and funding decisions that
varied and well-paid careers. ‘Lower skilled’ jobs also                 this report aims to inform.
provide people with a valuable first step in work,
before progressing on to other roles.

It was also stressed by employers that ‘skills’ should
not be reduced to the achievement of qualifications
alone. In particular, employers and individuals also
need a range of ‘soft skills’ and personal attributes in
areas like team working, communication, customer
service, and problem solving, and being resilient,
committed, enterprising and entrepreneurial. In the
Finance, Professional and Business Services sector
workshop it was proposed that employers and the
education and skills sector should work together to
specify an agreed definition of precisely what ‘soft
skills’ and other attributes are needed. The STEM Top
Ten Employability Skills2 were proposed as a starting
point for this work.

This wider set of ‘transferable skills’ is doubly
important in a rapidly changing economy, when
people can expect to have a number of jobs and
career changes over the course of their life. The
pandemic has brought this to the fore, with some
people looking to re-train in response to more limited
labour market opportunities in sectors like retail, but
also to work in activities that are important to them as
individuals or to make best use of their particular
talents.

So, although this report makes frequent references to
qualifications and educational attainment levels, it is
important to consider the wider role that education
and skills can play in meeting the broader needs of
employers, individuals and society.

2
 https://www.stem.org.uk/resources/elibrary/resource/418157/top-ten-
employability-skills

                                                                                                                           2
Workforce Skills Evidence Base
Fig 2.1: Productivity in Kent & Medway (GVA £ per
2. Economy, Businesses and filled job)
Employment
2002:
93.7% of
Future demand for skills and qualifications across Kent UK level
and Medway will depend on local business and
economic needs as well as those of the resident 2018:
population. This chapter looks at: 92.8% of
UK level
• The overall scale and productivity of the Kent and
Medway economy
• Jobs, by sector and occupation Source: ONS, Nominal (smoothed) GVA per filled job, NUTS2
• Travel-to-work and commuting patterns
• The profile of the county’s business stock Within Kent and Medway, there is considerable
• Forecast employment and skills needs diversity in productivity at local level, ranging from
£66,000 in Sevenoaks to less than £40,000 in Thanet.
2.1. Scale and Productivity
Fig 2.2: GVA per Filled Job (£) by Local Authority
The Kent and Medway economy generated total
output (measured in gross value added, or GVA) of
around £41 billion in 2018. Until the pandemic in
2020, total output had grown steadily for a decade,
following a slow recovery from the 2009/10 recession.
Productivity (measured as GVA per filled job) was
around £52,000 in 2018. This was around 93% of UK
productivity levels. It should be noted however that
UK productivity is skewed by a small number of highly
productive regions (mainly in London, the Thames
Source: ONS, Nominal (smoothed) GVA per filled job
Valley and parts of Scotland). In this context, Kent and
Medway’s productivity is in the ‘middle of the pack’. Productivity differentials are partly driven by the
sectoral balance (i.e., the mix between more or less
Over time, productivity growth has been relatively productive sectors). Figure 2.3 shows output and
weak. This reflects a national problem: since the employment by sector, highlighting high output
financial crisis, productivity growth has been weaker relative to jobs in construction, utilities and related
in the UK than in most major economies, a challenge activities and manufacturing; and relatively low
referred to by commentators as the ‘productivity output relative to jobs in retail and accommodation
puzzle’. Productivity growth in Kent and Medway and food service3.
averaged 1.9% per year between 2008-18: this was
slightly below the UK growth rate, with the result that However, overall productivity is also determined by
the differential between Kent and Medway and UK the types of activities that take place within those
levels of productivity has been virtually unchanged for sectors (i.e., higher or lower value jobs). Across both,
20 years: raising workforce skill levels is recognised as a key
factor in improving productivity performance over
time.
3
Note that property and real estate apparently generates very high output
relative to jobs. However, this is largely a function of land values.
3Workforce Skills Evidence Base
Fig 2.3: GVA by Sector (£millions) Fig 2.5: Jobs Density (labour market stress/slack)
GVA/ K&M SELEP GB
Standard Industries GVA % GVA % Emp Emp K&M (jobs) (density) (density) (density)
1 : Agriculture, forestry & fishing (A) 383 1% 2% 0.4 Jobs density 880,000 0.77 0.78 0.87
2 : Mining, quarrying & utilities (B,D,E) 1,593 4% 1% 2.8 Source: ONS Jobs Density 2019
3 : Manufacturing (C) 3,359 8% 7% 1.2
4 : Construction (F) 4,236 10% 7% 1.5
5-7 : Wholesale & Retail 5,156 12% 17% 0.7 This is partly due to outward commuting (discussed
8 : Transport & storage (H) 2,326 5% 5% 1.0 further in section 2.3 below). But some of the lowest
9 : Accomm & food (I) 1,060 2% 8% 0.3
10 : Information & communication (J) 1,438 3% 3% 1.3
job densities are in East Kent where outward
11 : Financial & insurance (K) 1,725 4% 3% 1.6 commuting is less common.
12 : Property (L) 7,262 17% 1% 11.6
13 : Prof, sci. & tech (M) 2,318 5% 7% 0.8
14 : Business admin & support (N) 2,264 5% 8% 0.6
This suggests some level of ‘labour market slack’ in
15 : Public administration & defence (O) 1,870 4% 4% 1.2 parts of Kent & Medway and a need to stimulate
16 : Education (P) 2,796 7% 10% 0.7 growth and employment, by helping businesses to
17 : Health (Q) 3,030 7% 13% 0.5
18 : Arts etc (R,S,T, U) 1,601 4% 4% 0.9
start up and/or scale up:
Total 42,417 100% 100% 1.0
Source: ONS GVA 2018, KCC Strategic Commissioning – Analytics Fig 2.6: Jobs Density by District
Between 2013 and 2018, output grew by around 20%.
Despite employment declines, the property, and
professional, scientific & technical services sectors
played a significant part in that growth (44%),
alongside output growth in the wholesale & retail, and
construction sectors.
Fig 2.4 Change in GVA 2013-2018
Change in % of Kent &
GVA 2013- Medway's
Standard Industries 2018 growth Source: ONS Jobs Density 2019
1,2 : Primary industries & Utilities (ABDE) 10% 3%
3 : Manufacturing (C)
4 : Construction (F)
9%
26%
4%
12%
2.3. Employment by Sector
5,6,7 : Wholesale & Retail 31% 17%
8 : Transport & storage (H) 15% 4% Standard sectors
9 : Accomm & food (I) 17% 2%
10 : Information & communication (J) 22% 4% Figure 2.5 shows the current profile of Kent &
11 : Financial & insurance (K) -5% -1%
Medway businesses and employment by standard
12 : Property (L) 28% 22%
13 : Prof, sci. & tech (M) 28% 22% industrial sector. Construction and the professional
14 : Business admin & support (N) 17% 5% services sector are the largest sectors in terms of
15 : Public administration & defence (O) -2% 0% business enterprises, although this mostly highlights
16 : Education (P) 14% 5% the importance of micro-businesses to these sectors.
17 : Health (Q) 24% 8%
18 : Arts etc (R,S,T, U) 32% 2%
The largest sectors in terms of employment are
Average/Total 20% 100% education, health, and retail, together accounting for
Source: ONS GVA 2013-18, KCC Strategic Commissioning – Analytics more than a third (34%) of employment in Kent and
Medway.
2.2. Jobs
Although Kent & Medway is a sizable labour market,
there are fewer local jobs than might be expected if
the area reflected the national economy. Across Great
Britain there are 0.87 jobs for every working age (16-
64) person in the population. In Kent & Medway there
are only 0.77.
4Workforce Skills Evidence Base
Fig 2.7: Employment by Sector Fig 2.8: Sector Employment (vs. GB)
Standard Industries K&M SELEP
Standarrd industries Jobs %
1 : Agriculture, forestry & fishing (A) 1.5 1.2
1 : Agriculture, forestry & fishing (A) 12,000 1.7 2 : Mining, quarrying & utilities (B,D,E) 1.1 0.9
2 : Mining, quarrying & utilities (B,D and E) 10,000 1.4 3 : Manufacturing (C) 0.8 0.8
3 : Manufacturing (C) 48,000 6.6 4 : Construction (F) 1.4 1.4
4 : Construction (F) 48,000 6.6 5 : Motor trades (Part G) 1.3 1.4
5 : Motor trades (Part G) 17,000 2.4 6 : Wholesale (Part G) 1.1 1.1
6 : Wholesale (Part G) 30,000 4.2 7 : Retail (Part G) 1.2 1.1
7 : Retail (Part G) 78,000 10.8 8 : Transport & storage (H) 1.1 1.1
8 : Transport & storage (inc postal) (H) 39,000 5.4
9 : Accomm & food (I) 1.0 1.0
9 : Accommodation & food services (I) 55,000 7.6
10 : Information & communication (J) 0.6 0.7
10 : Information & communication (J) 19,000 2.6
11 : Financial & insurance (K) 0.7 0.7
11 : Financial & insurance (K) 19,000 2.6
12 : Property (L) 0.8 0.9
12 : Property (L) 10,000 1.4
13 : Prof, sci. & tech (M) 0.8 0.8
13 : Professional, scientific & technical (M) 47,000 6.5
14 : Business administration & support (N) 62,000 8.6 14 : Business admin & support (N) 1.0 0.9
15 : Public administration & defence (O) 27,000 3.7 15 : Public administration & defence (O) 0.9 0.8
16 : Education (P) 71,000 9.8 16 : Education (P) 1.1 1.1
17 : Health (Q) 98,000 13.6 17 : Health (Q) 1.0 1.1
18 : Arts, entertainment, etc (R,S,T and U) 30,000 4.2 18 : Arts etc (R,S,T, U) 0.9 1.0
Total 722,000 100.0 Total 1.0 1.0
Source: ONS BRES 2019. Location Quotients.
Source: ONS UK Business Counts 2020, BRES 2019. SIC 2007.
Annex I summarises how relative employment
Education, health, and retail are also the largest
strengths vary across Districts. It highlights a range of
sectors in terms of employment nationally.
relative local concentrations of employment,
including:
However, there are some important differences
between the national and Kent and Medway sectoral
• Agriculture in Maidstone and rural Kent Districts
employment profiles. Figure 2.6 shows that Kent &
Medway has a 40% greater share of employment in • Manufacturing in Swale
construction, a 30% greater share in motor trades and
• Retail in Canterbury, Dartford (Bluewater) and
a 20% greater share in retail than might be expected if
Thanet
the local economy reflected the industrial structure of
Great Britain as a whole. Relative representation in • Transport & storage in the Districts with ports and
agriculture is even higher (although absolute motorway hubs
employment in agriculture is quite small).
• Business services in Dartford, Gravesham and
Folkestone & Hythe
These are also relative strengths for the wider SELEP
area (which also includes Essex and East Sussex). • Education and Health in Canterbury, Medway and
Thanet.
KMEP Sector Groups
Kent & Medway Economic Partnership’s Renewal &
Resilience Plan, developed in the light of the
challenges of Brexit, Covid-19, and global economic
uncertainty, groups several sectors for Kent and
Medway into groups that are more readily
recognisable to employers and other stakeholders.
Annex II outlines the detailed SIC code definitions of
the KMEP sectors. Geographical concentrations of
employment in the sectors are also discussed in the
sector summaries in Annex III.
5Workforce Skills Evidence Base
Employment in these sector groups is set out below. Figure 2.23 also highlights that employment in the
However, whilst KMEP key sectors cover most of the property and retail sectors both declined by around
economy, they do not include it all and some 2,000 jobs over the 2015-2019 period.
businesses and employment are counted in more than
one sector. When exploring patterns of change across Figure 2.11 looks at the sector employment change
the economy, it is preferable to use standard sector the Kent & Medway economy over that period using
definitions. ‘shift-share’ analysis that takes out ‘background’
economic growth and sector dynamics at a national
Fig 2.9: Employment in KMEP Key Sectors level. This highlights that, in terms of employment
KMEP sectors Jobs change, the agriculture, utilities and construction
Agriculture 17,500 sectors have performed slightly better than expected,
Manufacturing 49,000
Development & construction 62,500
whilst the property, information & communication,
Retail & wholesale 129,000 and professional, scientific & technical services
Transport & logistics 40,000 sectors performed worse.
Visitor economy 74,500
Financial & professional services 132,500 Fig 2.11 Sector ‘Competitiveness’ 2015-2019
Health & social care 100,000
Energy, utilities & environmental tech 10,000
Life sciences 4,300
Creative & cultural 11,500
Digital tech 17,000
Source: ONS BRES 2019
2.3 Employment trends by sector
Over the last few years for which we have consistent
and comparable employment data (2015-19),
employee jobs across Kent & Medway grew by 2%
(16,000 net additional jobs). Figure 2.23 highlights
that, using standard definitions, the largest
employment growth sectors were construction
(+8,500 jobs) and accommodation & food sectors
(+5,000 jobs). Both sectors have, however, have
experienced a significant contraction in demand
during the Covid-19 pandemic. Source: Shift-share analysis based on BRES 2015-19
Fig 2.10: Employment Change 2015-2019
Standard Industries K&M K&M % SELEP %
1 : Agriculture, forestry & fishing (A) 1,000 +6 +5 2.4. Employment by Occupation
2 : Mining, quarrying & utilities (B,D,E) 1,500 +15 0
3 : Manufacturing (C) 1,500 +3 +4
4 : Construction (F) 8,500 +17 +12
The broad occupational profile of the Kent and
5 : Motor trades (Part G) 2,500 +14 +9 Medway workforce (Fig 2.8) is quite similar to the
6 : Wholesale (Part G) -500 -2 -1 national average, although there are slightly fewer
7 : Retail (Part G) -2,000 -2 -6
8 : Transport & storage (H) 2,000 +5 +8
people in professional occupations and slightly more
9 : Accomm & food (I) 5,000 +9 +7 in associate professional occupations.
10 : Information & communication (J) -500 -3 -5
11 : Financial & insurance (K) -500 -3 0
12 : Property (L) -2,000 -18 0
13 : Prof, sci. & tech (M) 0 0 +8
14 : Business admin & support (N) -1,000 -2 +1
15 : Public administration & defence (O) -500 -2 +4
16 : Education (P) -1,000 -1 +2
17 : Health (Q) 1,000 +1 +1
18 : Arts etc (R,S,T, U) -500 -2 -1
Total 16,000 +2 +2
Source: ONS BRES 2015-19
6Workforce Skills Evidence Base
Fig 2.12: Broad Occupations Benchmarked Fig 2.14: Residents Leaving K&M to Work
Source: Census 2011. Adults in work resident in Kent & Medway
The majority of outward commuters travel into
Greater London, highlighting the impact of the capital
on the Kent & Medway labour market (Figure 2.8).
Fig 2.15: K&M Residents Commuting to London
Source: ONS APS Oct19-Sep20. SOC 2010. Jobs (employment and self-
employment)
Nevertheless, with nearly 190,000 people in
professional occupations across Kent & Medway this
is the largest occupational category (Fig 2.18).
Fig 2.13: Jobs by Broad Occupation
Standard Broad Occupations (SOC 2010) Kent & Medway
1: Managers, directors and senior officials 105,600 Source: Census 2011. Adults in work resident in Kent & Medway
2: Professional occupations 187,700
3: Associate prof & tech occupations 145,000
It is important to note that these figures are now ten
4: Administrative and secretarial occupations 91,500
5: Skilled trades occupations 88,900
years old. The High Speed rail connections to Ashford,
6: Caring, leisure and other service occupations 84,700 East Kent and North Kent started operation in 2009,
7: Sales and customer service occupations 56,300 two years before the 2011 Census but may have had
8: Process, plant and machine operatives 43,600 an increasing impact on commuting over time.
9: Elementary occupations 95,500 Remote and flexible working has also increased since
Source: ONS APS Oct19-Sep20. SOC 2010. Jobs (employment and self- the last census, and has been reinforced during the
employment).
pandemic.
2.5. Travel to Work Patterns In the 2011 census the Office for National Statistics
(ONS) calculated that there were 7 different Travel to
The last census (2011) highlighted that Kent & Work Areas (TTWAs) across Kent & Medway, including
Medway residents in Dartford and Sevenoaks were the London TTWA which reaches into the west of Kent
the most likely to leave Kent & Medway to work (Fig (Fig 2.16).
2.14).
7Workforce Skills Evidence Base
Fig 2.16: Map of 2011 Travel to Work Areas Fig: 2.18: Average Weekly Earnings – Residents
Source ASHE 2019. Median weekly pay – full-time workers
Fig 2.19: Average Weekly Earnings – Workforce
Source: ONS 2016.
The methodology for developing Travel to Work Areas
requires between 66% and 75% of people to live and
work in the same area. Within Kent & Medway only
Canterbury and Thanet would meet this threshold as
Local Authority areas (Figure 2.10).
Fig 2.17: Residents Working in Same District/UA
Source ASHE 2019. Median weekly pay – full-time workers
2.7. Business Stock
To a large extent future skills needs will be
determined by the current profile of businesses and
Source: Census 2011. Adults in work resident in Kent & Medway employment, as ‘replacement’ demand for staff
retiring or leaving the labour market tends to
This highlights that travel to work areas are often outweigh both ‘growth’ demand and changes in
larger than Local or Unitary Authority Districts but industrial structure.
also that Kent & Medway is far from a single labour
market. According to national statistics there are over 72,000
business enterprises in Kent & Medway and over
2.6. Earnings 880,000 people in work (Fig 2.20).
Figures 2.18 and 2.19 show that average earnings for Fig 2.20: Businesses, Employees and Jobs
K&M % SELEP
Kent and Medway residents are higher than those for
Enterprises 72,900 41%
people that work in Kent & Medway. Employees 721,500 44%
Jobs (incl self-employment) 880,000 44%
Source: ONS UK Business Counts 2020, BRES & Jobs Density 2019
8Workforce Skills Evidence Base
The difference between the employees and jobs totals Fig 2.23: Employment in Larger Businesses
highlights that there are around 158,000 self-
employed people in Kent & Medway.
Most business enterprises are micro-businesses
employing fewer than 10 people (see Fig 2.21).
Fig 2.21: Business Enterprises by Size
Source: Estimated from ONS UK Business Counts 2020, BRES 2019
Kent & Medway is sometimes portrayed as a small
business economy lacking ‘anchor’ businesses and it
does have slightly fewer large employers than might
be expected given national patterns (although across
Source: ONS UK Business Counts 2020 the UK, the great majority of businesses are small and
micro). An estimated 0.3% of Kent & Medway’s
However, as large businesses and organisations business enterprises employ 250 or more people
employ more staff, employment is still spread quite compared with 0.4% for Great Britain.
evenly across different business size groups (Fig 2.2).
The difference is quite marginal in terms of
enterprises, but it translates to a difference of 4-5% in
Fig 2.22: Enterprises and Employment by Size terms of the proportion of employment in larger
enterprises. Around 30% of the employed workforce
are in large enterprises (250+) nationally, compared
with 26% in Kent & Medway. Nevertheless, medium
and large enterprises remain important to the Kent &
Medway economy and workforce.
Business Size by Sector
An estimated 62% of employment in the Digital tech
sector is in micro-businesses, for example, whilst the
Source: Estimated from ONS UK Business Counts 2020 & BRES 2019 Education, Health and Manufacturing KMEP sectors
are especially focused on medium and large
Workforce development initiatives therefore need to businesses and organisations.
engage medium and large enterprises as well as small
ones. Fig 2.24: Employment in Microbusinesses (0-9
employees) by KMEP Key Sector
Figure 2.23 highlights that the proportion of the
employed workforce employed in large businesses
varies between districts. Large organisations account
for more than half of the workforce in Dartford and
Maidstone but only around a third in Tunbridge Wells
and Thanet.
Source: Estimated from ONS UK Business Counts 2020, BRES 2019
9Workforce Skills Evidence Base
Fig 2.25: Employment in Larger Businesses (50+ The Office for Budget Responsibility is currently
employees) by KMEP Key Sector forecasting that GDP and employment rates may not
return to 2019 (pre-COVID) levels until late 2022.4
Figure 2.27 shows that the SELEP forecasts suggest a
further contraction in manufacturing employment by
2027 (net reduction of 4,800 jobs) but significant
growth in health, accommodation & food, and
education.
Fig 2.27: Employment Forecasts by Sector
Standard Industries (SIC 2007) 2020-2027 K&M est.
1 : Agriculture, forestry & fishing (A) -3% -600
Source: Estimated from ONS UK Business Counts 2020, BRES 2019 2 : Mining, quarrying & utilities (B,D,E) 3% +300
3 : Manufacturing (C) -10% -4,800
4 : Construction (F) 2% +1,000
2.8 Forecast Employment and Skills 5-7 : Wholesale & Retail 2% +2,600
Needs 8 : Transport & storage (H)
9 : Accomm & food (I)
-1%
7%
-500
+4,200
10 : Information & communication (J) 3% +500
The Department for Education’s Working Futures 11 : Financial & insurance (K) -6% -1,200
employment forecasting model predicts that 12 : Property (L) 6% +600
13 : Prof, sci. & tech (M) 3% +1,600
employment growth in the South East Local Enterprise
14 : Business admin & support (N) 3% +2,100
Partnership area will be close to the national average 15 : Public administration & defence (O) 0% -100
(2% by 2027). 16 : Education (P) 4% +3,000
17 : Health (Q) 7% +6,500
18 : Arts etc (R,S,T, U) 2% +700
Looking at the DfE forecasts by sector and adjusting
All industries 2% +16,000
for Kent & Medway’s sector/industrial profile, Source: DfE Working Futures 2017-2027. SELEP workbook. Local figures
suggests there is no reason why employment in Kent estimated using Working Futures and ONS BRES 2019.
& Medway should not also grow by 2% over the next
few years (Fig 2.26). Accommodation & food sector employment is
expected, however, to take time to rebound following
These forecasts were published in 2020 and take the pandemic.
some account of the economic outlook post-Brexit.
However, the model was developed before the Covid- In terms of KMEP key sectors, Figure 2.29 suggests
19 pandemic and can best be described as a backdrop that this equates to a significant employment growth
on which we must overlay intelligence about the in the visitor economy, some growth in the creative &
relative economic impact of the pandemic on the cultural industries and digital tech sectors but low or
outlook for different business sectors, as it emerges. no growth in the life sciences sector.
Fig 2.26: Working Futures Employment Forecasts The forecast for low or no growth in life sciences
employment is in part because the employment
outlook for the manufacturing parts of the sector is
less buoyant than that for research and development
activities.
Source: DfE Working Futures 2017-2027. SELEP workbook. K&M figures
estimated using Working Futures and ONS BRES 2019.
4
Office for Budget Responsibility (OBR), March 2021. Economic and fiscal
outlook.
10Workforce Skills Evidence Base
Fig 2.28: Employment Forecasts by KMEP Sector Fig 2.29: Forecasts by Occupation (including
% Change K&M replacement demand)
Key Sectors 2020-2027 Equivalent Net
Agriculture -3% -600 Expansion Repl Annual
Creative & Cultural Industries Standard Occupations SOC 2010 Est jobs demand Demand Demand
2% +200
11 Corporate managers 78,400 2.2% 3.2% 4,300
Development & Construction 3% +1,700 12 Other managers 28,700 0.8% 3.6% 1,300
Digital Tech 3% +600 21 Science, eng. & tech profs 47,100 0.8% 2.4% 1,500
Education 4% +3,000 22 Health professionals 34,100 1.1% 3.4% 1,500
Energy, Utilities and Environmental Tech 4% +400 23 Teaching & ed profs 41,000 1.6% 3.3% 2,000
24 Busn, media & public profs 46,600 1.0% 3.1% 1,900
Financial and Professional Services 2% +2,500 31 Sci, eng & tech assoc. profs 15,700 0.0% 2.5% 400
Health & Social Care 7% +6,500 32 Health & care assoc profs 12,000 0.4% 3.6% 500
Life Sciences -1% +0 33 Protective service occs 11,300 0.0% 2.1% 200
Manufacturing -10% -4,700 34 Culture, media & sports 23,600 0.1% 2.9% 700
35 Busn & public assoc profs 67,800 1.6% 2.9% 3,100
Retail & Wholesale 2% +2,600
41 Admin occupations 67,800 -1.7% 2.9% 800
Transport & Logistics -1% -500 42 Secretarial & related 17,400 -2.4% 2.3% -
Visitor Economy 6% +4,800 51 Skilled agric & related 7,900 0.1% 3.2% 300
Source: DfE Working Futures 2017-2027. SELEP workbook. Local figures 52 Skilled metal, elec & electronic 28,400 -0.9% 2.2% 400
estimated using Working Futures and ONS BRES 2019. 53 Skilled construction 32,200 -0.3% 2.6% 700
54 Textiles, print & othr skilled 18,200 -0.5% 2.4% 400
61 Caring personal service occs 68,900 3.3% 3.5% 4,700
Most employment demand, though, relates to the 62 Leisure, travel & personal service 22,200 0.0% 3.0% 700
71 Sales occupations 49,200 -0.9% 2.6% 800
replacement of people in jobs that already exist in the 72 Customer service occs 16,300 0.4% 2.9% 600
economy. Figure 2.29 shows that, despite the 81 Process, plant & machine 14,200 -0.7% 2.0% 200
82 Transport & machine ops 32,000 0.0% 3.1% 1,000
relatively low expectations of overall employment
91 Elementary trade occs 12,300 -0.3% 2.2% 200
growth, the demand for new skills and qualifications 92 Elementary admin occs 86,500 0.3% 2.9% 2,700
will continue to be significant. In many occupations, Total 880,000 0.3% 2.9% 28,400
Source: DfE Working Futures 2017-2027. SELEP workbook. Local figures
the demand for new entrants to replace those retiring estimated using Working Futures and ONS BRES 2019.
is about 3-4% of the workforce each year.
Figure 2.30 (below) shows the current qualification
The overall net annual demand for new entrants, profile of people in these occupations. The shading
considering both replacement and expansion demand, highlights the highest qualifications that more than a
is over 28,000 people across Kent & Medway. This quarter of those in an occupation have.
includes 4,700 care workers and 3,100 business
associate professionals as well as 4,100 corporate Fig 2.30: Employment by Qual. level - SELEP
managers and 1,500 science, engineering, and Standard Occupations SOC 2010 L4+ L3 L2 L1 or below
11 Corporate managers 56% 19% 14% 10%
technology professionals. 12 Other managers 48% 19% 19% 14%
21 Science, eng. & tech profs 73% 13% 9% 6%
22 Health professionals 80% 10% 7% 4%
23 Teaching & ed profs 92% 3% 3% 2%
24 Busn, media & public profs 76% 12% 7% 5%
31 Sci, eng & tech assoc. profs 57% 19% 14% 11%
32 Health & care assoc profs 75% 11% 9% 5%
33 Protective service occs 45% 22% 21% 12%
34 Culture, media & sports 70% 16% 8% 7%
35 Busn & public assoc profs 57% 19% 15% 10%
41 Admin occupations 41% 21% 24% 14%
42 Secretarial & related 33% 20% 25% 22%
51 Skilled agric & related 31% 16% 24% 29%
52 Skilled metal, elec & electronic 19% 43% 24% 14%
53 Skilled construction 11% 38% 31% 20%
54 Textiles, print & othr skilled 20% 28% 25% 27%
61 Caring personal service occs 34% 34% 26% 6%
62 Leisure, travel & personal service 29% 28% 25% 18%
71 Sales occupations 24% 28% 27% 22%
72 Customer service occs 34% 25% 26% 15%
81 Process, plant & machine 12% 27% 31% 30%
82 Transport & machine ops 14% 23% 30% 33%
91 Elementary trade occs 12% 20% 27% 40%
Total 17% 20% 30% 33%
Source: DfE Working Futures 2017-2027. SELEP workbook.
It highlights that skills and qualifications at all levels
will be needed to fulfil the replacement demand for
staff.
11You can also read