The Madoff Case: Quantitative Beats Qualitative!
←
→
Page content transcription
If your browser does not render page correctly, please read the page content below

The Madoff Case: FoFiX Bias Ratio

The Madoff Case: Quantitative Beats Qualitative!
Two Red Flags: Bias Ratio and Risk Profile Clearly Pointed to Problems With Madoff

                             Raphael Douady
                               Riskdata Research Director
                                Adil Abdulali
                              Protégé Partners Risk Manager
                            Ingmar Adlerberg
                                    Riskdata C.E.O.

                           Version 2.0 February 9 2009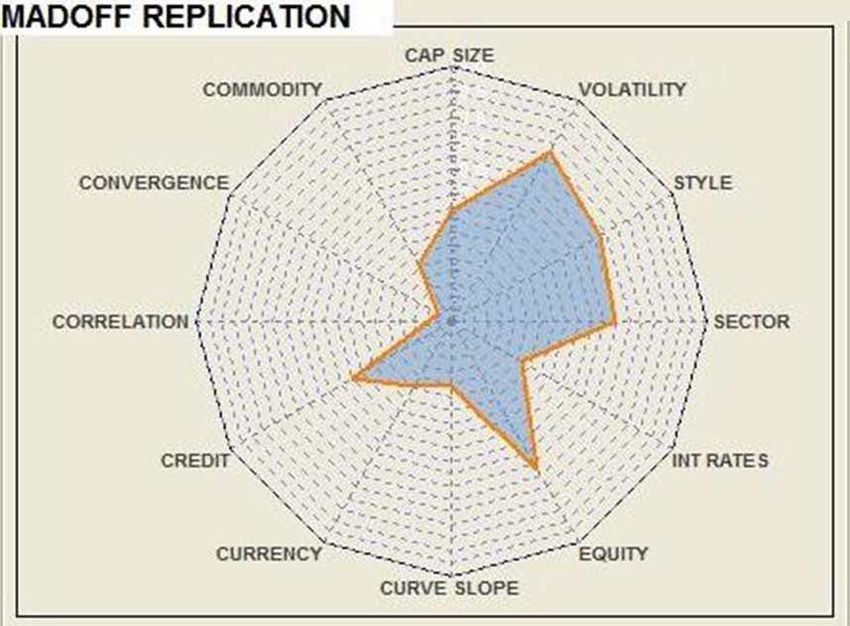
The Madoff Case: FoFiX Bias Ratio

The Madoff scandal continues to send tremors throughout the world of finance. Too many investors did not see any
danger until it was too late. Perhaps the most striking is the fact that even among the funds claiming risk controls or
quantitative processes, or even regulated funds, a few turned-out to be exposed to Madoff’s returns.

Even though some pointed to Madoff as a possible scam since the turn of the millennium too few investors listened.
The Madoff situation clearly shines importance on two critical issues: the place for risk management in the investment
process and the risk management techniques that can be used.

Numbers tell a story and clearly have an order that should be hard to fake. What appears to be too good to be true
can be measured. Forensic accountants use Benford’s law to catch thieves. Analogously, anyone paying attention to
quantitative advances in hedge fund risk management suspected that Madoff was a scam to be avoided. Amongst the
quant techniques useful in detecting fraud, the most efficient is the Bias Ratio, invented by Adil Abdulali of Protégé
Partners and available in Riskdata’s suite of analytics. In Madoff’s case, a calculation of the Bias Ratio points to the
fallacy of Madoff’s returns. In addition, an accurate analysis of Madoff investment Risk Profile is inconsistent with its
style and peer group.

Red Flag #1: The Bias Ratio1
Abdulali offered a tongue-in-cheek description of the Bias Ratio in a talk given in 2004: “the Bias Ratio identifies
managers who produce risqué adjusted returns by indulging in downside deviant behavior facilitated by broken dealer
pricing”. The Bias Ratio is a fairly simple and precise instrument that is highly discriminate and reliably detects return
smoothing.
In the HFR database, Fairfield Sentry Ltd.2 is classified as “Equity Hedge”, a category which, as of mid-November
2008 (last report dates from October 2008) contains 2,290 funds. Since August 2005, Fairfield Sentry’s Bias Ratio
ranges between 6 and 7, when the bulk of Equity Hedge funds in the HFR database mostly scored a Bias Ratio in the
1-3 range.
As a reference, let’s note the Bias Ratio of two other recent frauds: 1) Bayou Superfund was supposed to apply a high
turnover, intraday stock trading strategy and admitted in 2005 that it made up returns. It had a Bias Ratio of 6; 2)
Beacon Hill’s Safe Harbour fund was trading mortgage-backed securities until fraud was discovered in 2002. It had a
Bias Ratio of 7.
The graph below shows the distribution of Bias Ratios of HFR funds in the Equity Hedge category. The two red arrows
show how abnormal the Bias Ratios are for Madoff and for its Swiss feeder Fairfield Lambda. The green arrows
represent the two frauds mentioned above.

1
    Abdulali, Adil. “The Bias Ratio: Measuring the Shape of Fraud.” Protégé Partners – Quarterly Letter 3Q 2006.
2
  Bernard L. Madoff Investments Securities LLC did not report directly to the HFR database, and, in fact, the detail returns of
Madoff Investments Securities are unavailable through open sources. However, we were able to get reliable confirmation that
these returns were identical to the ones of Fairfield Sentry Ltd. (one of its feeders), managed by Fairfield Greenwich Group.
Fiarfield Greenwich Group results are posted by HFR.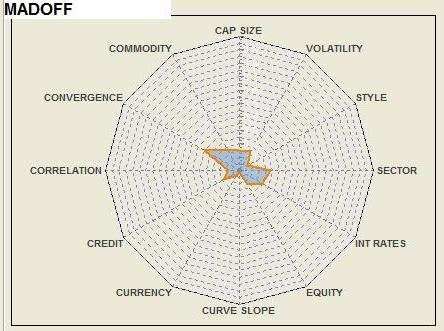
The Madoff Case: FoFiX Bias Ratio
Distribution of Bias Ratio of L/S Equity Hedge Funds
in the HFR database
1000
Total 2281 funds
900
Equity Hedge
F-dist fit
800
758 741 20 Suspicious on
Total 6 Identified
700 Frauds
600
500
400
Fairfield
Madoff Lambda
300
261 252
Bayou Beacon Hill
200
131
20 funds
100 58
20 14 12 7 8
3 4 3 1 2 5 0 1
0
0
5
1
5
2
5
3
5
4
5
5
5
6
5
7
5
8
5
9
0.
1.
2.
3.
4.
5.
6.
7.
8.
Bias Ratio
Conducting comparisons using the Sharpe ratio, we can see that it is far less discriminating as a fraud detector than
the Bias Ratio. The “identified frauds” are Madoff’s fund and its feeders.
Distribution of Sharpe Ratio of L/S Equity Hedge Funds
HFR database Jan 04 - Jul 07
600
Total 1952 funds
495 78 Suspicious on
500 481
Total
6 Identified
Frauds
400
323
300
Madoff
Beacon
212 Bayou Hill
200
163
107 78 funds
100
51
39
29
17 8 8 16
0 3
0
-2 -1.5 -1 -0.5 0 0.5 1 1.5 2 2.5 3 3.5 4 4.5 5+The Madoff Case: FoFiX Bias Ratio
Red Flag #2: Inconsistent Risk Profiles
The next step in the risk analysis process is simulating various versions of Madoff’s “split strike conversion” strategy3.
This description is not complete enough to allow its full replication. Some parameters are not provided, namely, the
moneyness of the call and the put, their maturity and the rolling frequency of the position. So, we simulated this
strategy with various values for these parameters4. The exact choice of stocks should have little impact as Madoff
claims that the basket is “highly correlated to the S&P 100 index” so we simply chose to directly invest in the index.
The graph below shows the range of possible returns of replicated Madoff strategies of “split strike conversion”.
Whatever the parameters, one cannot reach Madoff’s extraordinary posted performance. To be more precise, at best,
we could reach the performances of the underlying S&P 100 index.
Madoff performance vs. Possible Replications
900
Madoff
800
700
600
S&P 100
500
400
300 Range of possible
replications
200
100
0
Ju 89
De 90
Ju 90
De 91
Ju 91
D 92
Ju 92
De 93
Ju 93
De 94
Ju 94
De 95
Ju 95
D 96
Ju 96
De 97
Ju 97
De 98
Ju 98
De 99
Ju 99
D 00
Ju 00
De 01
Ju 01
De 02
Ju 02
De 03
Ju 03
D 04
Ju 04
De 05
Ju 05
De 06
Ju 06
De 07
Ju 07
08
c-
n-
c-
n-
c-
n-
-
n-
c-
n-
c-
n-
c-
n-
-
n-
c-
n-
c-
n-
c-
n-
-
n-
c-
n-
c-
n-
c-
n-
-
n-
c-
n-
c-
n-
c-
n-
ec
ec
ec
ec
De
3
Madoff gave a detailed description of his “split strike conversion” strategy: “The establishment of a typical position entails:
(i) The purchase of a group or basket of equity securities that are intended to highly correlate to the S&P 100 Index.
The basket typically consists of between 40 to 50 stocks in the S&P 100 Index.
(ii) The purchase of out-of-the-money S&P 100 Index put options with a notional value that approximately equals the
market value of the basket of equity securities and
(iii) The sale of out-of-the-money S&P 100 Index call options with a notional value that approximately equals the market
value of the basket of equity securities.”
4
Call and put moneyness range from 0 to 2 standard deviations, option maturities from 2 days to 2 months and the rolling
frequency from 1 day to 1 month.The Madoff Case: FoFiX Bias Ratio The true capability of a risk management system is not just to assess the level of risk of a fund, but its full Risk Profile, namely, which market factors are the most important return drivers and how the fund reacts to changes in these factors. It is our experience that, even when performances themselves cannot be replicated, the risk profile stays the same, i.e. relevant risk factors are the same between the original fund returns and the replication. In the present case, an option strategy like the one described by Madoff, whatever its detail parameters may be, has certain characteristics, just like the DNA print of option trading, that is, an asymmetric reaction to the shifts in the underlying S&P 100 index and to variations of its volatility. The two spider graphs below show the difference between the risk profile of an option strategy on the S&P 100 index and that of Madoff”s fund. One can see that Madoff’s absence of exposure to equity and volatility factors is inconsistent with the advertised strategy, which is mostly sensitive to US equity and equity volatility factors5. The graph below is the histogram of the observed “distance” 6 between the risk profiles of Long-Short Equity Hedge funds in the HFR database and Madoff’s profile. One can observe that the set of funds can be divided into two very distinct buckets: funds whose risk profile is close to that of Madoff and the others. It appears that funds close to Madoff were either directly managed by Bernard Madoff, or were feeders of his funds. Looking closely at their returns, we see that they are all highly correlated – typically above 95% correlation between any two of them – with similar performances, except two of them: LACM and Santa Clara, that seem to have invested in Fairfield Sentry with a leverage of 2. It turns out that the only way for any manager/investor to replicate Bernard Madoff’s performance was to invest in his funds. 5 Exposure to credit is the result of the well-known link between credit spreads and equity volatility 6 The “distance” between the risk profiles of two funds A and B can be seen as the mean-square difference between alternative betas of the two funds with respect to a large set of risk factors. It is a weighted average of the squared difference of sensitivities of A and B respectively to a list of market factors, weighted by the relevance of each factor in the risk of the funds. If a factor is irrelevant, it has no weight in the distance. If a factor is relevant for a fund and not for the other one, the distance increases. If it is relevant for both, but the funds in question have very different betas with respect to this factor, the distance will also be increased by this difference.
The Madoff Case: FoFiX Bias Ratio

                                                        Distribution of Risk Profile Distance to Madoff in the HFR database

                        700

                        600

                        500

                                                                                      Other funds
      Number of Funds

                        400

                        300

                                     Madoff feeders
                        200

                        100

                          0
                              0.2%   0.4%   0.6% 0.8%    1.0% 1.2%   1.4% 1.6%   1.8% 2.0%   2.2%   2.4%   2.6%   2.8% 3.0%   3.2%   3.4%   3.6% 3.8%   4.0% 4.2%   4.4%

                                                      Risk Profile Distance to Madoff (mean-square difference in alternative betas)

Further analyzing Madoff’s performance, we found it to be quite unstable: factors to which it is sensitive tend to
change from month to month, which is surprising given that the strategy announced is stable with very little space for
discretionary choices. Of course, all the funds that had a similar risk profile at a given date would follow exactly the
same wandering path, for a simple reason: they all have invested in Madoff Investments Securities LLC. In other
words, we have a cluster of funds that follow an improbable path along the possible risk profiles, and that is followed
by no other fund, even temporarily. Moreover, these risk profiles are a total mismatch for the advertised trading
strategy.
The Madoff Case: FoFiX Bias Ratio
Conclusion:
Properly used, quantitative risk systems provide an unprecedented insight into funds actual behaviour and their
consistency with declared strategy – this is the lesson fund managers must learn. The Madoff case also shows that
quantitative risk assessment must become central not only to investors, but to the SEC’s approach to risk
management. While the Bias Ratio may not detect all types of fraud, along with Risk Profiling it is a very accurate
instrument to check the likeliness of posted returns, and verify the consistency of actual performances vs. managers’
statements. The Bias Ratio can easily be applied by the SEC in the same manner as the Benford’s Law is used by the
IRS – a selective tool to spot a possible fraud. Combined with Risk Profiling and Strategy Description Analysis, the
Bias Ratio may well be the most effective instrument of fraud detection.
The fact that so many investors, including some quantitative ones were exposed to Madoff’s funds shows that not only
the technique, but the very place of risk management in the investment process has to be reevaluated. To begin with,
it demonstrates the fundamental need for independent risk management, preferably with the third party risk
management tools (as opposed to in-house); indeed, only these can be considered as unbiased and all-time reliable,
not exposed to the risk of over-confidence. Independent risk management is the key to successful investment and it
needs to be independently assessed on all levels. Risk management should also go beyond basic risk indicators
because they may not adequately capture the true portfolio situation. Lip service to risk control and colorful charts in
the annual report will never replace hands-on approach to risk. A minimum check-list of risk indicators should be
required by investors, who in turn should be equipped with necessary tools to verify and challenge managers’ reports.
To prevent the next Madoff scandal, the industry standard should not settle for less than an independent truly
decision-supporting risk management that relies on adequate quantitative instruments at all stages of the investment
process.
.
About RISKDATA:
Riskdata’s mission is to support alternative investors and managers in producing robust, risk-transparent, and
differentiated performance by providing complete, effortless, and continuously evolving risk solutions.
Riskdata is the leading provider of expert risk management solutions developed specifically for the global alternative
investment community. Riskdata’s comprehensive solutions enable investment managers to proactively manage
and control credit and market risk, while mitigating systemic and model risk through an independent, efficient, and
objective approach.
Riskdata’s reporting tools also provide investment managers and their clients with detailed and highly customizable
reports allowing them to achieve a comprehensive and decision-oriented risk transparency.
Riskdata is the only dedicated risk management service provider that manages both systematic and specific risk by
combining the market expertise of a professional team of daily market watchers with state-of-the-art quantitative
software to support sustainable diversified growth for the alternative investment community, while minimizing
systemic risk.You can also read