The Most Dangerous Equation - Ignorance of how sample size affects statistical variation has created havoc for nearly a millennium
←
→
Page content transcription
If your browser does not render page correctly, please read the page content below
The Most Dangerous Equation
Ignorance of how sample size affects statistical variation
has created havoc for nearly a millennium
Howard Wainer
W liat constitutes a dangerous equation?
There are two obvious interpretations:
Some equations are dangerous if you know
hind which lies terrible peril. The obvious win-
ner in this is Einstein's iconic equation e = nic~,
for it provides a measure of the enormous
them, and others arc dangerous if you do not. energy hidden within ordinary matter. Its
The first category may pose danger because destructive capability was recognized by Leo
the secrets within its bounds open doors be- Szilard, who then instigated the sequence of
!'.• The Goldsmiths't!iiiiipLii f;p fi
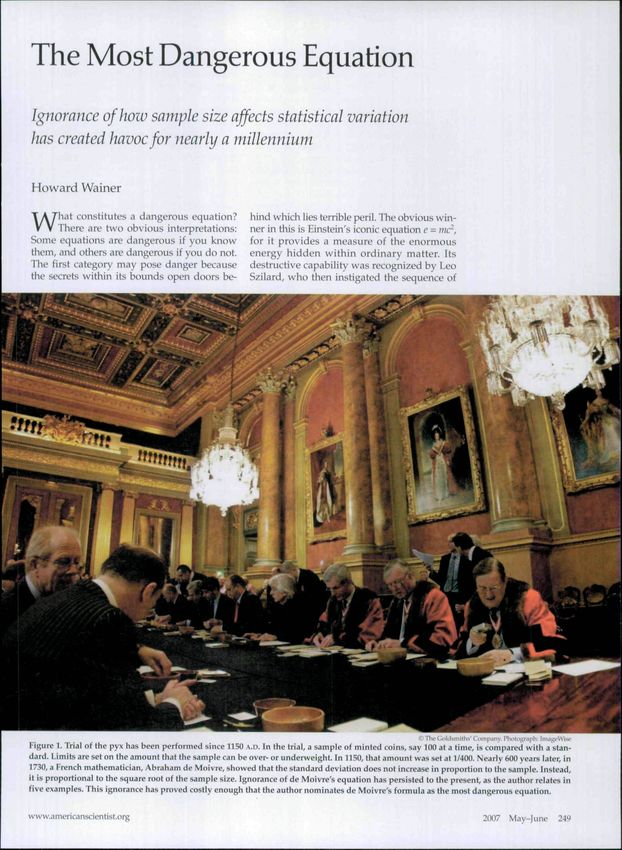
Figure 1. Trial of the pyx has been performed since 1150 A.D. In the trial, a sample of minted coins, say 100 at a time, is compared with a stan-
dard. Limits are set on the amount that the sample can be over- or underweight. In 1150, that amount was set at 1/400. Nearly 600 years later, in
1730, a French mathematician, Abraham de Moivre, showed Ihat the standard deviation does not increase in proportion to the sample. Instead,
it is proportional to the square root of the sample size. Ignorance of de Moivre's equation has persisted to the present, as the author relates in
five examples. This ignorance has proved costly enough that the author nominates de Moivre's formula as the most dangerous equation.
www.americanscientist.org 2007 May-June 249
events that culminated in the construction of             has been selected—and if we have an inappro-
                            atomic bombs.                                             priate set, our interpretations are questionable.
                               Supporting ignorance is not, however, the di-          It is dangerous, ironically, because it can be the
                            rection I wish to pursue—^indeed it is quite the          most useful model for the widest variety of
                            antithesis of my message. Instead I am inter-             data when wielded with caution, wisdom and
                            ested in equations that unleash their danger not          much interaction between the analyst and the
                            when we know about them, but rather when                  computer program.
                            we do not. Kept close at hand, these equations                Yet, as dangerous as Kelley's equation and
                            allow us to understand things clearly, but their          the common regression equations are, I find
                            absence leaves us dangerously ignorant.                   de Moivre's equation more perilous still. I ar-
                               There are many plausible candidates, and               rived at this conclusion because of the extreme
                            I have identified three prime examples: Kel-              length of time over which ignorance of it has
                            ley's equation, which indicates that the truth            caused confusion, the variety of fields that
                            is estimated best when its observed value is              have gone astray and the seriousness of the
                            regressed toward the mean of the group that               consequences that such ignorance has caused.
                            it came from; the standard linear regression                  In the balance of this essay I will describe
                            equation; and the equation that provides us               five very different situations in which igno-
                            with the standard deviation of the sampling               rance of de Moivre's equation has led to bil-
                            distribution of the mean—what might be                    lions of dollars of loss over centuries yielding
                            called de Moivre's equation:                              untold hardship. Tliese are but a small sam-
                                                                                      pling; there are many more.
                                                a ^ =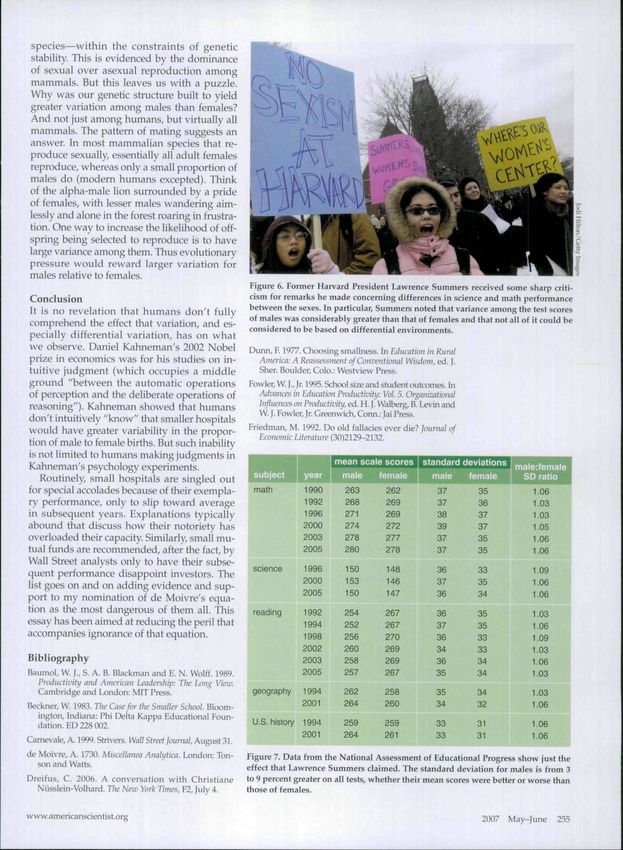
Figure 2. A cursory glance at the distribution of the U.S. counties with the lowest rates of kidney cancer (teal) might lead one to conclude that
something about the rural lifestyle reduces the risk of that cancer. After all, the counties with the lowest 10 percent of risk are mainly Midwest-
ern, Southern and Westem counties. When one examines the distribution of counties with the highest rates of kidney cancer (red), however,
it becomes clear that some other factor is at play Knowledge of de Moivre's equation leads to the conclusion that what the counties with the
lowest and highest kidney-cancer rates have in common is low population—and therefore high variation in kidney-cancer rates.

overweight coins, melt them down and recast         of the rural lifestyle—no access to good medi-
them at the correct lou-er weight. This would       cal care, a high-fat diet, and too much alcohol
leave the balance of gold as an excess payment      and tobacco.
to the mint. The fact that this error continued for    What is going on? We are seeing de Moivre's
almost 600 years pro\ndes strong support for de     equation in action. The variation of the mean
Moivre's equation to be considered a candidate      is inversely proportional to the sample size, so
for the title of most dangerous equation.           small counties display much greater variation
                                                    than large counties. A county with, say, 100
Life in the Country: Haven or Threat?               inhabitants that has no cancer deaths would
Figure 2 is a map of the locations of of counties be in the lowest category. But if it has 1 cancer
with unusual kidney-cancer rates. Tlie coun- death it would be among the highest. Counties
ties colored teal are those that are in the lowest like Los Angeles, Cook or Miami-Dade with
tenth of the cancer distribution. We note that millions of inliabitants do not bounce around
these healthful counties tend to be very rural, like that.
Midwestern, Southern or Western. It is both            Wlien we plot the age-adjusted cancer rates
easy and tempting to infer that this outcome is against county population, this result becomes
directly due to the clean living of the rural life- clearer still (see Figure 3). We see the typical
style—no air pollution, no water pollution, ac- triangle-shaped bivariate distribution: When
cess to fresh food without additives and so on.     the population is small (left side of the graph)
   Tlie counties colored in red, however, belie there is wide variation in cancer rates, from 20
that inference. Although they have much the per 100,000 to 0; when county populations are
same distribution as the teal counties—in fact, large (right side of graph) there is very Uttle
they're often adjacent—they are those that variation, with all counties at about 5 cases per
are in the highest decile of the cancer distribu- 100,000 of population.
tion. We note that these unhealthful counties
tend to be very rural, Midwestern, Southem
                                                    The Small-Schools Movement
or Westem. Tt would be easy to infer that this
                                                    Tlie urbanization that characterized the 20th
outcome might be directly due to the poverty
                                                    century led to the abandonment of the rural

www.americansdentist.org                                                                                                  2007 May-June       251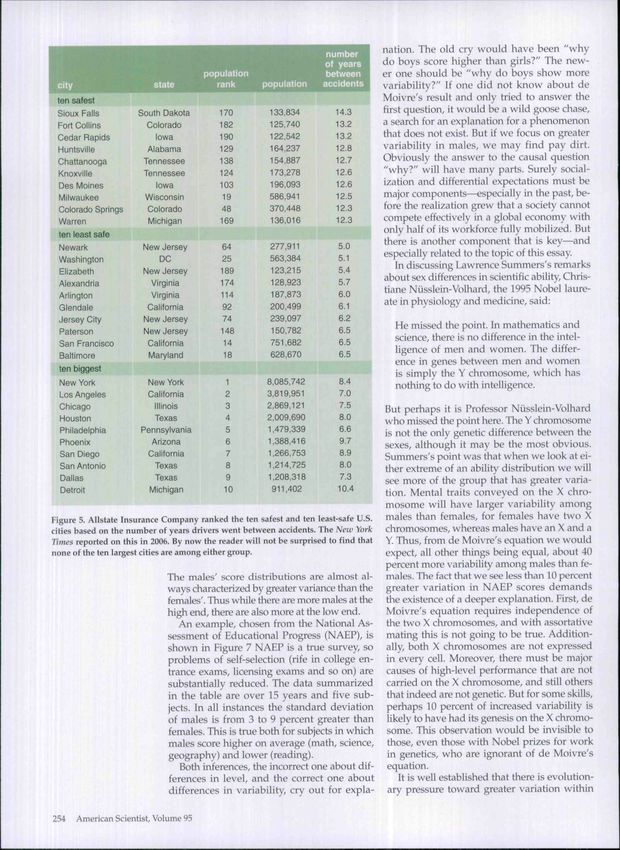
20 1               •                                                 schools, there is an unrepresentatively large
                                                                                        proportion of smaller schools.
                                                  •                                        In an effort to see the relation between small
                                                          •                             schools and achievement, Harris Zwerling and
                                              •       • •                               I looked at the performance of students at all
                   15 -                   •            ••
                                                                                        of Pennsylvania's public schools, as a function
                                                      •       •   •                     of school size. As a measure of school perfor-
                                                                                        mance we used the Pennsylvania testing pro-
                                                                                        gram (PSSA), which is very broad and yields
                   10 -                                                                 scores in a variety of subjects and over the en-
                                                                                        tire range of precoUegiate school years. Wlien
                                                                       •
                                                                                        we examined the mean scores of the 1,662
                                                                                        separate schools that provide 5th-grade-read-
                                                  a                        M    ^       ing scores, we found that of the top-scoring
              ra    5
                                                                       P                50 schools (the top 3 percent) six were among
                                                                                        the smallest 3 percent of the schools. This is
                                                                                        an over-representation by a factor of four. If
                                                                                        size of school was unrelated to performance,
                                                                                        we would expect 3 percent to be in this select
                                 1                    1——1—'~]             —1       1   group, yet we found 12 percent. The bivari-
                        102     103       10"                                           ate distribution of enrollment and test score is
                                                          population
                                                                                        shown in Figure 4.
              Figure 3. When age-adjusted kidney-cancer rates in U.S. counties are         We also identified the 50 lowest-scoring
              plotted against the log of county population, the reduction of varia-     schools. Nine of tbese (18 percent) were among
              tion with population becomes obvious. This is the typical triangle-       the 50 smallest schools. This result is complete-
              shaped bivariate distribution.                                            ly consonant with what is expected from de
                              lifestyle and, with it, an increase in the size           Moivre's equation—smaller schools are expect-
                              of schools. The era of one-room schoolhouses              ed to have higher variance and hence should be
                              was replaced by one with large schools—often              over-represented at both extremes. Note that the
                              with more than a thousand students, dozens                regression line shown on the left graph in Figure
                              of teachers of many specialties and facilities            4 is essentially flat, indicating that overall, there
                              that would not have been practical without the            is no apparent relation between schcxil size and
                              enormous increase in scale. Yet during the last           performance. But this is not always true.
                              quarter of the 20th century, there were the be-              The right graph in Figure 4 depicts 11th-
                              ginnings of dissatisfaction with large schools            grade scores in the PSSA. We find a similar
                              and the suggestion that smaller schools could             over-representation of small schools on both ex-
                              provide a better education, in the late 1990s             tremes, but this time the regression line shows
                              the Bill and Melinda Gates Foundation began               a significant positive slope; overall, students
                              supporting small schools on a broad-ranging,              at bigger schools do better. This too is not un-
                              intensive, national basis. By 2001, the Foun-             expected, since very small high schools can-
                              dation had given grants to education proj-                not provide as broad a curriculum or as many
                              ects totaling approximately $1.7 billion. They            Wghly specialized teachers as can large schools.
                              have since been joined in support for smaller             A July 20, 2005, article in the Seattle Weekly de-
                              schools by the Annenberg Foundation, the                  scribed the conversion of Mountlake Terrace
                              Carnegie Corporation, the Center for Col-                 High School in Seattle from a large suburban
                               laborative Education, the Center for School              school with an enrollment of 1,800 students
                              Change, Harvard's Change Leadership Group,                into five smaller schools, greased with a Gates
                              the Open Society Institute, Few Charitable                Foundation grant of almost a million dollars.
                              Trusts and the U.S. Department of Education's             Although class sizes remained the same, each
                              Smaller Learning Communities Program. Tiie                of the five schools had fewer teachers. Students
                               availability of such large amounts of money              complained, "There's just one English teacher
                               to implement a smaller-schools policy yielded            and one math teacher ... teachers ended up
                               a concomitant increase in the pressure to do              teaching things they don't really know." Per-
                               so, with programs to splinter large schools              haps this anecdote suggests an explanation for
                               into smaller ones being proposed and imple-               the regression line in Figure 4.
                               mented broadly {New York City, Los Angeles,
                               Chicago and Seattle are just some examples).                Not long afterward, the small-schools move-
                                                                                        ment took notice. On October 26, 2005, The Se-
                                 What is the evidence in support of such a              attle Times reported:
                              change? There are many claims made about the
                              advantages of smaller schools, but I will focus              [t]he Gates Foundation amtounced last
                              here on just one—that when schools are smaller,              week it is moving away from its empha-
                              student achievement improves. The supporting                 sis on converting large high schools into
                              evidence for this is that among high-performing              smaller ones and instead giving grants

252   American Scientist, Volume 95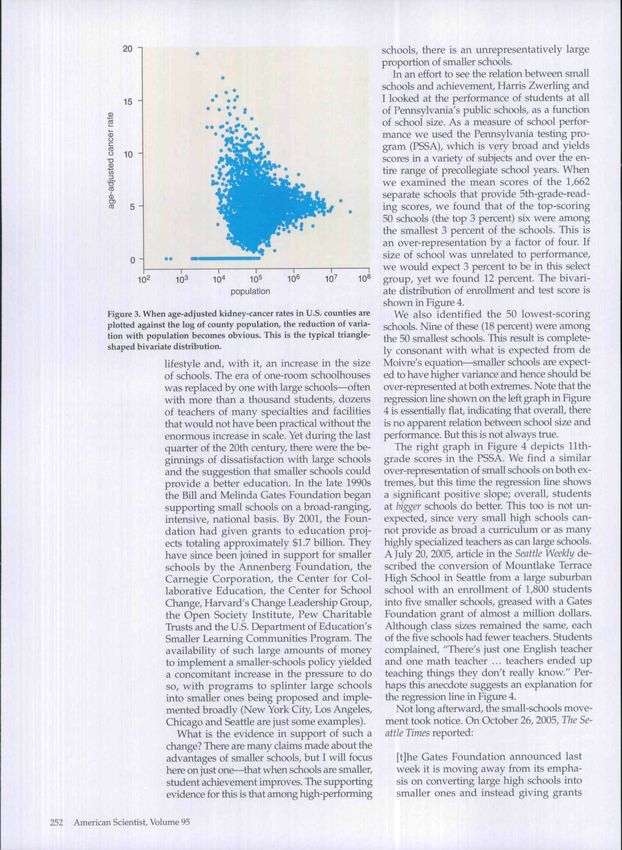
1,700-                                                                    1,800-H

    1.500-                                                                    1,600-

    1,300-                                                                £ 1.400-
                                                                          E

    1,100-                                                                £ 1.200-

     900-                                                                    1,000-

     700                                                                       800
                       300           600            900         1,200                       500      1,000      1,500     2,000     2,500    3,000
                                  enroilment                                                                 enrollment
Figure 4. In the 1990s, it became popular to champion reductions in the size of schools. Numerous philanthropic organizations and govern-
ment agencies funded the division of larger school based on the fact that students at small schools are over-represented in groups with high
test scores. Shown here at left are math test scores from 1,662 Pennsylvania 5th-grade schools. The 50 highest-performing schools are shown in
blue and the 50 lowest in green. Note how the highest- and lowest-performing schools tend to group at low enrollment—just what de Moivre's
equation predicts. The regression line is nearly flat, though, showing that school size makes no overall difference to 5th-grade mean scores.
Math scores for 11 th-grade schools were also calculated (right). Once again, variation was greater at smaller schools. In this case, however, the
regression line has a significant positive slope, indicating that the mean score improved with school size. This stands to reason, since larger
schools are able to offer a wider range of classes with teachers who can focus on fewer subjects.

   to Specially selected school districts with            ten most dangerous cities and the ten largest
   a track record of academic improv^ement                cities have no overlap (see Figure 5).
   and effective leadership. Education lead-
   ers at the Foundation said they concluded          Sex Differences in Performance
   that improving classroom instruction and           For many years it has been well established
   mobilizing the resources of an entire dis-         that there is an over-abundance of males at the
   trict were more important first steps to           high end of academic test-score distributions.
   improving high schools than breaking               About twice as many males as females re-
   down the size.                                     ceived National Merit Scholarships and other
                                                      highly competitive awards, Historically, some
   This point of view was amplified in a study observers used such results to make inferences
presented at a Brookings Institution Conference about differences in intelligence between the
by Barbara Schneider, Adam E. Wyse and Ve- sexes. Over the past few decades, however,
nessa Keesler of Michigan State University. An most enlightened investigators have seen that
article in Education Week that reported on the it is not necessarily a difference in level but a
study quoted Schneider as saying, "I'm afraid difference in variance that separates the sexes.
we have done a terrible disservice to kids."          Public observation of this fact has not always
   Spending more than a billion dollars on            been  greeted gently, witness the recent outcry
a theory based on ignorance of de Moivre's when Harvard (now ex-) President Lawrence
equation—in effect serving only to increase Summers pointed this out. Among other com-
variation—suggests just how dangerous that ments, he said:
ignorance can be.
                                                        It does appear that on many, many, dif-
The Safest Cities                                       ferent human attributes—height, weight,
In tlie June 18, 2006, issue of the New York            propensity for criminality, overall lQ,
Times there was a short article that listed the         mathematical ability, scientific ability—
ten safest United States, cities and the ten least      there is relatively clear evidence that
safe based on an Allstate Insurance Company             whatever the difference in means—which
statistic, "average number of years between             can be debated—there is a difference in
accidents." The cities were drawn from the 200          standard deviation/variability of a male
largest dties in the U.S. With an understand-           and female population. And it is true
ing of de Moivre's equation, it should come as          with respect to attributes that are and are
no surprise that a list of the ten safest cities, the   not plausibly, culturally determii^ed.

www.americanscientist.org                                                                                                 2007    May-June    253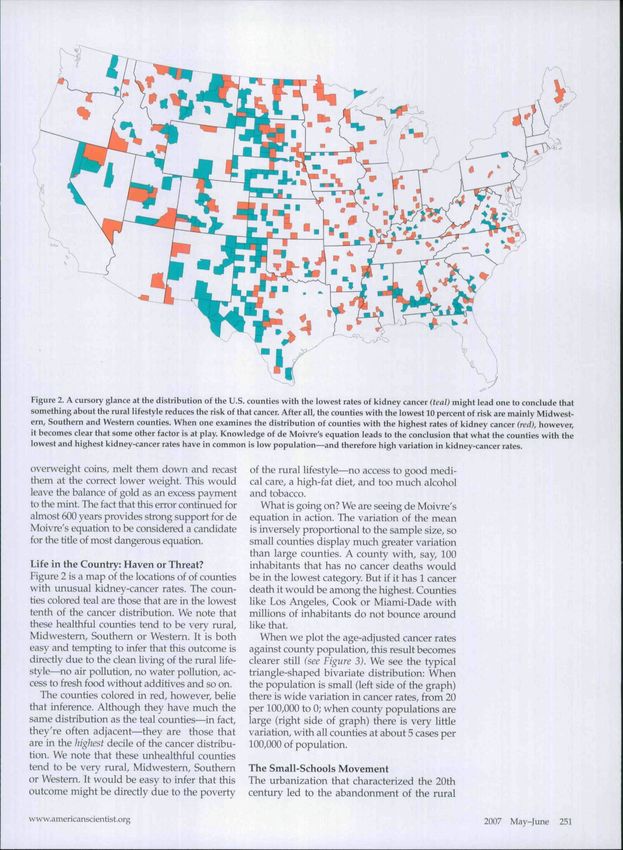
nation. The old cry would have been "why
number
of years do boys score higher than girls?" The new-
population between er one should be "why do boys show more
city state rank population accidents variability?" If one did not know about de
ten safest Moivre's result and only tried to answer the
Sioux Falls South Dakota 170 133,834 14.3 first question, it would be a wild goose chase,
Fort Collins Colorado 182 125.740 13.2 a search for an explaiitition for a pbenomenon
Cedar Rapids Iowa 190 122,542 13.2 that does not exist. But if we focus on greater
Huntsville Alabama 129 164.237 12.8 variability in males, we may find pay dirt.
Chattanooga Tennessee 138 154.887 12.7 Obviously the answer to the causal question
Knoxville Tennessee 124 173,278 12.6 "why?" will have many parts. Surely social-
Des Moines Iowa 103 196,093 12.6 ization and differential expectations must be
Milwaukee Wisconsin 19 586,941 12.5 major components^—especially in the past, be-
Colorado Springs Colorado 48 370,448 12.3 fore the realization grew that a society cannot
Warren Michigan 169 136,016 12.3 compete effectively in a global economy witb
ten least safe
only half of its workforce fully mobilized. But
277,911 5.0
there is another component that is key—and
Newark New Jersey 64
563,384 5.1
especially related to the topic of this essay.
Washington DC 25
123,215 5.4
In discussing Lawrence Summers's remarks
Elizabeth New Jersey 189
128.923 5.7
about sex differences in scientific ability, Chris-
Alexandria Virginia 174
187,873 6.0
tiane Nusslein-Volhard, the 1995 Nobel laure-
Arlington Virginia 114
6.1
ate in physiology and medicine, said:
Glendaie California 92 200,499
Jersey City New Jersey 74 239,097 6.2
150,782 6.5
He missed the point. In mathematics and
Paterson New Jersey 148
751,682 6.5
science, there is no difference in the intel-
San Francisco California 14
ligence of men and women. The differ-
Baltimore Maryland 18 628,670 6.5
ence in genes between men and women
ten biggest is simply the Y chromosome, which has
New York New York 1 8.085,742 8.4 notliing to do with intelligence.
Los Angeles California 2 3,819,951 7.0
Chicago Illinois 3 2,869,121 7.5 But perhaps it is Professor Nusslein-Volhard
Houston Texas 4 2,009,690 8.0 who missed the point here. The Y chromosome
Philadelphia Pennsylvania 5 1,479.339 6.6 is not the only genetic difference between the
Ptioenix Arizona 6 1,388,416 9.7 sexes, although it may be the most obvious.
San Diego California 7 1.266,753 8.9 Summers's point was that when we look at ei-
San Antonio Texas 8 1,214,725 8.0 ther extreme of an ability distribution we will
Dallas Texas 9 1,208,318 7.3 see more of the group that has greater varia-
Detroit Michigan 10 911,402 10.4 tion. Mental traits conveyed on the X chro-
mosome will have larger variability among
males thiin females, for females have two X
Figure 5. Allstate Insurance Company ranked the ten safest and ten least-safe U.S.
cities based on the number of years drivers went between accidents. The Neiv York
chnimosomes, whereas males have an X and a
Times reported on this in 2006. By now the reader will not be surprised to find that Y. Thus, from de Moivre's equation we would
none of the ten largest cities are among either group. expect, all other things being equal, about 40
percent more variability among males than fe-
males. The fact that we see less than 10 percent
The males' score distributions are almost al-
greater variation in NAEP scores demands
ways characterized by greater variance than the
the existence of a deeper explanation. First, de
females'. Thus while there are more males at the
Moivre's equation requires independence of
high end, there are also more at the low end.
the two X chromosomes, and with assortative
An example, chosen from the National As-
mating this is not going to be true. Addition-
sessment of Educational Progress (NAEP), is
ally, both X chromosomes are not expressed
shown in Figure 7 NAEP is a true survey, so
in every cell. Moreover, there must be major
problems of self-selection (rife in college en-
causes of high-level performance that are not
trance exams, licensing exams and so on) are
carried on the X chromosome, and still others
substantially reduced. The data summarized
that Indeed are not genetic. But for some skills,
in the table are over 15 years and five sub-
perhaps 10 percent of increased variability is
jects. In all instances the standard deviation
likely to have had its genesis on the X chromo-
of males is from 3 to 9 percent greater than
some. This obser\'ation would be invisible to
females. This is true both for subjects in which
those, even those with Nobel prizes for work
males score higher on average (math, science,
in genetics, who are ignorant of de Moivre's
geography) and lower (reading).
equation.
Both inferences, the incorrect one about dif-
ferences in level, and the correct one about It is well established that there is evolution-
differences in variability, cry out for expla- ary pressure toward greater variation within
254 American Scientist, Volume 95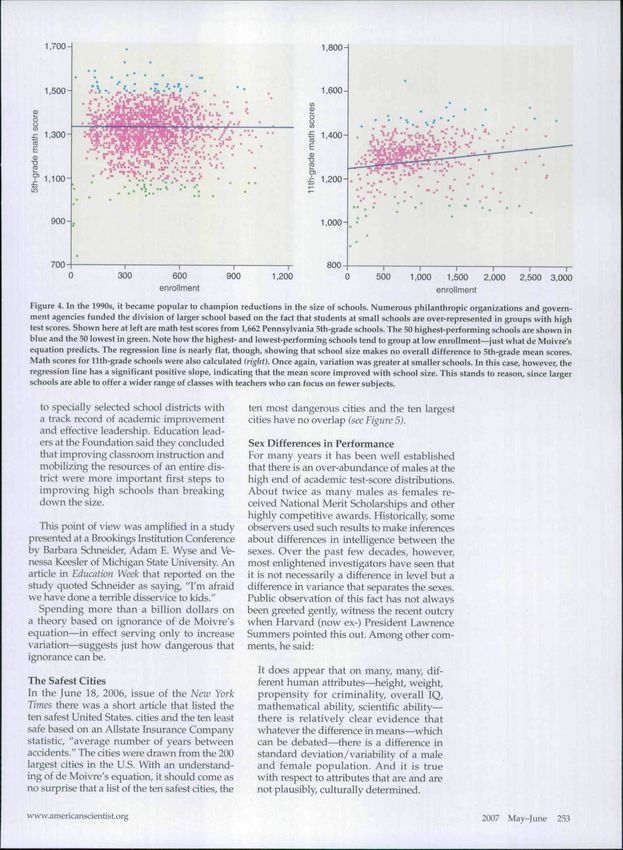
species—within the constraints of genetic
stability. This is evidenced by the dominance
of sexual over asexual reproduction among
mammals. But this leaves us with a puzzle.
Why was our genetic structure built to yield
greater variation among males than females?
And not just among humans, but virtually aU
mammals. The pattern of mating suggests an
answer. In most mammalian species that re-
produce sexually, essentially all adult females
reproduce, whereas only a small proportion ot
males do (modern humans excepted). Think
of the alpha-male tion SLirrounded by a pride
of females, with lesser males wandering aim-
lessly and alone in the forest roaring in frustra-
tion. One way to increase the likelihood of off-
spring being selected to reproduce is to have
large variance among them. Thus evolutionary
pressure would reward larger variation for
males relative to females.
                                                             Figure 6. Former Harvard President Lawreiuo Summers received some sharp criti-
 Conclusion                                                  cism for remarks he made concerning differences in science and math performance
 It is no revelation that humans don't fully                 between the sexes. In particular. Summers noted that variance among the test scores
                                                             of males was considerably greater than that of females and that not all of it could be
 comprehend the effect that variation, and es-
                                                             considered to be based on differential environments.
 pecially differential variation, has on what
 we obsen'e. Daniel Kahneman's 2002 Nobel                    Dunn, F. 1977. Choosing sm.illness. In Education in iiuml
 prize in economics was for his studies on in-                  Anuricn: A Reassestiiiifiit of Conveutioiml V^isdom, ed. J.
 tuitive judgment (which occupies a middle                     Shcr. Boulder, Colo.: West\-iew Press.
ground "between the automatic operations                     Fowler, W. J., jr. 1995. School size and student outcomes. In
of perception and the deliberate operations of                 Advances in Education Pwductivit}/: Vol. 5. Organizational
reasoning"), Kaluieman showed that humar^s                     Influences oji Prtxludivitif. ed. H. J. Walberg, B. Levin and
don't intviitively "know" that smaller hospitals               W. J. Fowler, Jr. Greenwich, Conn.: Jai Press.
would have greater variability in the propor-                Friedman, M. 1992. Do old fallacies ever die? journal of
tion of male to female births. But such inability               Economic Literature (30)2129-2132.
is not limited to humans making judgments in
Kalineman's psychology experiments.                                                  mean scale scores Standard deviations
                                                                                                                           male:female
    Routinely, small hospitals are singled out                subject       year      male    female     mate    female     SD ratio
for special accolades because of their exempla-               math          1990        263         262            37          35        1.06
ry performance, only to slip toward average                                 1992        268         269            37          36        1.03
in subsequent years. Explanations typically                                 1996        271         269            38          37        1.03
abound that discuss how their notoriety has                                 2000        274         272            39          37        1.05
overloaded their capacity. Similarly, small mu-                             2003        278         277            37          35        1.06
tual funds are recommended, after the fact, by                              2005        280         278            37          35        1.06
Wall Street analysts only to have their subse-
quent performance disappoint investors. The                   science       1996        150         148            36          33        1.09     j
list goes on and on adding evidence and sup-                                2000        153         146            37          35        1.06
port to my nomination of de Moivre's equa-                                  2005        150         147            36          34        1.06
tion as the most dangerous of them all. This                  reading       1992        254         267            36          35        1.03
essay has been aimed at reducing the peril that
                                                                            1994        252         267            37          35        1.06
accompanies ignorance of that equation.
                                                                            1998        256         270            36          33        1.09
                                                                            2002        260         269            34          33        1.03
Bibliography                                                                2003        258         269            36          34        1.06
Baumol, W. J., S. A. B. Blackman and E. N. Wolff. 1989.                     2005        257         267            35          34        1.03
   Pwtiiictivit}/ mni Aiiienavi leadership: The Um^ Vieiv.
   CiiiTibridge and London: MIT Press.                        geography     1994        262         258            35          34        1.03
Beckner, W- 1983. The Case for the Simller School. Bloom-                   2001        264         260            34          32        1.06
  ington, Indiana: Phi Delta Kappa Educadona! Foun-
  dation. HD 228 002.                                         U.S. history 1994         259         259            33          31        1.06     j
                                                                           2001         264         261            33          31        1.06    3
Camevale, A. 1999. Sfrivers. Wall Street fourim!. AugList 31.
de Moivre, A. 1730, Miscellanea Analytica. London: Ton- Figure 7. Data from the National Assessment of Educational Progress show just the
   son and Watts.                                       effect that Lawrence Summers claimed. The standard deviation for males is from 3
Dreifus, C. 2006. A conversation with ChHstiane to 9 percent greater on all tests, whether their mean scores were belter or worse than
   Niisslein-Viilhard. The New York Times, F2, July 4.  those of females.

www.americanscientist.org                                                                                                      2007 May-June    255
Geballe, B. 2005. Bill Gates' Guinea pigs. Seattle Weekly, 1-9.     2006-2007, ed. T. Loveless and F. Hess. Washington:
                                                                                               Brookings Institution.
                           Gelman, A., and D. Nolan. 2002. Tc-admifi Slatlstics: A
                             B(7j; of Tricks. Oxford: Oxfoi'd University Press.              Secrist, H. 1933. The Triumph of Mediocrity in Business.
                                                                                                Evanston, 111.: Bureau of Business Research, North-
                            Hotelling, H. 1933. Review of The Triumph of Medioa-ihi
                                                                                                western University.
                              ill Business, by H. Secrist. ]ournal of the American Stn-
                              Hsfical Association (28)463-465.                               Sharpe, W. F. 1985. Investments. Englewood Cliffs, N.J.:
                                                                                               i'rentice-Hail.
                            Howley, C. B. 1989. Syntliesis of the effects of school and
                              district size: Wh.it research say^ about achievement           Stigler, S. 1997. Regression toward the mean, historically
                              in small schcxil.s and school districts, loiirnn! of Rural        considered. Statistical Methods in Medical Research
                              ami Small Schools                                                 6:103-114.
                            KaiTiicman, D. 2002. Maps of bounded rationality: A              Stigler, S. M. 1999. Statistics on the Table. Cambridge,
                              perspfc'Cti\'e on intuitive judgment and choice. Nobe!            Mass.: Harvard University Press.
                              Prize Lecture, December 8, 2002, Stockholm, Swe-
                                                                                             ViadtTo, D. 2006. Smaller not necessarily better, school-
                              den. httpV/notielprize.org/nobeLprii^es/econom-
                                                                                                size study concludes. Education Week 25(39):12-13.
                              ics / la urea tes/ 2002 / kahnetnan-lecture.htm 1
                                                                                             Wainer, H., and L. Brown. 2007. Three statisHcal para-
                            Kelley, T. L. 1927. The hiterprciation of Eihicatioml Mea-         doxes in the interpretation of group differences: Illus-
                              surements. New York: World Book.                                 trated with medical school admission and licensing.
                            Kelley, T L. 1947. Fundamentals of Statistics. Cambridge:          In Handbook of Statistics {Volume 27) Psi/chometrics,
                               Harvard University Press.                                       ed. C. R. Rao and S. Sinharay. Amsterdam: Elsevier
                                                                                               Science.
                            King, W. I. 1934. Review of The Triumph of Mediocrity
                              in Business, by H. Secrist. loiirnal of Political Economif     Wainer, H., and H. Zwerling. 2006. Logical and empiri-
                              (4)2:398-4^)0. '                                                 cal evidence that smaller schools do not improve stii-
                                                                                               dent achievement. Vie Phi Delta Kappnii 87:300-303.
                            Laplace, Pierre Simon. 1810. Memoire sur !es approxi-
                              mations des formulas qui sent functions de tres-               Williamson, J.G. 1991. Productivity and American lead-
                              grand nombres, et sur leur application aux probabili-            ership: A review article, jonrml of Economic Literature
                              ties. Mcmoiref do In citjsse des sciences matliemntiques         29(1 ):51-68.
                              et physiques de I'histitut de Trance, annev 1809, pp.
                              3 5 3 4 l 5 , Supplement pp. 559-565.
                            Larson, R. L. 1991. Small is beautiful: Innovation from
                               the inside out. Phi Deltn Kappan. March, pp. 550-554.
                            Maeroff, G. 1. 1992. To Improve schools, reduce their                  For relevant Web links, consult this issue of
                              size. College Board News 20(3):3.                                             American Scientist Online:
                            Mills, F. C. 1924. Statistical Methods Applied to Economics                 http://www.americanscientist.org/
                              and Business. New York: Henry Holt.                                              Issue TOC/issue/961
                            Mosteller, R, and J. W. Tukcy. 1977. Data Analysis and
                              Regression. Reading, Mass.: Addison-Wesley.
                            Schneider, B., A. E. Wyse and V. Keesler. 2007. Is small
                              really better? In Brookings Papers on Educatio7i Polia/

256   American Scientist, Volume 95
You can also read