THE NETHERLANDS DRAFT BUDGET - SEPTEMBER 2021 - European Commission
←
→
Page content transcription
If your browser does not render page correctly, please read the page content below
DRAFT BUDGET

THE NETHERLANDS

SEPTEMBER 2021
INTRODUCTION

In this Draft Budgetary Plan, the government presents its economic and budgetary prospects. The
European Commission and European Council use the Draft Budgetary Plan to assess whether the
Netherlands is compliant with the requirements of the Stability and Growth Pact (SGP), which
contains the European budgetary rules. Due to the exceptional crisis caused by COVID-19, the
general escape clause has been activated, allowing Member States to respond appropriately to the
crisis.

By virtue of the government’s outgoing status, this Draft Budget Plan is different from the usual one
and the government is more cautious on a number of dossiers. At the same time, the government
takes a number of measures which it considers necessary. Firstly, generic support packages are
being discontinued, but the government is still spending a great deal of money on maintaining jobs
and supporting incomes, helping employers to adapt and limiting long-term economic losses. In
addition, the government is investing in climate measures, over and above the existing climate policy.
Additional resources are also being allocated for combating subversive crime and providing proper
access to justice. Finally, the government is also taking steps to make the Netherlands less vulnerable
to suffering economic blows in the long term.

The economic and budgetary prospects are based on the Macroeconomic Outlook (MEV) and Medium-
term forecast (MLT) of the Netherlands Bureau for Economic Policy Analysis (CPB) and the 2022
Budget Memorandum (Miljoenennota 2022). A more detailed explanation on the government's policy
plans is available in the 2022 Budget Memorandum. The figures do not yet contain any data on the
European Recovery and Resilience Facility, as the plan for the facility will be submitted later by the
Netherlands.

Page 2 of 31                                                                       2022 Draft Budget
TABLE OF CONTENTS
Introduction........................................................................................................................ 2
Chapter 1: Macroeconomic forecast ...................................................................................... 4
Chapter 2: Budgetary Targets .............................................................................................. 8
Chapter 3: Expenditure and revenue projections at an unchanged policy scenario ..................... 12
Chapter 4: Expenditure and revenue targets ......................................................................... 13
Chapter 5: Discretionary budgetary developments................................................................. 14
Chapter 6: Possible links between the Draft Budgetary Plan and the targets set in country-specific
recommendations ............................................................................................................... 17
Chapter 7: Divergence from latest Stability Programme ......................................................... 21
Chapter 8: Distributional impact of most important expenditure and revenue measures ............. 22
Annex 1: Methodological aspects including forecast effects of aggregated budgetary measures for
economic growth ................................................................................................................ 23
Annex 2: Tables of Draft Budgetary Plan .............................................................................. 24
  Supplement to Table 1a. Number of guarantees launched/announced .................................... 30

  Supplement to Table 1b. Dutch guarantees relating to COVID-19 .......................................... 30

  Supplement to Table 1c. Other Dutch guarantees ................................................................ 31

Page 3 of 31                                                                                                 2022 Draft Budget
CHAPTER 1:
MACROECONOMIC FORECAST

Given the radical contact-restrictive measures, the economic loss to date is lower than
expected. During the first lockdown part of the social and economic life came to a standstill. Many
economic indicators nose-dived at an unparalleled rate, such as production statistics, confidence
indicators and worked hours (see Table 1.1). The downward trend of GDP in the second quarter of
2020 was the strongest decline in a quarter since monitoring started. 1 One quarter later, an easing
of the corona restrictions led to a record growth. So, the first half of the crisis was accompanied by
a vigorous economic fluctuation. During the second lockdown, the economic disruption was
considerably less severe. It seems that companies and households were better prepared when
restrictions were reinstated. In some part thanks to the creativity and adaptability of companies and
employees, production has remained at a relatively good level in many sectors. Due to the last corona
waves recovery was somewhat delayed, but not shattered. The economy has picked up since spring
and many of the indicators show positive figures again (see last column in Table 1.1). Despite these
positive macro-indicators, some entrepreneurs have indeed had to draw on their reserves, or are still
faced with restrictions and uncertainty.

Table 1.1 Indicators for corona restrictions 2 and the economy
                      Indicator                              2020Q1          2020K2           2020Q3          2020Q4           2021Q1          2021Q2

Lockdown index (Oxford)                                         16               71               45               64              78              67
Consumer confidence                                              -2              -27             -27              -27             -19              -6
Business confidence                                               6              -37             -19               -4              -6              2
World trade, volume (in million USD)                            361              322             359              373             386             391
Daily production of industrial sector (2015=100)                108               98             104              107             109             113
Bankruptcies                                                    801              847             572              483             407             381
Worked hours (in million hours)                                3467             3245            3428             3355            3404             3440
No. of workers (x 1000)                                        9052             8879            8907             8967            9010             9028
No. of unemployed (x 1000)                                      277              349             419              384             334             307

Bankruptcies are historically low despite the economic downturn. As a result of generous
corona support, the number of bankruptcies in 2020 was at its lowest level in twenty years. In August
2021, the lowest monthly figure was recorded since 1990. Partly as a result of the support measures,
income of all entrepreneurs rose slightly (by EUR 800 million in 2020), although the differences
amongst themselves are exceptionally large. Lifting the restrictions on the economy and scaling down
the support policy will allow the normal dynamics of business discontinuations and establishments to
resume again. This is paramount for the health, competitiveness and productivity of businesses in
the Netherlands in the long term.

1
 __This does not include the two world wars, there are no statistics for those periods.
2
 __Lockdown index (Oxford): an indicator for the severity of contact-restrictive measures, developed by the University of Oxford. This monitors 23 indicators
for various kinds of contact-restrictive measures and interprets them into an index figure for the Netherlands.
Consumer confidence (Statistics Netherlands): indicator of the share of consumers with positive expectations for the economy, at a value of 0 the share is
50%.
Business confidence (Statistics Netherlands): indicator for the share of companies with positive expectations
World trade (Statistics Netherlands): year-on-year development of world trade
Daily production of industrial sector (Statistics Netherlands): index for average production of industrial sector in the Netherlands, 2015=100
Bankruptcies (Statistics Netherlands): pronounced bankruptcies of companies and institutions (excluding sole proprietorships)
Hours worked (Statistics Netherlands), number of employed (Statistics Netherlands), number of unemployed (Statistics Netherlands): labour market indicators

Page 4 of 31                                                                                                                    2022 Draft Budget
Figure 1.1 Bankruptcies and discontinuations as a percentage of the number of
businesses, 12-month average
03% 0,20%
02%
0,15%
02%
0,10%
01%
0,05%
01%
00% 0,00%
2010 2011 2012 2013 2014 2015 2016 2017 2018 2019 2020 2021
Discontinuations Bankruptcies
Source: Statistics Netherlands
The economic situation of most households is stable; the consequences are most severe
for groups that were already vulnerable. Those more likely to be affected are young people, low-
skilled workers, people with a migration background and occupationally impaired people. These
groups are more likely to work with insecure contracts or work in sectors that have been severely
impacted. Corona has reduced the number of flexible workers (especially the on-call workers) and
the number of permanent contracts has risen slightly (see Figure 1.2). This does not alter the fact
that three-quarters of the people who found a new job last year are flexible workers. 3 The wage
support via the Temporary Emergency Bridging Measure to Preserve Employment (NOW) made it
possible for employers to continue paying wages. Partly as a result, the average available income
continued to grow (by 2.4% in 2020). Most households have saved extra money, but that does not
apply to everyone. Savings have increased, particularly of those with higher incomes who are more
often likely to have a permanent employment contract, but that does not apply to everyone either.
By contrast, many of the self-employed without staff and flexible workers have had to draw on their
savings.
__Decline in number of flexible workers levelled off after onset of the corona crisis, CBS (Statistics Netherlands), 2021.
3
Page 5 of 31 2022 Draft BudgetFigure 1.2 Working households by employment, year-on-year difference in thousands
300
200
100
0
-100
-200
-300
-400
2008 2010 2012 2014 2016 2018 2020 2021
permanent contract flexible contract
self-employed without staff other self-employed
total
Source: CPB
If the impact of the corona virus remains under control, the economy is expected to
recover rapidly. According to CPB Netherlands Bureau for Economic Policy Analysis, GDP is expected
to grow this year by 3.9% and by 3.5% in 2022. Despite the historically significant downturn in 2020,
GDP is expected to recover to pre-corona-crisis levels in the third quarter of 2021. That is much
faster than in previous major crises (see Figure 1.3). This rapid recovery is mainly due to the nature
of the corona crisis and to the direct, large-scale government support. Unlike in the financial crisis
(which led to a major downturn in 2009), so far there have been no significant capital losses in
households, nor problems with credit granting services. Obviously, this still depends on the further
evolution of the coronavirus. The rate of recovery does not prejudice the fact that this crisis has left
its mark and has altered the economy. A number of trends may have accelerated, such as remote
working and online shopping. Despite the rapid economic recovery, not all the economic growth
missed as a result of the pandemic will be recovered. The CPB has estimated the irrecoverable losses
at 1.5% of GDP.
Page 6 of 31 2022 Draft BudgetFigure 1.3 Number of years needed to recover GDP to pre-crisis level after the three
most profound crises monitored; the Great Depression, the Financial/Euro Crisis and the
Corona Crisis (T0=1929, 2009, 2020)
115
110
105
100
95
90
T-1 T0 T+1 T+2 T+3 T+4 T+5 T+6
Financial/Euro crisis Great Depression Corona Crisis
Source: CPB Netherlands Bureau for Economic Policy Analysis, Statistics Netherlands
The exceptional nature of this crisis makes the prospects more uncertain than would
otherwise be the case. Despite the extensive research work that has been undertaken, a pandemic
is still unknown territory for researchers and economic institutions. During the corona crisis, several
things have happened that had not been expected, such as rising prices for housing, declining
unemployment and a very low number of bankruptcies, in an historically shrinking economy. That
makes the forecasts for the coming year especially uncertain and makes new surprises more likely.
As the previous course of the pandemic shows, these surprises can be both positive as well as
negative. If consumers spend more of the additional funds saved during the corona crisis, this can
further boost the economy. Conversely, the crisis could persist longer if vaccines prove to be not
sufficiently effective against new variants of the coronavirus. 4 The development of inflation too –
which has recently increased substantially in several countries – is a source of uncertainty.
Contrasting corona policy worldwide, wavering travel advice, and disruptions in global freight flows
also continue to cause a strain on households and nationally and internationally operating businesses.
__2021 CPB June forecast, paragraph 4; alternative scenarios,
4
Page 7 of 31 2022 Draft BudgetCHAPTER 2:
BUDGETARY TARGETS
The consequences of the corona crisis led to an historically large budget deficit. The
government has taken greater emergency and support measures than ever before to limit the impact
of the corona crisis. Corona-related expenditure has not been at the expense of normal expenditure,
but has resulted in a negative budget balance and an increase in government debt. In 2021, the
general government balance is expected to result in -6.0% of GDP. In 2020, this balance amounted
to -4.3% of GDP. These are unprecedented historical deficits. Placing the corona expenditure outside
the budgetary framework is an exceptional choice, which the government has made consciously
because of this unique crisis. Due to the strong (current and expected) economic recovery and the
scale down in temporary support measures, the budget deficit is expected to recover relatively
quickly and reach -2.4% of GDP in 2022.
Figure 2.1. Development of government balance as a % of GDP
12
9
6
3
0
-3
-6 European
budgetary rule in
the SGP
-9
Source: CPB
Government debt remains within the bounds due to accumulated buffers. It is expected that
by the end of this year, government debt will be 57.8% of GDP and 57.7% of GDP in 2022.
Government debt has risen substantially compared to 2019. At that time, the debt ratio was still
48.6% of GDP. However, the level of debt has remained below the prescribed European criterion of
60%. In the years prior to the corona crisis, government debt decreased, causing a buffer in respect
of the prescribed European criterion. The increase in government debt has not had any consequences
for the creditworthiness of the Netherlands.
Page 8 of 31 2022 Draft BudgetFigure 2.2 Government debt in billions of euro (bar) and % of GDP (line)
80
EMU debt in
700 European
percentage of
budgetary rule in
GDP (right axis)
the SGP
60
525
40
350
EMU debt in
billions of euros
(left axis) 20
175
0 0
1970 75 80 85 90 95 00 05 10 15 20 25
Source: CPB
For Member States in the preventive arm, such as the Netherlands, a medium-term objective (MTO)
normally applies for the structural government balance up to -0.5% of GDP. As can be seen in Table
2.1, the projected structural government balance this year is -4.9% of GDP and -2.7% of GDP next
year. Hence, the Netherlands does not meet its MTO, but does shift it by a sufficient degree towards
the MTO. Besides, the general escape clause in the Stability and Growth Pact is currently in force,
which temporarily does not apply in respect of the structural government balance requirements. The
Netherlands will take de-activation of the general escape clause into account as from 2023, when
the economy has recovered to the pre-crisis level.
Table 2.1 Structural government balance
in % of GDP 2020 2021 2022
Actual general government balance -4.3 -6.0 -2.4
Cyclical component 2.3 1.0 -0.3
Extraordinary measures 0.0 0.0 0.0
Structural government balance -1.9 -4.9 -2.7
In the Netherlands, space has been created under the policy pursued in recent years to
cope with a possible shock in public finances. In recent years, the economy has been running
at full speed, resulting in budget surpluses. Under the system of trend-based fiscal policy, the level
of expenditure is largely fixed for the whole cabinet period. This also applies for policy-based
development of revenue. So, in principle, windfalls in the general government balance do not lead
to additional fiscal space in the budget, but rather ensure an accelerated accrual of buffers. As a
result, the debt decreased faster than was expected in the Coalition Agreement and fiscal space was
created for lesser times. By making use of this fiscal space to support the economy now, the
government contributes to stability and continuity. All public expenditure is expected to contribute
to a rapid recovery of the economy.
Although the increase in debt due to the corona crisis is significant in historical terms, it
does not directly lead to a level that is historically unusual or harmful to the economy. For
example, during the financial crisis, government debt in the Netherlands increased by 25 percentage
points, while the current corona crisis is likely to increase the debt ratio by about 10 percentage
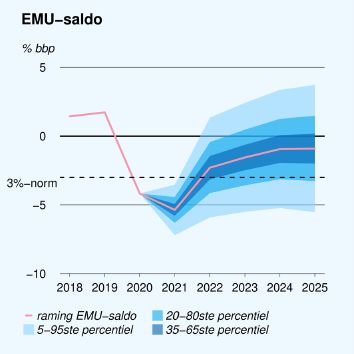
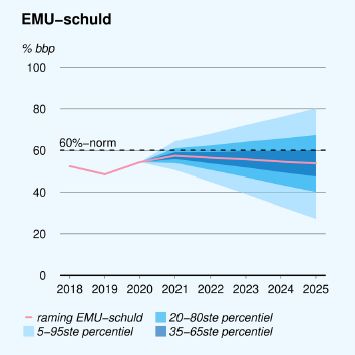
Page 9 of 31 2022 Draft Budgetpoints. In doing so, the extra billions could be borrowed at a negative interest rate thanks to the good credit rating of the Netherlands, the low interest rate worldwide, and ECB policy. However, the current negative interest rate does not mean that increasing the debt is risk-free. After all, interest rates may rise again. Additional risk arrangements amounting to about EUR 50 billion contribute to economic recovery during the corona crisis by eliminating uncertainty. The government is able to bear risks that the market cannot take on. Removing risks, ensures that financiers have the confidence to invest and lend out. This confidence effect is particularly strong during an economic crisis. The government has therefore deliberately chosen to extend existing risk arrangements and to introduce new conditions. Risk arrangements are understood to mean both loans and guarantees. A guarantee is a contingent liability of a party outside the government that the government takes over. A loan is an expenditure with a repayment obligation and a repayment schedule. Examples of this are the guarantees (EUR 2.2 billion) and loans to KLM (EUR 0.3 billion). Out of the EUR 50 billion additional risk arrangements as a result of the corona crisis, EUR 35 billion relate to contributing to guarantees of the European economic recovery. For 2022, the corona-related guarantees are expected to amount to approximately EUR 41 billion. Of this, EUR 33.2 billion consists of the European guarantees SURE (Support to mitigate Unemployment Risks in an Emergency) and NGEU (Next Generation EU). When the economy has found calmer waters after the corona crisis, by default the present risk of guarantees will return to the pre-crisis level. In 2020, the present risk of national guarantees was approximately 7% of GDP. The ‘no, unless policy’ ensures that after maturity of all corona-related guarantees in 2024, by default the present risk falls back to the level prior to 2020. In this way, during a subsequent crisis, the government can reinforce confidence in the economy with risk schemes, if necessary. Furthermore, an easing in the number of guarantees will reduce the risk to the budget. When a guarantee is invoked, the government must basically pay the account. Table 2.2 Development of present risk guarantees in % of GDP 2020 2021 2022 Public guarantees 29.2 24.8 23.6 Government guarantees: linked to corona crisis 6.3 4.9 4.6 Current forecasts show good prospects, but are surrounded by uncertainty. The economic picture may, of course, look different in forthcoming decades. CPB's analysis below shows this uncertainty, which is inherent to forecasts. 5 Figure 2.3 shows the margin of error of CPB's medium- term forecast in respect of the outcome of unchanged policy. This shows that there is about a 30% probability that government debt will end up between 45% and 60% of GDP until 2025 and a 90% probability that this will end up between 30% or 80% of GDP; more than 25 percentage points contrary to the current baseline. 5For a complete analysis: see the CPB debt forecast background document (2021), still to be published. Page 10 of 31 2022 Draft Budget
Figure 2.3 Major uncertainties in general government balance and general government
debt development

Source: CPB

The CPB's scenario analysis shows that the debt level can vary greatly in 2060 if the
underlying variables change. A possible increase in interest rates has a considerable impact on
future government debt. Table 2.3 shows the sensitivity to interest rates of debt in 2060. This shows
that the outcome of government debt can be considerably higher if any future interest level is higher.
However, the reverse is also true for a lower future interest level.

Table 2.3: Impact test of interest rate on public debt forecast 6
Alternative                                         2060 Public debt forecast (in % of GDP)
Baseline (interest on public debt = 0.6% )
                                        1
                                                    28%
2% interest on public debt                          41%
3% interest on public debt (=economic growth)       52%
4.5% interest on public debt (=discount rate)       78%
Source: CPB

The CPB states that if healthcare expenditure increases by 1% per year up to and including
2060 then presumably by consistent arrangements, government debt will increase by more
than 70 percentage points. In this scenario, according to the CPB, government debt would be almost
100% of GDP in 2060. However, this is a scenario in which no higher taxes or health and welfare
contributions would follow. According to the current system of expenditure-covering contributions,
higher growth of Healthcare Insurance expenditure (Zorgverzekeringswet, Zvw) would be covered
by additional contributions. Then the government debt would result in 71% of GDP and the tax
burden would be almost 3% of GDP higher. With full coverage through additional taxes and
contributions, taxes would be almost 6% of GDP higher and government debt would be 42% of GDP
in 2060. This shows how strong the long-term consequences can be of a higher rise in healthcare
expenditures.

The above scenarios show that it’s important to be careful in steering debt indicators for
the medium to long-term. This could lead to procyclical policies. Besides, the above scenarios are
not exhaustive. For example, the CPB states that economic growth, labour productivity and labour
participation can also be different, with varying impacts on public finances.

6 The interest rate here is based on the Ultimate Forward Rate (UFR), a method of approaching
long-term interest rates.

Page 11 of 31                                                                                 2022 Draft Budget
CHAPTER 3: EXPENDITURE AND REVENUE PROJECTIONS AT AN UNCHANGED POLICY SCENARIO Table 3.1 General government expenditure and revenue targets, broken down by main components. in % of GDP 2021 2022 General government (S.13) ESA Code 1. Total revenue at unchanged policy TR 42.88 42.2 Of which: 1.1. Taxes on production and imports D.2 12.1 12.1 1.2. Current taxes on income, wealth, etc. D.5 12.9 13.0 1.3. Capital taxes D.91 0.3 0.3 1.4. Social contributions D.61 13.4 12.9 1.5. Property income D.4 0.4 0.4 1.6. Other 3.6 3.5 p.m.: Tax burden 38.8 38.3 (D.2+D.5+D.61+D.91-D.995) 2. Total expenditure at unchanged policy TE 48.1 44.5 Of which: 2.1. Compensation of employees D.1 8.6 8.5 2.2. Intermediate consumption P.2 6.9 6.3 2.3. Social payments D.62 22.1 21.8 Of which: Unemployment benefits D.632 1.3 1.3 2.4. Interest expenditure D.41 0.5 0.4 2.5. Subsidies D.3 3.8 1.6 2.6. Gross fixed capital formation P.51 3.7 3.5 2.7. Capital transfers D.9 0.6 0.6 2.8. Other 1.9 1.7 Page 12 of 31 2022 Draft Budget
CHAPTER 4:
EXPENDITURE AND REVENUE TARGETS

Table 4.1 General government expenditure and revenue targets, broken down by main
components.

 in % of GDP                                             2021               2022
 General government (S.13)                    ESA Code
 1. Total revenue at unchanged policy           TR        42.8               42.2
 Of which:
 1.1. Taxes on production and imports           D.2       12.1               12.1
 1.2. Current taxes on income, wealth, etc.     D.5       12.9               13.0
 1.3. Capital taxes                             D.91      0.3                0.3
 1.4. Social contributions                      D.61      13.4               12.9
 1.5. Property income                           D.4       0.4                0.4
 1.6. Other                                               3.6                3.5
 p.m.: Tax burden                                         38.8               38.3
 (D.2+D.5+D.61+D.91-D.995)
 2. Total expenditure at unchanged policy       TE        48.1               44.5
 Of which:
 2.1. Compensation of employees                 D.1        8.6                8.5
 2.2. Intermediate consumption                  P.2        6.9                6.3
 2.3. Social payments                           D.62      22.1               21.8
 Of which: Unemployment benefits               D.632       1.3                1.3
 2.4. Interest expenditure                      D.41       0.5                0.4
 2.5. Subsidies                                 D.3        3.8                1.6
 2.6. Gross fixed capital formation             P.51       3.7                3.5
 2.7. Capital transfers                         D.9        0.6                0.6
 2.8. Other                                                1.9                1.7

Page 13 of 31                                                       2022 Draft Budget
CHAPTER 5:
DISCRETIONARY BUDGETARY DEVELOPMENTS

The corona crisis has had a major impact on the national budget and will still reverberate
in 2022. In 2020 and 2021, the government has so far spent almost EUR 70 billion on additional
corona-related expenditure to respond to the crisis as best as possible. Due to the increasing degree
of vaccination, contact restrictions are expected to be scaled down further. Yet next year, the
government will also support the economy and society with almost EUR 12 billion for expenditures
on corona measures. This includes funding to eliminate educational backlogs. During the corona
crisis, tax revenues declined somewhat and are expected to recover relatively quickly. Further,
additional expenditure has been earmarked for social challenges in the context of the climate
transition and digitisation.

Corona crisis emergency measures
The rate of recovery is possible thanks to the exceptionally wide-ranging and speedy
support from the government. When the economic situation deteriorates, the government
automatically spends more money. Revenue declines and social security benefits increase. Such
supposed automatic stabilisation, is normally the government’s most important instrument to
dampen the economy’s fluctuations. The government has also responded to this exceptional crisis
with unprecedented emergency and support measures, which have been necessary to minimise the
losses. This has meant large-scale intervention in the economy. Altogether, around EUR 80 billion in
emergency support was promised, of which about half will be spent in 2021. Support has been
exceedingly wide-ranging and made available to businesses and self-employed workers suffering
from the consequences of the corona crisis on accommodating terms. In this way, the government
supported businesses and workers who were restricted in their ability to trade by measures needed
to contain the virus.

Support measures were also put in place in the Caribbean Netherlands, in line with the
Netherlands in Europe. A corresponding package has been agreed with the countries of the
Kingdom of the Netherlands which includes reforms, investments and liquidity support to help the
islands through this crisis. The reforms for the range of countries should also ensure that public
finances end up on a sustainable pathway, so too in the long term, to increase the resilience of the
Caribbean in the event of a future crisis.

Extensive measures have also been taken on the revenue side. For instance, 128,000
companies have made use of the possibility of deferring the due payment of tax and social security
contributions. This concerns approximately EUR 12 billion in tax deferral; the bulk of which will be
collected later. In addition, the emergency packages contain tax measures to the extent of EUR 4.4
billion. Budget-wise, the creation of a corona tax reserve of EUR 3 billion within corporation taxes, is
the largest part of the tax measures.

In 2022, it is expected that no generic support package will be in force any longer. After a
period of approximately one and a half years of exceptional economic support, the generic part of
the support package will cease as at 1 October 2021. This means that the Temporary Emergency
Bridging Measure to Preserve Employment (NOW), Reimbursement of Fixed Costs (TVL), Temporary
Support Scheme for Self-Employed Persons (TOZO), Temporary Support for Necessary Costs (TONK)
schemes and various tax measures have not been extended. To facilitate the transition to the new
structural situation, a number of support schemes will still be in force to promote dynamism in the
labour market. In addition, some previously introduced corona support measures will continue in
2022.

In 2022, the corona-related expenditures are expected to amount to almost EUR 12 billion.
This EUR 12 billion mainly concerns a continuation of support of the NOW scheme (EUR 2.9 billion),
the provision of vaccines (EUR 0.6 billion) and implementation costs for various smaller schemes per

Page 14 of 31                                                                       2022 Draft Budget
budget. In addition, children and youths have suffered educational disadvantages during the corona
crisis. To limit the consequences of this, the National Programme for Education (NPO) has been
introduced. It is expected that about EUR 4 billion of this programme will be used in 2022.

Other budgetary measures
In addition to current climate policy, the government is investing more than EUR 6.8 billion
on climate actions. The package aims to heed the Urgenda judgment. It aims to achieve additional
carbon emission reductions and to work on the energy infrastructure of the future. The government
is aware of the fact that Dutch climate policy will need to be tightened further in the years ahead.
Measures currently being taken by the government make an important contribution to this. In
addition, it is important for the next government to draw up a balanced and integrated package.

The government is allocating EUR 1.3 billion to subsidies for hydrogen and heat
infrastructure projects. A government contribution is needed in these fields and an investment
decision is shortly expected. The government is reserving EUR 223 million to ensure that
implementation of existing climate policy remains on pace.

The government is investing EUR 1.5 billion on improving sustainability of the built
environment and in expanding and broadening its energy-saving obligation. This includes
the expansion of energy-saving obligations to ETS sectors, an expansion of tax advantages for
entrepreneurs to invest in environmentally-friendly techniques (increasing support percentages of
the environmental investment tax scheme for businesses (MIA)/arbitrary depreciation of
environmental investments (VAMIL), and temporary additional budget for the period 2022-2024), as
well as measures to accelerate the sustainability of owner-occupied and rental housing and social
housing.

The government is making EUR 100 million available per year for 10 years to stimulate
additional housing construction. This will sporadically be made available for additional housing
construction over a period of 10 years, not for the acceleration of existing projects.

The government is investing in strengthening the rule of law, by combating subversive
crime and providing proper access to justice. In this context, the government has decided to
spend EUR 554 million in 2022 on curbing organised, subversive crime on the one hand and providing
protection and security on the other to all those who need better protection during their work against
subversion.

In August, the government took additional decisions in terms of the burden for
entrepreneurs, citizens and housing corporations. The government has decided to use EUR 1
billion of the funds initially earmarked for the Job-related Investment Credit (BIK) to alleviate
employer's contributions. The remaining part of the employer's contributions relief (EUR 0.8 billion)
has been used elsewhere by the government. In this way, the government has structurally reduced
expenditure by EUR 226 million for minimum-income households, single earners and families. From
2022 onwards, the government is also structurally making funds available to reduce the landlord
levy by EUR 30 million. In addition, a new exemption of transfer tax is being introduced for
reacquisitions of dwellings that are subject to Sale under Specified Conditions (VoV).

Revenue
After a decline in policy-related expenses in 2021, expenditure will increase in 2022. In
recent years, the government has, on balance and in accordance with policy, reduced expenditure
for citizens and increased it for businesses. This year, the burden will decrease by EUR 1.5 billion
and will rise again in accordance with policy, by a total of EUR 3.2 billion in 2022. A major cause of
this tax burden is the discontinuation of fiscal coronavirus measures, such as exemption of low VAT
rates on face masks and care staff, among other things. Not including the phasing out of fiscal
coronavirus measures, the burden in accordance with policy is set to rise by another EUR 2.1 billion
in 2022. This tax burden is largely due to limitations in the loss setoff of corporation tax as from

Page 15 of 31                                                                      2022 Draft Budget
2022. This is a measure that had already been decided last year. Moreover, a few smaller measures
still have a tax-burdening effect, including the curtailment of extending the top rate tax point and
the gradual scale down of tax-deductible items to the basic rate.

In 2021, revenues increase by EUR 13 billion compared to 2020. This is primarily driven by
the economic recovery in 2021. This is reflected in Table 5.2. Endogenous growth is growth explained
by the general economic development, which amounts to EUR 9.1 billion. Policy measures result in
EUR 4.1 billion higher tax revenues on general government-based amounts compared to 2020. This
increase is largely due to the major extent of fiscal corona support in 2020, which is more limited in
2021.

Taxes and social security revenues will grow by EUR 19.4 billion in 2022. In part, there is a
documented explanation for this: the transformation of ProRail into an autonomous administrative
authority constitutes approximately EUR 7.3 billion in tax revenues, mainly as corporation tax and
dividend tax. However, this is offset by corresponding expenditure. In 2022, economic growth will
result in a firm revenue increase of EUR 12.5 billion. This increase is attributable to both indirect
taxes such as VAT and direct taxes such as the wage and income levy. Consumer spending continues
to recover as corona restrictions are lifted, and it is also expected that contractual wages will rise
further.

Taxes and social security revenues have declined less sharply due to the corona crisis than
initially estimated, but tax deferral is still an uncertain factor. On the revenue side of the
budget, taxes and social security revenues ‘fluctuate’ with the economy. This is called automatic
stabilisation. This often means that revenues drop severely in poor economic periods. After the
financial crisis, for example, it took until 2013 for revenues to reach the 2008 level again. The
exceptional measures to help entrepreneurs during the corona crisis have largely taken over the role
of the tax system as an automatic stabiliser. To help businesses, the Tax and Customs Administration
offers entrepreneurs an easily accessible deferral of payment for a wide range of taxes. This option
lapses on 1 October 2021, when entrepreneurs have to pay their current commitments again. As
from 1 October 2022, entrepreneurs will be given sixty months to pay off the accrued debt.

Table 5.2 Taxes and social security revenues 2020-2022
In billions of euro                                                 2020          2021          2022
Taxes and national social insurance contributions on
                                                                    231.0         242.2         259.1
general government-based amounts
of which taxes                                                      194.3         202.5         221.6
of which national social insurance contributions                     36.7          39.7          38.2
Employee insurance scheme contributions                              69.6          71.6          73.1
Total                                                              300.6         313.8         334.1
Change                                                                             13.2          20.4
of which endogenous growth                                                          9.1          13.2
of which policy measures                                                            4.1           7.2
Endogenous change (in %)                                                         3.00%         4.20%

Value development GDP (in %)                                                     6.20%         5.30%

Page 16 of 31                                                                      2022 Draft Budget
CHAPTER 6:
POSSIBLE LINKS BETWEEN THE DRAFT BUDGETARY PLAN
AND THE TARGETS SET IN COUNTRY-SPECIFIC
RECOMMENDATIONS
Country-specific recommendations
Country-specific Measures (specific progress)
recommendation number
2021 Country-specific recommendations
Country-specific Country-specific recommendations 1 & 2
recommendation 1: Budgetary policy
In 2022, pursue a supportive fiscal During the corona crisis, the government has consistently pursued
stance, including the boost a stimulating budgetary policy aimed at job retention, income
provided by the Recovery and support, and preventing bankruptcies and long-term economic
Resilience Facility, and preserve losses. In 2020 and 2021, the government spent almost EUR 70
nationally financed investment. billion on additional corona-related expenditure to respond to the
crisis as best as possible.
The fiscal policy stimulus is mainly due to the budget deficit and
general government balance. The debt level rose from 48.6% in
2019 to 57.8% in 2021. As a result of the increasing vaccination
Country-specific rate, contact-restrictive measures are being scaled down and the
recommendation 2: economy is reviving. The government considers the fiscal policy
When economic conditions allow, stimulus to be less needed in relative terms, but continues to
pursue a fiscal policy aimed at pursue ample fiscal policy to support the economy in this adaptive
achieving prudent medium-term phase. Part of the fiscal policy stimulus included bringing planned
fiscal positions and ensuring fiscal expenditure and investments forward from later years to 2021.
sustainability in the medium term. This also partly explains why the general government balance
deteriorated considerably in 2021 compared to 2020. A budget
deficit of 2.4% of GDP is also envisaged in 2022, which is
significantly improved due to rapidly recovering economic growth.
This ensures that fiscal policy continues to support the economy
and makes headway in the green and digital ‘twin transition’.
The Study Group on Fiscal Policy has advised to take the economic
and financial uncertainty in the aftermath of the corona crisis into
consideration. It is for this reason, that it has advised not to
intensify or cut-back expenditure compared with the projected
expenditure in the CPB's medium-term forecast. In this way, a
prudent budgetary policy is being put into effect, while there is still
room for extraordinary expenditure in combating the crisis.
Corona support and recovery packages
The government has deployed several support packages because
of the coronavirus. The measures are mainly aimed at job
preservation (NOW), reimbursement of fixed costs for businesses
(TVL) and providing income support to self-employed persons
(TOZO) and households (TONK).
Page 17 of 31 2022 Draft BudgetIn addition, there is additional support for sectors that are heavily
affected by contact restrictions. A package has also been provided
for social partners, municipalities, implementing organisations and
schools, providing for proper counselling from unemployment to
employment, for training, retraining and development, for
combating poverty and problematic debt, for tackling youth
unemployment and for protecting vulnerable groups in the labour
market.
In the Letter to Parliament dated 30 August 2021, the government
announced that it would not extend the generic support package
(NOW, TVL, TOZO, TONK and various tax measures) as from 1
October 2021. This letter also announced the government’s further
policy to improve transition to this new situation without generic
support. Part of the previously announced social package will also
continue at the end of 2021 and in 2022. 7 In 2022, the
government will support the economy by almost EUR 12 billion
worth of corona expenditure.
Recovery and Resilience Facility
The outgoing government believes that a solid and ambitious
national Recovery and Resilience Plan (RRP) is needed. To that
effect, a plan that will be fully endorsed by a future government,
which will implement the plan. At present, measures within the
framework of the RRP are part of the new government’s coalition
talks. The government aims to submit the Dutch plan in the spring
of 2022, in view of the time limits that apply for allocation of the
funds within the Recovery and Resilience Facility (RRF).
Growth Fund
In 2020, the government set up a National Growth Fund for public
investment in sustainable earning capacity. For this purpose, the
government makes an amount of EUR 20 billion available for a
period of five years as from 2021.
The fund aims to increase the sustainable earning capacity by
investing in knowledge development, research and development
and innovation, as well as infrastructure. In this way, we invest in
our productivity, which will enable us to increase our prosperity in
a broad sense and to address social challenges. In addition to the
envisaged effect on long-term growth, investment can also
contribute to economic growth and recovery in the short term.
An independent advisory committee advises the government on
the funding of proposals submitted. In the first and second round,
7 The letters to parliament on support packages can be consulted via the following links:
Letter to Parliament on emergency package for employment and economy | Parliamentary Paper |
Rijksoverheid.nl
Letter to Parliament on emergency package for employment and economy 2.0 | Parliamentary Pa-
per | Rijksoverheid.nl
Letter to Parliament on support and recovery package | Parliamentary Paper | Rijksoverheid.nl
Letter to Parliament on support and recovery package third quarter 2021 | Parliamentary Paper |
Rijksoverheid.nl
Letter to Parliament on support package in third quarter and announcement of support package
fourth quarter | Parliamentary Paper | Rijksoverheid.nl
Page 18 of 31 2022 Draft Budgetit concerns proposals developed by ministries (in conjunction with
stakeholders). From the third round onwards, it will be possible for
stakeholders to submit proposals directly to the fund. In the first
round, EUR 216 million of resources was allocated, EUR 430 million
was conditional and EUR 3.5 billion has been reserved.
Country-specific recommendation 3
Composition of public finances for sustainable and inclusive
recovery
Country-specific By virtue of the government’s outgoing status, this Draft Budget
recommendation 3: Plan is different from the usual one and the government is more
Pay particular attention to the cautious on a number of dossiers. In some areas, the government
composition of public finances, does take measures that it considers necessary, including climate
both on the revenue and policy.
expenditure side of the budget,
and on the quality of budgetary In addition to current climate policy, the government is investing
measures to ensure a sustainable more than EUR 6.7 billion on climate actions. This package aims to
and inclusive recovery. Prioritise implement the Urgenda judgment, to achieve additional emission
sustainable and growth-enhancing reductions and to work on the energy infrastructure of the future.
investment, notably supporting the Most of these funds, EUR 3 billion, will be allocated to an increase
green and digital transition. Give in the Stimulation of Sustainable Energy Production (SDE++)
priority to structural fiscal reforms subsidy. This scheme contributes to sustainability through
that help provide financing for incentives in various technologies in the built environment,
public policy priorities and mobility, greenhouse horticulture and industry. The government
contribute to the long-term will also allocate EUR 1.3 billion for hydrogen and heat
sustainability of public finances, infrastructure projects and earmarks EUR 600 million extra to
including the strengthening of provide incentives for zero-emission vehicles.
coverage, adequacy, and
sustainability of health and social Digital Skills
security systems for all. Initial education can provide a good contribution to the
development of digital skills. Therefore, specific strategies on
digital education are implemented in primary, secondary and
higher education. In addition, a multi-annual review of the
curriculum is currently being prepared, which should result in
enhanced education in digital literacy and skills.
The government has also continued the programme ‘Tel mee met
Taal’ [Be included with language], which aims to improve basic
skills (language, arithmetic and digital know-how) of adults and
thus accelerate the transition to digital skills.
Furthermore, the government has defined ‘Digital skills and
inclusion’ as one of the main priorities in the Dutch digitisation
strategy (2021). Part of the strategy is to support teachers in
improving their digital skills and improving digital teaching
resources. The government is also taking action to improve the
transition from education to the labour market. Regional
cooperation between education and entrepreneurs is thus
encouraged, through public-private partnerships.
Social security
The very low unemployment rate in the Netherlands, combined
with a high labour market participation, means that the
sustainability of social security, healthcare and pensions is
Page 19 of 31 2022 Draft Budgetsufficiently guaranteed, so too for the long term. Making the Dutch
pension system more future-proof by means of the new pension
contract, which was reported in 2020, also contributes significantly
to this. The draft legislative proposal for the new pension contract
has now been part of a public consultation, and the aim is that the
legislative proposal will enter into force in January 2023 after the
parliamentary debate, among other things.8
Sustainability in the long term
The Draft Budget Plan for 2022 shows that public finances are
expected to come out stronger after the corona crisis, but there
are risks and uncertainties. There are several challenges for sound
public finances: 1) The long-term development of public finances.
The expected increase in healthcare expenditure plays an
important role in this; 2) Dealing with long-term economic
uncertainties, such as uncertain interest rates and the economic
consequences as a result of a possible re-emergence of debt
problems in other European countries. When restrictions have
been lifted and the economy revives after the corona crisis, the
budgetary policy will be able to return to normal again. Long-term
prudent budgetary policy can provide the necessary buffers to deal
with these risks.
8See also the most recent Letter to Parliament Stand van zaken uitwerking pensioenakkoord
[Status on elaboration of pension agreement] | Lower House of the States General
Page 20 of 31 2022 Draft BudgetCHAPTER 7:
DIVERGENCE FROM LATEST STABILITY PROGRAMME
Public finances have marginally deteriorated compared to the 2021 Stability Programme.
Additional corona-related measures and other urgent dossiers, such as climate expenditures and the
combating of crime, have increased since the latest Stability Programme and have burdened the
balance further.
Table 7.1 Divergence from latest Stability Programme
2020 2021 2022
ESA % of
% of GDP % of GDP
Code GDP
Target general government
net lending/net borrowing B.9
Stability Programme -4.3 -5.9 -1.7
Draft Budgetary Plan -4.3 -6.0 -2.4
Difference 0.0 -0.1 -0.7
Since the 2021 Stability Programme, economic growth projections have improved.
Economic recovery in the Netherlands is stronger than anticipated, which has shifted the focus from
direct support measures to economic transitions, notably for climate and digitisation.
Difference in forecasts between the European Commission (EC) and the Netherlands
Bureau for Economic Policy Analysis (CPB)
EC - spring forecast EC - summer forecast Budget Memorandum
2021 2022 2021 2022 2021 2022
GDP growth 2.3% 3.6% 3.3% 3.3% 3.9% 3.5%
General government balance -5.0% -1.8% -6.0% -2.4%
Government debt 58.0% 56.8% 57.8% 57.7%
Source: EC, CPB
The EC is a little more pessimistic about growth in 2021 and 2022 compared to the CPB.
In fact, in the summer forecast, the EC assumed a growth of 3.3% of GDP for both 2021 and 2022.
The CPB, on the other hand, forecasts a growth of 3.9% in 2021 and 3.5% in 2022. A large part of
the higher growth forecast for 2021 is attributable to the higher (actual) recovery growth in recent
months.
The general government balance based on the CPB forecasts in the Budget Memorandum
is more negative than the European Commission’s spring forecast. For the years 2021 and
2022, the EC forecasts budget deficits of 5.0% and 1.8% of GDP, respectively. In contrast to rapidly
improving economic developments in 2021, there are additional corona measures and other urgent
dossiers, such as climate expenditures and the combating of crime that have increased since the
European Commission's spring forecast and burdened the balance further.
According to the CPB forecast, public debt in 2021 is lower than forecast in the European
Commission's spring forecast, but higher in 2022. According to the EC, the debt ratio would
reach 58.0% of GDP in 2021. The difference is partly the result of a denominator effect, as the
economy recovers faster according to the CPB forecast. Due to additional expenditure for urgent
dossiers and extended corona measures (for both 2021 and 2022), the debt ratio according to the
CPB forecast, will not decrease as much in 2022 than in the European Commission's forecast.
Page 21 of 31 2022 Draft BudgetCHAPTER 8:
DISTRIBUTIONAL IMPACT OF MOST IMPORTANT
EXPENDITURE AND REVENUE MEASURES
The development of purchasing power is more or less neutral. The impact of the corona crisis
on the economy has remained limited, partly because of the support packages. For example, the
impact on unemployment and on spending power have remained limited. The purchasing power
effect shows how average disposable income of households develops. The purchasing power effect
assumes that nothing changes in the personal circumstances of households (also referred to as static
purchasing power). The purchasing power effect is slightly positive. Of the example households
shown below, only the single-income households will experience a relatively worse position, which is
attributable to the scale down in transferability of the general tax credit. The government has taken
a number of minor measures to ensure that the development in purchasing power is balanced. For
example, healthcare allowances and the child-related budget have been intensified to include support
to minimum-income households and single-income households, and the employed person's tax credit
for single-income households and higher incomes is being scaled down more slowly.
Table 8. Development in purchasing power for various household groups (%)
2022
Income group
1st 0.2
2nd 0.1
3rd 0.1
4th 0.1
5th 0.0
Source of income
Working households 0.1
Benefit recipients 0.2
Pensioners 0.1
Household type
Double-income households 0.1
Single householders 0.1
Single-income households -0.1
Family composition
With children 0.1
Without children 0.1
All households 0.1
Page 22 of 31 2022 Draft BudgetANNEX 1:
METHODOLOGICAL ASPECTS INCLUDING FORECAST
EFFECTS OF AGGREGATED BUDGETARY MEASURES FOR
ECONOMIC GROWTH
Table B1.1 Methodological aspects
Steps of the budgetary
process for which it was Relevant features of the
Estimation technique used model/technique used
SAFFIER II Macro forecast for the Dutch Macro-econometric model
economy in the short and
medium term
MIMOSI Forecasts of purchasing power, Micro simulation model
employee costs, social security
and personal income tax
MICSIM Forecast of policy effects on General equilibrium model
structural labour supply
ISIS Forecast trend structural labour HP-filter
supply
TAXUS Short and medium term forecast Detailed forecast tax revenue
of tax revenue (with the
exception of personal income
tax)
ZOEM Forecast of healthcare Arithmetic model for employment
expenditure and employment in in healthcare sector and for
healthcare sector healthcare expenditure in the
short and medium term
Government account Forecast of government Detailed arithmetic model for
employment, public expenditure government employment and for
and revenue, with the exception total public finances in the short
of taxes, healthcare and social and medium term
security
EVIEWS in combination with Forecast output gaps Econometric model
EC software
Modelling tools may have been used:
- when compiling macro forecasts
- when estimating expenditure and revenue at an unchanged policy scenario
- when estimating the distributional impact of the main expenditure and revenue measures
- when quantifying the expenditure and revenue measures to be included in the Draft Budget
- when estimating how reforms included in the Draft Budgetary Plan address targets set by
the Union's Strategy for growth and jobs and the country-specific recommendations.
Page 23 of 31 2022 Draft BudgetANNEX 2:
TABLES OF DRAFT BUDGETARY PLAN
Table 0.i) Basic assumptions
In % 2019 2020 2021
Short-term interest rate (annual average) -0.4 -0.5 -0.5
Long-term interest rate (annual average) -0.4 -0.3 -0.3
USD/EUR exchange rate (annual average) 1.14 1.19 1.18
Nominal effective exchange rate 2.1 0.8 -0.1
World excluding EU 28, GDP growth -2.4 6.4 4.5
EU 28 GDP growth -3.2 6.1 4.5
Growth of relevant foreign markets -6.6 4.9 4.3
World import volumes, excluding EU -9.3 6.6 6.6
Oil prices (Brent, USD/barrel) -8.3 8.8 4.7
Table 0.ii) Main assumptions
2020 2021 2022
1. External environment
a. Prices of commodities (raw materials excluding energy
(HWWI), euros) -25.5 61.1 0.6
b. Spreads over the German bonds 0.1 0.0 0.0
2. Budgetary policy
a. General government net lending/net borrowing -34.0 -50.7 -21.3
b. General government gross debt 434.9 490.9 516.6
3. Monetary policy/Financial sector/interest rate assumptions
a. Interest rates:
i. Euribor
ii. Deposit rate
iii. Interest rates for loans
iv. Yields at maturity of 10 year government bonds -0.4 -0.3 -0.3
b. Evolution of deposits
c. Evolution of loans
d. NPL trends
4. Demographic trends
a. Evolution of working-age population 0.4 0.3 1.2
b. Dependency ratios 71.1 70.9 71.7
5. Structural policies
Page 24 of 31 2022 Draft BudgetTable 1.a. Macroeconomic prospects
in % of GDP 2020 2020 2021 2022
(billions
ESA Code of euro)
1. Real GDP B1*g 800.1 -3.8 3.9 3.5
1.1. which are attributable to the estimated
impact of aggregated budgetary measures on
economic growth
2. Potential GDP 1.3 1.6 1.2
Of which contributions:
- labour 0.7 0.8 0.3
- capital 0.4 0.5 0.5
- total factor productivity 0.2 0.3 0.3
3. Nominal GDP B1*g -1.6 6.2 5.3
Components of real GDP
4. Private final consumption expenditure P.3 335.2 -6.6 2.4 5.8
5. Government final consumption expenditure P.3 207.6 1.0 6.0 1.5
6. Gross fixed capital formation P.51 170.4 -4.1 4.4 2.4
7. Changes in inventories and net acquisition P.52 +
of valuables (% of GDP) P.53 3.5 -0.3 -0.6 0.2
8. Exports of goods and services P.6 622.9 -4.8 6.8 5.4
9. Imports of goods and services P.7 539.6 -5.5 6.5 6.4
Contributions to real GDP growth
10. Final domestic demand 713.3 -3.6 3.3 3.2
11. Changes in inventories and net P.52 +
acquisition of valuables P.53 3.5 -0.3 -0.6 0.2
12. External balance of goods and services B.11 83.3 0.0 0.9 -0.1
Table 1.b. Price developments
Changes 2020 2021 2022
1. GDP deflator 2.3 2.3 1.8
2. Private consumption deflator 1.5 2.1 1.8
3. Harmonised index of consumption prices (HICP) 1.1 1.9 1.8
4. Public consumption deflator 2.7 2.7 1.2
5. Investment deflator 2.9 3.3 2.9
6. Export price deflator (goods and services) -2.5 5.8 1.2
7. Import price deflator (goods and services) -3.4 6.8 1.3
Table 1.c. Labour market developments
Changes 2020 2020 2021 2022
ESA Code Level
1. Employment, persons 9544.1 -0.5 0.9 1.1
2. Employment, hours worked 13427.1 -2.7 2.3 1.8
3. Unemployment rate (%) 356.6 3.8 3.4 3.5
4. Labour productivity, persons 83.8 -3.3 2.9 2.4
5. Labour productivity, hours worked 59.6 -1.2 1.4 1.4
6. Compensation of employees D.1 402.6 3.5 2.9 3.0
7. Compensation per employee 42.2 7.0 -0.3 1.3
Page 25 of 31 2022 Draft BudgetTable 1.d. Sectoral balances
in % of GDP 2020 2021 2022
ESA Code
1. Net lending/net borrowing vis-à-vis the rest of the world B.9 7.0 8.2 8.9
Of which:
- Balance on goods and services 10.4 10.6 10.0
- Balance of primary incomes and transfers -1.7 -0.6 0.0
- Capital account -1.7 -1.8 -1.2
2. Net lending/net borrowing of the private sector B.9 11.1 13.4 11.1
3. Net lending/net borrowing of general government B.9 -4.2 -5.4 -2.3
4. Statistical discrepancy
Table 2.a. General government budgetary targets broken down by subsector
in % of GDP 2021 2022
ESA Code
Net lending/net borrowing by subsector
1. Government S.13 -6.0 -2.4
2. Central government S.1311 -6.8 -2.7
3. State government S.1312
4. Local government S.1313 -0.3 -0.3
5. Social security funds S.1314 1.1 0.6
6. Interest expenditure D.41 0.5 0.4
7. Primary balance -5.5 -2.0
8. One-off and other temporary measures 0.0 0.0
8a. Of which: on the revenue side 0.0 0.8
8b. Of which: on the expenditure side 0.0 -0.8
9. Real GDP growth (%) (= 1 in Table 1.a) 3.9 3.5
10. Potential GDP growth (%) (= 2 in Table 1.a) 1.6 1.2
Contributions:
- labour 0.8 0.3
- capital 0.5 0.5
- total factor productivity 0.3 0.3
11. Output gap (% of potential GDP) -1.7 0.5
12. Cyclical budgetary component (% of the potential GDP) -1.0 0.3
13. Cyclically-adjusted balance (1 - 12)
(% of potential GDP) -5.0 -2.7
14. Cyclically-adjusted primary balance (13 + 6)
(% of potential GDP) -4.5 -2.3
15. Structural balance (13 - 8) (% of the potential GDP) 5.0 2.7
Page 26 of 31 2022 Draft BudgetTable 2.b General government debt developments
in % of GDP 2021 2022
ESA Code
1. Gross debt 57.8 57.7
2. Change in gross debt ratio 3.1 0.0
Contributions to changes in gross debt
3. Primary balance (= item 7 in Table 2.a.i) -5.5 -2.0
4. Interest expenditure (= item 6 in Table 2.a.i) D.41 0.5 0.4
5. Stock-flow adjustment -2.8 -2.3
Of which:
- Differences between cash and accruals 0.8 0.3
- Net accumulation of financial assets 0.4 0.2
Of which:
- privatisations 0.1 0.1
- valuation effects and other
p.m.: Implicit interest rate on debt 0.8 0.7
Other relevant variables
6. Liquid financial assets -1.1 0.2
7. Net financial debt (7=1-6) 58.9 57.6
8. Debt amortization (existing bonds) since the end
of the previous year 1.9 3.4
9. Percentage of debt denominated in foreign
currency* 0.0 0.0
10. Average maturity 7.6 7.6
Table 2.c Contingent liabilities
in % of GDP 2021 2022
Public guarantees 24.8 23.6
Of which: related to the financial sector 19.7 18.7
Page 27 of 31 2022 Draft BudgetYou can also read