The Economic Impacts of LULUs
←
→
Page content transcription
If your browser does not render page correctly, please read the page content below
The Economic Impacts of LULUs

                                         Terance J. Rephann
                                       Senior Research Fellow
                                       Spatial Modelling Centre
                                                Box 389
                                      S-98128 Kiruna, Sweden
                                      e-mail: tre@smc.kiruna.se
                                       http://www.smc.kiruna.se

                                                  and

                                    Director of Institutional Research
                                     Allegany College of Maryland
                                     12401 Willowbrook Road, SE
                                        Cumberland, MD 21502
                                       e-mail: terryr@ac.cc.md.us
                             http://www.ac.cc.md.us/~terryr/rephann.htm

ABSTRACT: This paper examines some of the issues and controversies that arise when facilities
with perceived noxious environmental, social, and economic effects (LULUs) locate in
communities. It develops a taxonomy of LULU types and describes some potential economic and
social effects of five specific kinds of LULUs, including: (1) interstate highways, (2) large dams, (3)
medium and maximum security prisons, (4) commercial nuclear power plants, and (5) gambling
casinos. The paper uses quasi-experimental control group methods to assess the economic
impacts of these facilities on U.S. counties during the period 1972-94. The paper shows that few
actual negative effects can be attributed to LULUs. However, only interstate highways measurably
stimulate aggregate employment.

KEYWORDS: NIMBY, LULU, economic development, control groups

An earlier version of this paper was presented to the 43rd annual meeting of the North American
Regional Science Association in Washington, DC, on November 14-17, 1996.

Biography: Terry Rephann earned his Ph.D. in economics from West Virginia University in 1993.
He is currently a visiting Senior Research Fellow at the Spatial Modelling Centre in Kiruna, Sweden,
and Director of Institutional Research at Allegany College in Cumberland, Maryland. His research
interests include regional impact assessment, industry targeting, rural development, and
microsimulation. He has authored and co-authored articles that have appeared in the Journal of
the American Planning Association, Regional Science and Urban Economics, Urban Studies,
Review of Urban and Regional Development Studies, Tourism Economics, Growth and Change,
and Environment and Planning C: Government and Policy

http://www.equotient.net

Revised version published in Environment and Planning C: Government and Policy 2000 18,4: 393-407
1

1.0 Introduction

        One of the biggest quandaries in community economic development occurs when

 economic facilities with "undesirable" features seek to locate in a region. Planners recognized

this problem decades ago, but only relatively recently identified these objects of controversy by

name, sometimes calling them NIMBYs ("Not in my backyard") or LULUs ("Locally unwanted land

use") (Popper 1985). Unfortunately, any attempt to identify what constitutes a LULU or NIMBY is

wrought with difficulties because they can be so varied in practice. For most prospective host

communities, toxic waste dumps are greeted as LULUs. So are nuclear power plants and prisons.

Transportation facilities such as airports, highways, and rail lines are often regarded as LULUs.

Moreover, popular venues like shopping plazas, Wal-Marts, Disney theme parks, and sports

stadiums are sometimes considered undesirable. Even such seemingly innocuous facilities as

churches may be regarded as LULUs when they intrude on residential areas (Do, et al. 1994).

        The NIMBY phenomenon is alive and well in rural America. However, because many rural

areas continue to lag economically behind the rest of the nation, the opposition there has been

somewhat muted. Few economic development strategies have seemed to work in many rural

regions or the strategies are perceived to take too much time. Therefore, impatient rural

communities have sought to improve their fortunes by recruiting enterprises that have been resisted

ferociously elsewhere. In many instances, the facilities are large and might be expected to create

direct employment through new hires and indirect employment through regional multiplier effects.

It would seem to be an open and shut case that such facilities are an asset to their depressed host

communities. However, doubts persist about them and the magnitude of their tangible benefits.

Moreover, some contend that they create unacceptable environmental or social externalities that

must eventually outweigh the benefits.

        Generalizations are difficult. Of course, economic multipliers differ predictably from one

locale to another depending on characteristics of the region, including the nature of existing

interindustry and interregional linkages. The actual impacts of any given enterprise will also differ
2

based on characteristics of the facility, including the composition of its expenditures. Therefore, the

actual regional effects must be evaluated on a case-by-case basis. Will the expenditures to

 operate the facility be made locally? Are the intermediate linkages within the region strong

enough to create substantial multiplier effects? Although few NIMBYs are derailed on the basis of

this or that calculated multiplier, they are important considerations

        Often, however, the results of economic-base and input-output models seems to be

superfluous. Opponents are willing to concede that the project in question will produce jobs in the

short-run. Their objections are more likely to center on other matters such as the environmental,

social, and distributive effects of the enterprise. These effects are thought to be so detrimental that

they might even undo any initial positive effects in the long run. Opponents often ask hard

questions that planners are unable to answer. Who will be the beneficiaries and the losers? Will

any new jobs be filled by local residents? Will residents such as retirees and tourists become

disaffected and leave the area because their once placid communities have been disturbed? And,

are the negative qualities of NIMBYs enough to repel other enterprises from possibly building or

expanding in the region? With increasing attention being paid to the role of image and amenities in

attracting and retaining a skilled labor-force and higher value added businesses, this latter concern

has become more important. Communities may sometimes be reluctant to consider NIMBYs, not

only because they create additional social, safety, or environmental risks, but because they may

ultimately make the region less attractive to others.

        The purpose of this paper is to begin to sort out some of the reasons that LULUs are often

not appreciated and to gauge some limited economic and social effects of representative types of

LULUs. Five common LULUs are examined: dams, interstate highways, commercial nuclear

power plants, prisons, and gambling casinos. These LULUs are singled out because of the

continuing controversy surrounding their siting and the slightly different nature of each facility. In a

sense, each represents a different era in the debate over LULUs. The hey-day for large dam

construction was the 50s and early 60s (see figure 1.1). The bulk of interstate highway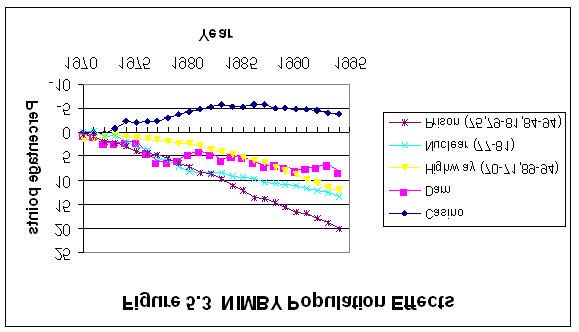
3
construction (figure 1.2) occurred during the mid-60s and early 70s. Nuclear power plant
controversies came to a head during the 70s and early 80s when most of them were built (figure
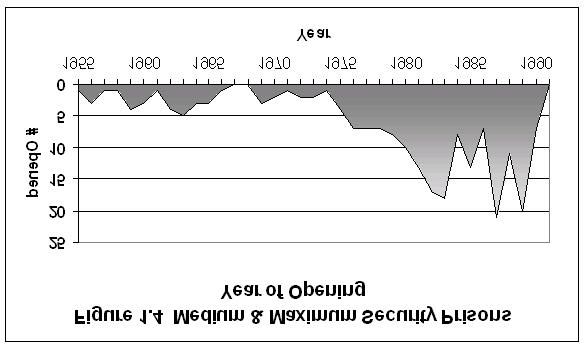
1.3). Maximum and medium security prison construction was most prolific during the 80s and
early 90s (figure 1.4). Finally, casino gambling became a hotly contested issue during the early
1990s when a number of states moved to dismantle prohibitions.
The remainder of this paper is divided into four sections. The next section describes a
basic taxonomy of LULUs, and reviews the literature concerned with the economic effects of the
LULU case studies: dams, highways, nuclear power plants, prisons, and casinos. The following
section describes the quasi-experimental control group research design used to gauge the effects
of these facilities on county growth and development during the period 1972-94. The third section
describes the sources and characteristics of important data inputs. The fourth section describes
the results of the empirical analysis. The final section provides a summary and conclusion.
2.0 Literature Review
LULUs are unpopular for a variety of reasons. Indeed, NIMBY movements often attract
disparate elements that could never get along in another setting or cooperate on another issue.
For instance, gambling casinos are often attacked by the political right for their potential corrupting
effect on public morals while they are resisted on the political left for their potential for aggravating
poverty and widening income disparities (Goodman 1994). In order to adequately assess the
impacts of LULUs, it might be useful first to identify potential friction points. The taxonomy of
LULUs described below and summarized in table 2.1 is an attempt to encapsulate basic
sentiments sometimes expressed by LULU opponents. The taxonomy is crude. It is not meant to
be exhaustive but rather to illustrate some basic ways that LULUs are often characterized.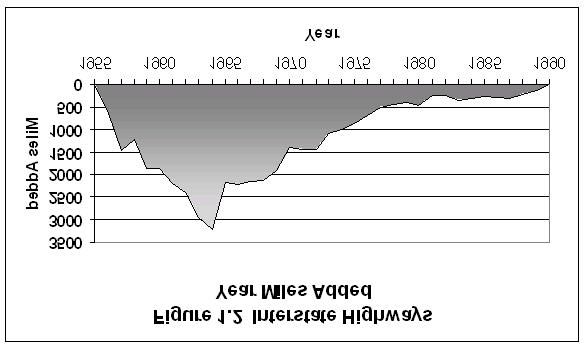
4

The fizzlers. Fizzlers are enterprises that create few or no post-construction direct effects. In the

case of public projects, market forces never materialize that turn the investments into regional

 economic growth.

The islands. Islands are economically isolated from their host regions. They may employ and buy

primarily from outside the region, thereby denying local residents many of the benefits of their

physical presence.

The befoulers. These enterprises are harmful to the local physical environment of a region. They

may be harmful because they emit pollutants into the air and water or dispose of solid waste in the

area. They might also indirectly befoul the environment by facilitating certain types of growth (e.g.,

tourism development) which in turn creates environmental spoilage.

The defilers. These facilities may have harmful social effects. For instance, they may contribute

to decreased family or community cohesion, increased delinquency and crime, alcohol and drug

abuse, or other bad habits.

The deniers. These enterprises may negatively impact those who are less fortunate. They may

displace low-income or elderly residents from their homes or employment. They also may have

disproportionate effects on minority groups and women.

The competers. These enterprises may affect the livelihoods of those in the community who are

generally better off. For instance, established local proprietors may find themselves unable to

compete with more efficient LULUs who choose to locate in the region.
5

The deadbeats. Deadbeats don't pay the full cost of their infrastructure and public service needs.

They leave others in the area footing part of the bill. This situation may arise when LULUs receive

 substantial relocation subsidies or do not compensate the community for facility externalities that

increase public service expenditures.

The repellers. These NIMBY enterprises make it tougher for existing or prospective enterprises to

operate in the same region, often because of the negative externalities described above.

The deserters. Footloose firms that are not committed to a long-term community relationship are

potential deserters. Perhaps, because of the vagaries of the market in which they operate and

relatively low fixed overhead, they respond rapidly to spatial differences in factor costs. They

represent a risk to the community in which they operate because of the costs of picking up the

pieces.

The disturbers. These enterprises can destroy a peaceful and quiet ambience by their very

presence. Opponents may prefer no new enterprises at all, even if they do ameliorate economic

conditions and generate few visible negative effects.

The unknowns. Unknowns may not have any immediate negative environmental or social effects,

but too little is known about their long-term effects. They introduce an element of risk into the

development equation that makes many residents and enterprises uncomfortable.

          Each LULU examined here has been alleged to have one or more of the attributes

described above. Since each facility is large, huge construction costs are involved at the initial

stage. The construction stimulus is temporary and rarely serves as the chief selling point for a

LULU project. The primary debates concern the post-construction and, indeed, long-term post-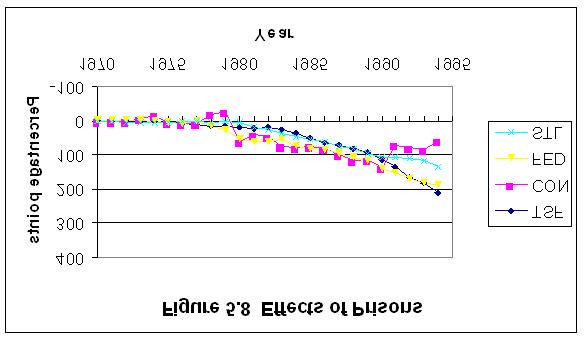
6

construction effects of the project. Regarding these effects, there are varying degrees of

uncertainty. Three of the five are direct employers and, therefore, might be expected to have

 expansionary effects. Two of the LULUs are public infrastructure which create little or no direct

employment but may be influential in directing private investment and employment.

        Dams are often characterized as befoulers, deniers, and fizzlers. They can be

environmentally harmful while generating few tangible economic benefits for local residents. They

submerge large areas of dry land and sometimes alter the ecosystem (though they might help to

ameliorate some man-made environmental problems such as erosion), and displace people in the

process. They are often built to serve national interests and therefore benefits may be very diffuse.

Regional effects are rarely important motivating considerations. Indeed, research on the subject of

economic effects sends a fairly consistent message that "water resource developments are likely to

be poor tools for accelerating [regional] economic growth . . . " ( Cox et al. 1971, 37). When dams

do create employment, the effect is more likely to be connected with recreational uses of the

resultant reservoir rather than effects on transportation or water factor costs that might potentially

lure water using industries to the region (Gjesdahl and Drake 1979). Even if recreation is

stimulated, it may not serve as the catalyst for regional growth and development (Gjesdahl and

Drake 1979).

        Highways are often regarded by their opponents as befoulers, deniers, competers, fizzlers,

and defilers. Although almost all interstate highways are constructed along existing traffic

corridors, they sometimes infringe on areas of environmental, historical, or sentimental value. They

may not directly create social problems but can serve as a conduit for people who bring social

problems (such as crime) to new areas (Rephann 1997). They change access and transportation

costs that may create local competitive advantages as well as disadvantages to a previously

isolated community. Whether or not a highway has a stimulative effect on a region is influenced by

a variety of factors, including urbanization and prior industrial mix. Previously more urbanized and

centrally located areas are more likely to experience growth than less urbanized areas, and sectors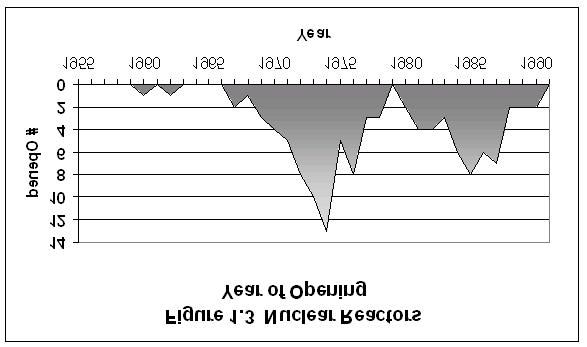
7

such as retail trade and services are more responsive than other sectors (Rephann and Isserman

1994; Briggs 1980; Humphrey and Sell 1975; Lichter and Fuiguitt 1980). Even in those

 communities that grow, however, there may be distributive effects: (1) from lesser urbanized

communities along the route and communities by-passed by the route to those in more urbanized

communities and along the route (Rephann and Isserman 1994) and (2) from local ownership to

outside ownership. The latter could result if, for example, large corporations are quicker to

perceive and respond to the locational advantages created by changes in the transportation

system.

          Nuclear power plants are sometimes said to be islands, repellers, and unknowns. That is

to say, they usually employ few local residents (Bjornstad and Vogt 1984; Lewis 1986), instead

requiring trained specialists likely to be selected from national employment searches. They

represent a small risk because of the known hazards associated with fission reactors. Because of

their potential dangers, it is conceivable that they may deter residents and firms from locating in the

area. However, such an assessment would not be supported by hedonic price studies that show

nuclear power plants having no negative impact on local property values (Nelson 1991; Gamble

and Downing 1982). One explanation for these findings is that the negative effects of nuclear

power plants are offset by the often huge surplus tax revenues that result from taxing the

commercial facilities (Bjornstad and Vogt 1984; Greenberg et al. 1986). In effect, the enterprise

subsidizes residents and firms, making the communities more attractive candidates for additional

private investment than they would be otherwise.

          Prisons are generally recognized to be a "clean industry." That is to say, they are not

befoulers. However, many LULU opponents argue that they are islands, flagrant defilers, and, to

some degree, repellers (Fitchen 1991; Shichor 1992). Prisons are owned and operated by state

and federal governments. Consequently, labor is often drawn from state and national searches

instead of local searches. During the startup phase, much of the management and labor may be

drawn from non-local state and federal facilities (Fitchen 1991; Carlson 1992; Beale 1993).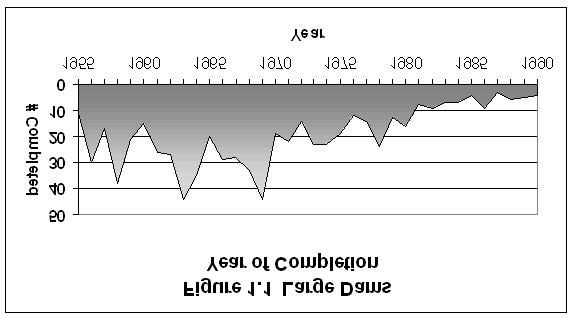
8

Because prisons siting is dominated by political considerations, the eventual sites are unlikely to be

low cost producers of many prison inputs (Sechrest 1992). Therefore, supply and purchasing

 channels may be national as well. The positive effects of prisons are, therefore, likely to result

from the household purchases of the relocated workers rather than direct spinoffs. Prisons have

the potential to create social problems because they house residents likely to commit offenses

against one another. Although this may be isolated from the community at large, imprisoned

spouses may serve as a magnet for families who are more likely to commit crimes than the native

population. It is sometimes argued that prisons may alter the safety and prestige of a community,

and thereby serve as a deterrent to firm location and expansion.

        Casinos are sometimes characterized as defilers, islands, deniers, competers, and

deadbeats (Goodman 1994). They have been called islands because of a tendency to draw

workers from outside the immediate community (Rephann et al. 1997). In a young and competitive

industry, they can also vanish practically overnight, prompting some opponents to call them

deserters. As with any young enterprise, the success of a casino depends on a variety of locational

factors, including proximity to urban markets, infrastructure, and availability of other tourist

attractions (Eadington 1995). Casino gambling is held to attract all kind of malicious and perfidious

activity (Friedman, Hakim and Weinblatt 1989; Goodman 1994; Kindt 1994). It may also tempt

residents to gamble excessively or even compulsively. If the persistent gamblers are

disproportionately financially insecure then casino gambling may aggravate poverty, family

dissolution, crime, and other social vices. New casinos are often opposed by local merchants

because of their potentially deleterious effects ("cannibalization") on native restaurant and

entertainment businesses which may not be able to compete with the lower prices and quality of

services offered by casinos. If these effects are evident, a casino can become a burden on

communities because of the additional social service needs of the newly unemployed and newly

addicted (Kindt 1994).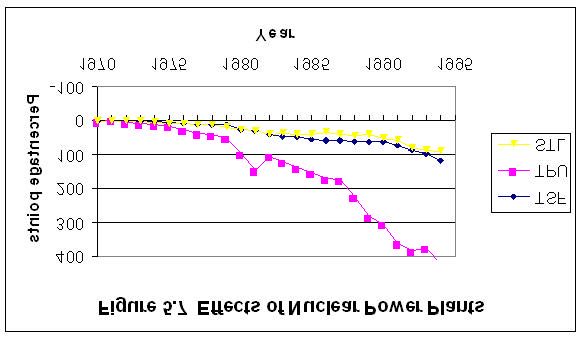
9

3.0 Methodology

        The quasi-experimental control group method used here is documented carefully in

several published studies, including Isserman and Merrifield (1987), Isserman and Beaumont

(1989), and Rephann and Isserman (1994). The method chooses a control group of counties

similar in economic makeup to counties that have received a particular policy treatment. In the

case of LULUs, the treatment would consist of the construction or opening of a LULU facility. The

control group of untreated counties (or counties without such a facility) serve as a benchmark

against which to measure the effect of the treatment.

        Since the ultimate goal is to compare the growth rates of LULU and non-LULU counties,

every effort should be made to control for all other plausible causes of economic growth. For this

study, the determinant variables were drawn from mainstream theories of regional economic

growth, including reduced form equations of regional economic growth described in Richardson

(1973) and von Böventer (1975). These theories emphasize the role of spatial context, economic

dynamism, the cost of labor and capital, and industrial structure in regional economic growth.

Variables that attempt to measure some of these concepts are listed in table 3.1. They are used as

selection variables in choosing non-LULU county control groups.

        Control counties meet four conditions. First, they have no corresponding LULU facility

(e.g., the control group for dams must not have counties that have a large dam). Second, they are

sixty miles distant from a county with such a facility in order to protect against spatial

interdependencies. Third, they do not have an inordinate amount of data gaps caused by data

disclosure restrictions. Fourth, they are approximately similar to LULU counties in industrial

structure, spatial position, and demographics in a period before the facility opened in the study

counties. A similarity index is computed for each potential treatment control match using the

Mahalanobis metric. This metric combines numerous variables in a way to produce a single
10
number that may be used objectively for comparison purposes and has certain desirable statistical
1
properties.
When a control group has been selected, it should be evaluated further by performing a
statistical pre-test. The pre-test compares the growth of the LUL counties as a group to the control
group during a period before LULUs were constructed. If the control group follows a similar growth
path to the LULU counties prior to opening, the control group can be used as a benchmark for
assessing the treatment effects. For each of the LULU groups used in this study, a statistical
pre-test is conducted by choosing a base year in advance of the expected impact years which
occur after 1971. For the categories described here, the years 1970 and 1971 serve as a pre-
testing period. As things turn out, there are few statistically significant discrepancies between the
treatment groups and control groups during this period; therefore, in most instances subsequent
growth rate differentials may be reasonably attributed to the LULUs themselves.
Economic impacts were measured using data from the Regional Economic Information
System (REIS) (US Dept. Of Commerce, 1996). The System contains both personal income and
employment data. The data used here is measured at the sectoral level for both earnings and
employment. These include sectors such as services, retail trade, and state and local government.
In addition, the REIS contains information concerning population, per capita income, residential
adjustment (a measure of net earnings leakages paid to non-residents), transfer payments (a
category consisting largely of social security and government retiree payments as well as
assistance to low income residents), and dividends, interest, and rent. The sectoral abbreviations
used in illustrations here are as follows: total employment (EMP), population (POP), per capita
personal income (PCI), transfer payments income (TRF), residential adjustment income (RES),
construction earnings (CON), transportation, communication, and public utility earnings (TPU),
wholesale trade earnings (WHL), finance, insurance, and real estate earnings (FIR), services
earnings (SVC), federal, civilian government earnings (FED), and state and local government
earnings (STL).11
The basis for impact measurement and tests of statistically significant effects are
cumulative growth rates differentials by sector. Growth rates are measured against a selected
base year. Counties are selected in 1969 (the first year in which REIS data is available for this
series) and 1969 serves as the base year for all subsequent growth rate calculations, 1970-94.
The period 1970-94 is broken into two distinct periods for analysis. As mentioned earlier, the years
1970-71 serve as a pre-test period, during which we can verify that counties followed similar
economic trajectories before a LULU was introduced into a county. The years 1972-1994 deserve
attention as the years that LULUs were functional and should be used to assess the LULU impacts.
The results are presented through a series of graphs displaying the differences between
LULU county average growth rates and respective control group average growth rates. Sectors
and years that are statistically significant at the a = 10% level are identified in the lower left-hand
corner of each graph. The t-test is the underlying statistical test for all grouped comparison tests
(see Rephann and Isserman 1994). The significance test results should be used in interpreting the
results. For example, in figure 5.1, interstate highway counties experienced a fourteen percentage
point increase in employment compared to non-interstate highway counties, while dam counties
outgrew non-dam counties by more than thirty percentage points. However, only the former result
is statistically significant.
4.0 Data
Information concerning the LULUs selected for this study were derived from the following
sources:
Data regarding dams were obtained from the Federal Emergency Management Agency's
National Inventory of Dams Data (FEMA 1990). This database contains information about a dam's
capacity, primary usage, location, and construction year. An effort was made to select only large12
dams (defined by the Geological Survey as having a capacity of more than 50,000 acres-feet)
because they engender greater opposition and might be expected to have larger effects. There
were 881 large dams out of a total of 68,225 dams in the U.S. Counties containing large dam
reservoirs were trimmed further on the basis of reservoir and county characteristics. All study
counties had reservoirs constructed during the period 1972 to 1977, had reservoirs located entirely
within their boundaries, had only one dam treatment (the study dam) during the study period, and
were non-metropolitan. These restrictions narrowed the list to twenty-seven counties.
Highway counties were selected using a file obtained from the Federal Highway
Administration called Status of Improvement of the National System of Interstate and Defense
Highways File (PR-511) (USDOT 1990). This file contains information on the status of various
interstate highway links, including construction dates and opening dates. Interstate highways
currently run through more then one in three U.S. counties. Of these approximately 1,360 counties,
fifty-eight counties were chosen for study. These counties had interstate highways measuring at
least nine miles in length that were opened to traffic during the period 1972-75.
Nuclear power plant counties were selected from a list kept by the Nuclear Regulatory
Commission (NRC 1990). The list describes each nuclear reactor and the date that a construction
permit was issued and operating license conferred for it. Seventy-five counties contain nuclear
power plants. The study group consists of twenty-nine counties where construction permits to build
nuclear reactors were issued after 1971. Many of these reactors obtained operating permits during
the early and mid 1980s.
A directory published by the American Correctional Association (ACA 1990) was the
source of prison information. This publication contains an inventory of the nation's state and federal
prisons, including date of opening, number of employees, and number of inmates. Each prison is
designated as having a particular security status, with maximum, medium, and minimum security
arrangements being the most common. This study examines only large sized (250+ inmates)13
maximum and medium security prisons. Two-hundred and ninety-seven counties host such
facilities. The thirty-nine selected for study were opened during the period 1972-80.
The data used to select casinos is the least satisfactory of the group. Casino gambling
is not a federally regulated industry, and no responsible authority makes an effort to keep track of
when a casino is built, how large it is, and other parameters that might be of interest in assessing its
economic and social effects. Therefore, this study relies on a publication compiled for travel
agencies and casino hobbyists called Casino Resort and Riverboat Fun Book Guide, published by
Casino Vacations, Inc. The 1994 Guide describes casinos that were open as of 1993. There are
several drawbacks to relying on this source, however. The guide makes no claim as to
completeness and, in fact, excludes several levels of gaming operations, including bingo and
pari-mutuel betting. In addition, the Guide cannot be used to determine the size of each casino.
Because many Nevada casinos were in existence before the data series used here began, Nevada
casinos were trimmed from the study group. This left sixty-nine casino counties for the study group.
Most of these casinos were opened during the late 1980s and early 1990s.
5.0 Empirical Results
Figures 5.1-5.4 provides a comparison of the key economic and demographic effects of
the five types of LULUs. Statistically significant results are identified in the legend by years in
parentheses. Employment growth rate differences are on balance positive but only highways
exhibited a statistically significant positive total employment effect at the end of the period.
Counties with nuclear power plants and large dams had statistically significant effects during some
intermediate years but they were not sustained. Per-capita personal income serves as a measure
of the average resident's economic well-being. Results show that dams and casinos exhibited
positive effects at the end of the period, while highways, nuclear power plants, and prisons had
negative effects. However, only the casinos result was statistically significant. Four of the LULUs
had a positive effect on population. However, only two were statistically significant in 1994 and in14
only one of these cases (i.e., prisons) can it be inferred that growth was stimulated. Highways were
growing faster than their control counterparts before the highways were constructed (i.e., 1970-71)
and, in effect, failed the pre-test. Figure 5.4 shows residential adjustment effects, where a
positive growth rate difference can be interpreted to mean that net income inflows occurred and a
negative value means net income outflows occurred. One can imagine that the cash inflows and
outflows are connected to changes in commuting patterns. If this is correct, then it can be inferred
that prisons caused more outcommuting while casinos caused more incommuting. The latter
result suggests that the benefit of hosting a casino is to some extent diffused to residents who
reside outside of the host county.
Taken as a whole, the picture that emerges is quite mixed and does not indicate that
LULUs have either profound detrimental or favorable effects. Thus, neither the woeful predictions
of the harshest LULU critics nor the quick-fix rhetoric of proponents are supported by the empirical
evidence. Since the results are on a fairly aggregate level, however, they may camouflage
disparate effects. For instance, a LULU could have sizeable positive effect on a particular sector
but negative effects on others. The net result would be, therefore, undetectable. In order to
examine the possibility of such redistributive sectoral effects further, each of the LULUs was
examined on a case-by-case basis using industry-level employment and income data. An
examination of the employment results revealed few statistically significant results. Therefore, only
income differences are reported in the subsequent text. Figures 5.5-5.9 report results for sectors
that were statistically significant in either 1993 or 1994 but did not “fail”their corresponding pre-tests
for the years 1970-71. That is to say, the figures show only sectoral results where statistically valid
inferences about growth or decline can be made.
Recall that the literature suggests that dams have few economic effects on their host
communities. The economic benefits are often diffuse and dam reservoirs do not serve as much of
an industrial location asset, even in water intensive industries. However, dam reservoirs have been
found to sometimes stimulate recreation-related sectors when they can be utilized for recreational15
purposes. Nearly every one of the dams included in this study had a recreational use, and thus
one might anticipate some additional services and retail trade growth. The results obtained (see
figure 5.5) here lend only partial support to this hypothesis. Retail trade (RTL) grew 175% faster
(significant at a = 10%) in the dam counties than control group counties. Included in the retail trade
sector are eating and drinking places and souvenir vendors. On the other had, services (which
includes lodging places and amusement and recreation services) was not affected. Furthermore,
wholesale trade (WHL), a sector that would appear to have little connection with the presence of a
dam reservoir, grows significantly faster.
Highways are expected primarily to affect primarily tertiary industries. The results
illustrated in figure 5.6 partially support this story. Both finance, insurance, and real estate (FIR),
and wholesale trade (WHL) exhibit positive effects and services (not pictured) nearly so. Transfer
payments (TSF), a very heterogeneous category encompassing retiree payments, medical
benefits, and public assistance, are stimulated as well. On further investigation of the transfer
payments effect, it was discovered to originate from retirement and medical payments. One
possible explanation for this result is that highways stimulate elderly inmigration, perhaps because
of their more centralized locations and easier access to various public and private services.
Unfortunately, it is not possible to infer any stimulative effect of highways on population from the
sample because the statistical pre-test indicates that the highway sample was growing faster than
its control group both before and after the highways were constructed. Still, in contrast to other
LULUs examined here, the effects are substantial enough to stimulate aggregate employment.
The effects of nuclear power plants should be most noticeable in transportation,
communication, and public utility earning (TPU) because nuclear power plants are public utilities.
In addition, state and local government earnings (STL) should be stimulated if the plant contributes
generously to the local property tax base as previous studies seem to indicate. The results
illustrated in figure 5.7 bear out these expectations, and also indicate that transfer payments (TSF)
are stimulated. It is worth pointing out, however, that there were no corresponding employment16
effects in TPU and STL and that secondary multiplier effects in tertiary sectors are absent as well.
Therefore, one might infer that the direct employment effects of nuclear power plant are relatively
small and thus do not create ripple effects through the local economy.
The government sectors, federal, civilian (FED) and state and local government (STL) are
among those stimulated by prisons (see figure 5.8). This is no great surprise since both state and
federal correctional facilities are included in the study group. These results likely reflect direct
wage disbursements from the government employers. However, there are two additional effects
worth noting: transfers (TSF) and construction (CON). The positive effect on transfers might be
attributable to expenditures on prison inmates or their families. The bulge in construction may be
connected with the population stimulus illustrated in figure 5.3. Both population and construction
effects may reflect a boom in housing construction that stems from the influx of new employees,
some of whom may be merely transfers from elsewhere in the prison system. The downside of this
result is the possibility that few local residents outside the construction sector would benefit from
the situation because of the lack of secondary effects in tertiary sectors.
Gambling casinos might be expected to have a positive effect on the service sector in
which they operate. However, the possibility that they cannibalize other industries means that one
cannot be certain of this effect or that the effects will be positive in other sectors. Figure 5.9 and
5.4 indicate some positive results. Both services and construction are stimulated during the prime
casino growth years in the early 1990s, reflecting perhaps both the construction and operation of
the casinos. In addition, a negative transfer payments effect, which stems largely from decreased
public assistance payouts, provides evidence that some low-income residents may be obtaining
employment in the casinos. On the other hand, as figure 5.4 shows, residential adjustment
leakages increase, which seems to indicate that residents from outside the host county are
obtaining some of the new jobs too. Nor, is there any evidence to suggest that the state and local
government sector is stimulated, which would be needed if casino gambling aggravates social
problems that require state and local government attention.17
Based on the these empirical results and using the LULU categories described in section 2,
it is possible to speculate about the exact nature of each of the LULUs examined here. First, it is
difficult to characterize any of the LULUs as fizzlers because each case study produced at least
one statistically significant positive sectoral result. Second, none of the LULUs appears to be a
repeller because statistically significant negative sectoral effects were not observed. Third, many of
the case studies have characteristics of islands because their effects were often concentrated in
one or two sectors which are directly related to the LULU. For casino counties, it is the service
sector; for nuclear power plant counties, it is transportation, communication, and public utilities; for
prisons, it is federal, civilian, and state and local government. Beyond these few generalizations,
the picture is quite varied. For instance, gambling casinos may be deadbeats because there is no
evidence here that they reinvigorate state and local government disbursements, though they may
increase the need for additional public services. On the other hand, they do not appear to be
deniers because public assistance payments decrease rather than increase after casinos are
introduced. Nuclear power plants cannot be characterized as deadbeats because they stimulate
additional state and local government earnings. Among the remaining LULUS, highways and
dams alone act by influencing the locational decisions of firms and residents. But, highways
appear to be the more effective of the two strategies, and indeed, it alone of all the LULU case
studies has aggregate employment effects.
6.0 Summary and Conclusion
This paper examined some of the issues and concerns that arise when facilities with some
potentially harmful qualities locate in a region. Although these facilities often create substantial
direct employment, they are resisted for a variety of reasons, including concerns that the facility will
be detrimental to other enterprises, certain categories of residents, prospective new employers, or
local public finances. There are also concerns that the facilities will be of little benefit to the host
region, and instead benefit disproportionately outsiders who may not experience the negative18
effects associated with the facilities. Through examining five representative case studies that been
resisted by the public during the last four decades (dams, highways, nuclear power plants, and
prisons, casinos), this paper is able to establish that, judging on the basis of economic growth and
development impacts, LULUs are neither as bad as opponents charge nor as good as some
proponents claim. Indeed, every LULU examined had at least some minimal growth effects.
However, these effects tended to be concentrated in a handful of sectors, and only in the case of
highways was aggregate employment enhanced.
Because this paper relies on primarily economic data, it was not possible to characterize
the full social and environmental effects of the LULUs. A more complete impact analysis would
examine the effects of LULUs on additional measurable outcomes such as crime, pollution, small
business formation and failures, and income inequality. With additional data it would be possible to
replicate the research design adopted here and determine which LULUs have features of deniers,
competers, defilers, and befoulers as well. With reasonable answers to these questions, it should
be possible to reduce the anxiety that exists among both the public and planners concerning the
threat posed by those LULUs that are still regarded as “unknowns.”
Endnotes
1 2 T -1 2
The Mahalanobis distance is represented as d (XT,Xi) = (XT - Xi) S (XT - Xi) where d (XT,Xi) is
the distance between the vector of selection variables for the treated county and county i and S is
the sample variance-covariance matrix for all of the counties.19
References
American Correctional Association (ACA). 1990. Directory: Juvenile and adult correctional
departments, institutions, agencies and paroling authorities. Laurel, MD.
Beale, C. L. 1993. Prisons, population, and jobs in nonmetro America. Rural Development
Perspectives 8, 16-19.
Bjornstad, D. J. and D. P. Vogt. 1984. Some comments relating to model specification on
'Effects of nuclear power plants on residential property values.' Journal of Regional
Science 24, 135-136.
Briggs, R. 1980. The impact of Interstate Highway System on non-metropolitan growth Washington,
DC: U. S. Department of Transportation. Washington, DC.
Carlson, K. A. 1992. Doing good and looking bad: A case study of prison/community
relations. Crime and Delinquency 38, 56-69.
Casino Resort and Riverboat Fun Book Guide. 1994. Dania, FL: Casino Vacations,
Inc.
Cox, P. T., W. Grover, and B. Siskin. 1971. Effect of water resource investment on
economic growth. Water Resource Journal 8, 32-39.
Do, A. Q., R. W. Wilbur, and J. L. Short. 1994. An empirical examination of
the externalities of neighbourhood churches on housing values. Journal of Real
Estate Finance and Economics 8.
Eadington, W. R. 1995. Economic development and the introduction of casinos: Myths and
realities. Economic Development Review (Fall): 51-54.
Federal Emergency Management Agency (FEMA). 1990. National inventory of dams data.
Washington, DC: FEMA.
Fitchen, J. M. 1991. Endangered spaces, enduring places: Change, identity, and survival in
rural America. Boulder, CO: Westview Press.20
Friedman, J., S. Hakim, and J. Weinblatt. 1989. Casino gambling as a 'growth pole'
strategy and its effect on crime. Journal of Regional Science 29, 615-623.
Gamble, H. B. and R. H. Downing. 1982. Effects of nuclear power plants on residential property
values. Journal of Regional Science 22, 457-478.
Gjesdahl, D., and W. Drake, Jr. 1979. Impact of dam and lake construction on rural
economics. Fort Belvoir, VA: U.S. Army Corps of Engineers, Institute for Water
Resources. IWR Research Report 79-R4.
Goodman, R. 1994. Legalized gambling as a strategy for economic development.
Amherst, MA: University of Massachusetts, Hampshire College.
Greenberg, M. R., D. A. Krueckeberg, M. Kaltman, W. Metz, and C. Wilhelm. 1986. Local
planning v. national policy: Urban growth near nuclear power stations in the United
States. Town Planning Review 57, 225-237.
Humphrey, C. R. and R. R. Sell. 1975. The impact of controlled access highways on
population growth in Pennsylvania nonmetropolitan communities, 1940-1970.
Rural Sociology 40, 332-43.
Isserman, A. M., and P. M. Beaumont. 1989. New directions in quasi-experimental control
group methods for project evaluation. Socio-Economic Planning Sciences 23,
39-53.
Isserman, A. M., and J. D. Merrifield. 1987. Quasi-experimental control group methods for
regional analysis: An application to an energy boomtown and growth pole theory.
Economic Geography 63, 3-19.
Kindt, J. W. 1994. Increased crime and legalizing gambling operations: The impact on the
socio-economics of business and government. Criminal Law Bulletin Nov/Dec: 538-
555.
Lewis, P. M. 1986. The economic impact of the operation and closure of a nuclear power
station. Regional Studies 20, 425-432.21
Lichter, D. T., and G. V. Fuguitt, 1980, Demographic response to transportation innovation: The
case of the interstate highway. Social Forces 59, 492-511.
Nelson, J. P. 1981. Three mile island and residential property values: Empirical analysis and
policy implications. Land Economics. 57, 363-372.
Nuclear Regulatory Commission (NRC). 1990. U.S. commercial nuclear power reactors.
Mimeograph.
Popper, F. 1985. The environmentalist and the LULU. Environment 27, 2: 7-11, 37-40.
Rephann, T. and A. Isserman. 1994. New highways as economic development tools: An
evaluation using quasi-experimental matching methods. Regional Science and
Urban Economics 24, 723-751.
Rephann, T., M. Dalton, A. Stair, and A. Isserman. 1997. Casino gambling as an economic
development strategy. Tourism Economics 3, 161-183.
Rephann, T. 1997. Links between rural development and crime. Paper presented at the
th
44 annual meeting of the North American Regional Science Association in Buffalo,
NY, on November 6-9.
Richardson, H. 1973. Regional growth theory. New York: John Wiley.
Sechrest, D. K. 1992. Locating prisons: Open versus closed approaches to siting. Crime
and Delinquency. 38, 88-104.
Shichor, D. 1992. Myths and realities in prison siting. Crime and Delinquency. 38, 70-87.
U.S. Department of Commerce, Bureau of the Census. 1979. County and city data book
consolidated file, county and city data, 1947-1977. Prepared by the Data User Services
Division, Washington, DC.
U.S. Department of Commerce, Bureau of the Census. 1980. Census of population and housing,
1980: Master area reference file (MARF) 2. Prepared by the Data User Services Division,
Washington, DC.22
U.S. Department of Commerce, Bureau of Economic Analysis. 1986. Regional Economic
Information System, Washington, DC.
U.S. Department of Transportation (USDOT). 1990. PR-511 Master File. Prepared by the
Data Systems Division of the Federal Highway Administration. Washington, DC.
U.S. Department of Commerce, Bureau of Economic Analysis. 1996. Regional economic
information system. Washington, DC.
von Böventer, E. 1975. Regional growth theory. Urban Studies 12, 1-29.23 Table 2.1 NIMBY taxonomy. Type Distinguishing characteristics Fizzlers No direct or indirect employment effects Islands Few linkages with the local economy Befoulers Harmful effects on the environment Defilers Detrimental social effects Deniers Negative distributive effects Competers Outside ownership displacing local firms Deadbeats Insufficient contributions to tax base Repellers Negative effects on firm formation and relocations Deserters Uncertainty caused by lack of commitment Disturbers Negative ambience effects Unknowns Uncertainty caused by unknown qualities of facility
24

                          Table 3.1 Control Group Selection Variables

 Industrial Structure
Farm earnings as share of total personal income, 1969
Manufacturing earnings as share of total personal income, 1969
Federal government, civilian and military earnings as share of total personal income, 1969

Population, demand, and spatial aspects
Log of population (base ten), 1969
Logarithm of population potential for counties within 60 miles, 1969
Logarithm of population potential for counties within 60-500 miles, 1969
Residential adjustment income as share of total personal income, 1969
Transfer payments income as share of total person, 1969
Per capita personal income, 1969
Distance to city with 25,000 or more residents, 1970
Distance to city with 100,000 or more residents, 1970

Data sources: U.S. Department of Commerce, Bureau of Economic Analysis (1996); U.S.
Department of Commerce, Bureau of Census (1979, 1980)
25
26
27
28
29
30
31
32
You can also read