The New Zealand
Kiwifruit Industry
Future Opportunities
and Challenges
←
→
Page content transcription
If your browser does not render page correctly, please read the page content below
The New Zealand Kiwifruit Industry Future Opportunities and Challenges

Northland 3%

                                       Auckland 4%
    2,435 growers
                                              Bay of Plenty 82%

                          Waikato 4%
                                                       Gisborne 2%
    ~14,500 hectares
    -                                             Hawke’s Bay 2%

                       Nelson 3%

Industry stats
                                                     Hectare distribution
0 – 2 ha           791
3,055 registered      2 – 5 ha          1,508
orchards              5 - 10 ha          589
                      >10 ha             161

Average orchard size: Green – 3.5ha; Gold – 2.6 ha

56 packhouses and 67 coolstores used

Over 400 on-orchard labour contractors registered

~ 10,000 permanent staff; ~15,000 seasonal staff

                                           Industry Statistics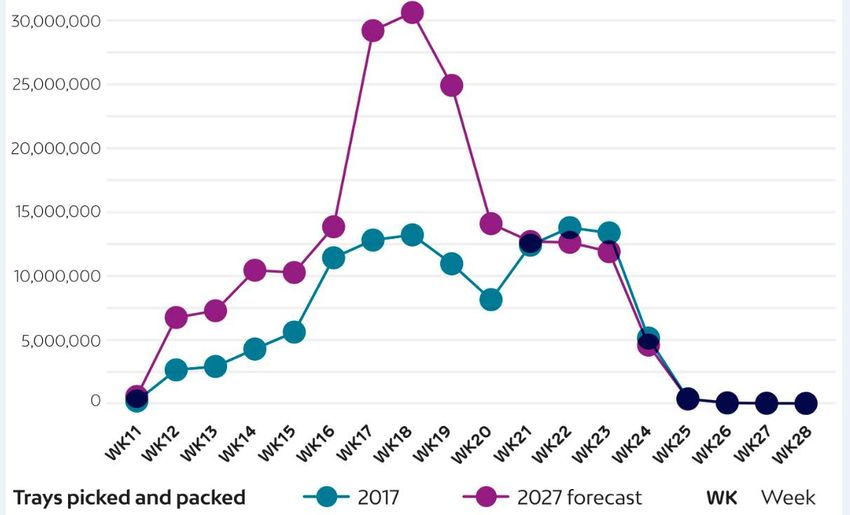
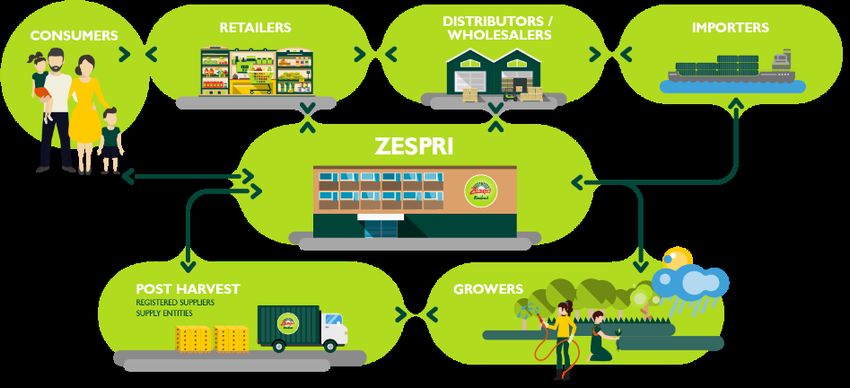
The Zespri System
All Varieties, NZ & ZGS Supply

             China

            Japan

   Spain & Portugal

            Taiwan

         Germany

           Benelux

            France

       Italy & Med

             Korea

      United States

                      0              5000000         10000000        15000000    20000000         25000000     30000000
                          Zespri Green                 Zespri Green (Organic)   Zespri Gold & Zespri SunGold
                          Zespri Sungold (organic)     Zespri Sweet Green       ZGS Supply

Sales Volume (TE) Top 10 Markets 2017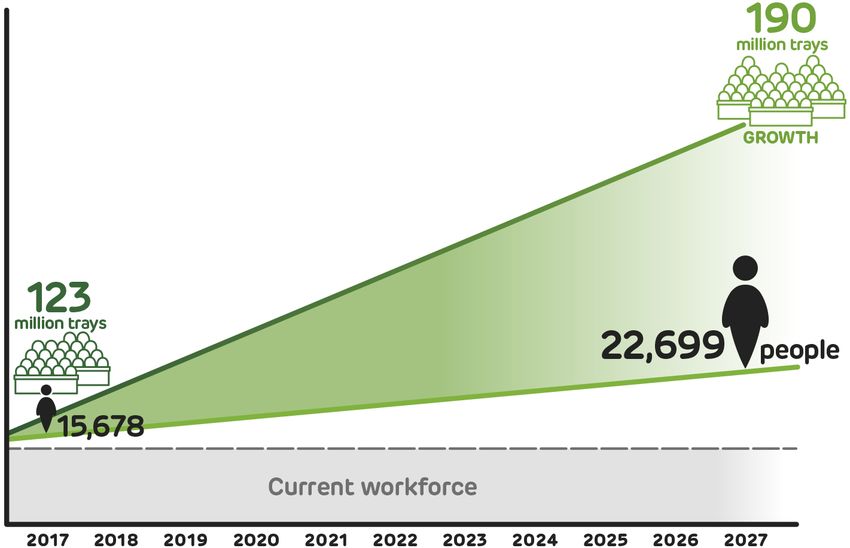
Global sales
           $2,500

           $2,000                                                                                         2,046

                                                                                                  1,723
           $1,500                                      1,505      1,522
                                                                          1,456
 NZD (m)

                                              1,359                                       1,401
                                     1,300
                                                                                  1,205
                    1,063    1,082
           $1,000

            $500

                                     152                                                  168     184     217
                    81       82               142      120        98      106     145
              $0

                         New Zealand grown kiwifruit           Non New Zealand grown kiwifruit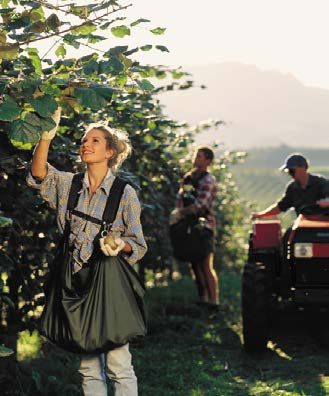
Kiwifruit direct economic contribution
             700

             600

             500

             400
$ millions

             300

             200

             100

               0
Developing and
      marketing the world’s
      leading portfolio of
      kiwifruit products for
      12 months of the year.

Zespri’s strategy
Long-term demand for Zespri kiwifruit
Healthy eating     Global demographics   Position in the fruit
                                                  bowl

Demand for SunGold       Leadership in     Leadership in global
                          innovation        kiwifruit industry

A confident view of demand…
The importance of strengthening our demand
position
Kiwifruit is still an underdeveloped category within the fruit bowl but with a huge growth
potential. The risk of not accelerating growth:
• Give up shelf space to other kiwifruit suppliers
• Give up shelf space to other fruit
• Loss of share within the fruit bowl means it will be more costly to build mental and
physical availability
• Forfeiting the opportunity to bring further value back to our growers, our industry
• It is a dynamic race… standing still means falling behind.Our Opportunity 2025 Global Target NZD4.5bn revenue
Kiwifruit direct economic contribution
             700

             600

             500

             400
$ millions

             300

             200

             100

               0
Macro risk Grower risk Market risk
• Global political • Biosecurity risk has not gone away • Loss of market access to a major
uncertainty • Poor taste market
• Increased compliance and • Competition – particularly in the
• Global economic
growing cost including minimum Gold space
uncertainty • Markets don’t develop to plan
wage going up
• Land/ Labour/ Water constraints • Other fruit competition – another
fresh fruit, or more convenient fruit
Risks to the plan
productsProjected growth Requiring
A bigger, Post-harvest
equivalent to significant new
more investment
another Te Puke plantings
capable
workforce
Managing the challenges and risks of growthSeasonal Shortage based on current
supply estimatesSeasonal Peak Compounded Over Time
Industry led strategies to address labour
shortages

• Implement an Attraction Strategy addressing
   • Worker Welfare
   • Flexible and reliable working arrangements
   • Accommodation & Transport
   • Career pathways

• Investment in technology development
Working with Government
Possible areas for collaboration
• New approaches to utilising under-employed and unemployed
• Continued access to RSE
• Skills training
Thank you.
You can also read