The potential of Ca II K observations for solar activity and variability studies
←
→
Page content transcription
If your browser does not render page correctly, please read the page content below
Long-Term Datasets for the Understanding
            of Solar and Stellar Magnetic Cycles
            Proceedings IAU Symposium No. 340, 2018
                                                                                        c International Astronomical Union 2018
            D. Banerjee, J. Jiang, K. Kusano & S. Solanki, eds.                                  doi:10.1017/S1743921318001849

                     The potential of Ca II K observations
                    for solar activity and variability studies
             Ilaria Ermolli1 , Theodosios Chatzistergos1,2 , Natalie A. Krivova2 and
                                       Sami K. Solanki2,3
                           1
                               INAF – Osservatorio Astronomico di Roma, Monte Porzio Catone, Italy
                               2
                                 Max-Planck-Institut für Sonnensystemforschung, Göttingen, Germany
                                3
                                  School of Space Research, Kyung Hee University, Republic of Korea

            Abstract. Several observatories around the globe started regular full-disc imaging of the solar
            atmosphere in the Ca II K line in the early decades of the 20t h century. These observations
            are continued today at a few sites with either old spectroheliographs or modern telescopes
            equipped with narrow-band filters. The Ca II K time series are unique in representing long-term
            variations of the Sun’s chromospheric magnetic field. However, meaningful results from their
            analysis require accurate processing of the available data and robust merging of the information
            stored in different archives. This paper provides an overview of the historical and modern full-
            disc Ca II K observations, with focus on their quality and the main results obtained from their
            analysis over the last decade.
            Keywords. Sun: activity, plages, Sun: chromosphere, Sun: magnetic fields

            1. The Ca II K line
               The visible spectrum of the Sun, the brightest star in our sky, contains millions of
            absorption lines. Two of the deepest and broadest such lines are the resonance doublet
            lines of singly-ionized calcium at 3933 Å and 3968 Å. First observed by Joseph von
            Fraunhofer in 1814, these lines were designated as K and H, respectively, in his catalogue
            of prominent absorption features. Linsky & Avrett (1970) consider that “The significance
            of these lines lies in the fact that they are the only resonance lines in the visible spectrum
            from the dominant stage of ionization in the upper photosphere and lower chromosphere
            of an abundant element. Consequently, these lines are very opaque with line centre optical
            depths of order 107 in the photosphere and 104 at the temperature minimum. The entire
            cores of the lines are thus chromospheric and can serve as convenient probes of the
            structure and physical properties of the chromosphere.”
               Figure 1 shows two spatially-averaged intensity profiles of the Ca II K line measured
            in a quiet Sun and a plage region superimposed on each other. The line profile is charac-
            terized by the two peaks K2V and K2R towards the Violet or Red part of the spectrum
            relative to the line centre, respectively, the reversal at the line centre K3 , and the two
            secondary minima K1V and K1R . These line features result from sampling of different
            parts in the inner solar atmosphere. From the line wings towards the line centre, the
            line samples the photosphere with increasing height until the temperature minimum,
            where the K1 minima are formed. The decreasing temperature with height in the photo-
            sphere produces a regular absorption line. Closer to the line core between the K1 minima,
            the line samples the low chromosphere where the temperature increases with height, the
            source function essentially follows the Planck function and the line thus gets brighter with
            increasing height. This is the case nearly up to the atmospheric heights where the K2
            peaks are formed, where the source function becomes smaller than the Planck function
                                                                          115

Downloaded from https://www.cambridge.org/core. Max-Planck-Institut fuer Sonnensystemforschung, on 04 Feb 2020 at 10:59:46, subject to the Cambridge Core
terms of use, available at https://www.cambridge.org/core/terms. https://doi.org/10.1017/S1743921318001849
116 I. Ermolli et al.
Figure 1. Ca II K line profile for quiet Sun (lower curve) and plage region (upper curve).
Adapted from Skumanich et al. (1984).
and absorption dominates again, causing the K3 minimum. These line features appear
qualitatively the same for both the quiet Sun and the plage region, but for the latter
the K2 peaks and the K3 minimum display a significant increase of the contrast relative
to the quiet region. This shows that the chromospheric heating is greatly enhanced in
regions where the magnetic field is stronger.
It is worth noting that all individual line features introduced above occur within a
1 Å interval. Ermolli et al. 2010 studied the intensity response function for Ca II K obser-
vations taken with different filters and showed that for data taken with a 1 Å bandwidth
filter centred at the K3 , 58–82% of the contribution at disc centre is from atmospheric
heights below 500 km. For a 2.5 Å wide filter, i.e. similar to that of the present-day
HINODE SOT/BFI (Tsuneta et al. 2008) and broad Ca II K Rome-PSPT (Ermolli et al.
2007) observations, this contribution is as high as 84–94%. Besides, for observations with
a 1 Å bandwidth filter centred in the red wing of the Ca II K line, more than 99.6% of
the contribution is from atmospheric heights below 160 km.
2. Overview of historical and modern observations
In the early 1890s, Henri Alexandre Deslandres and George Ellery Hale independently
put into practice an instrument to register full-disc photographic images of the chromo-
sphere at the Ca II K and other spectral lines.
This new instrument, called spectroheliograph, comprises two main parts. The first
part is a system consisting of either one or two mirrors directing the Sun’s light to a an
objective lens that focuses the image of the Sun at the entrance window of the second part
of the instrument. This includes a prism or a diffraction grating and a monochromator to
allow the passage of a single wavelength through the exit window of the instrument. Both
the entrance and exit windows are slit shaped. After the exit window the photographic
material used to record the solar image, most commonly being a photographic plate, or
film, and more recently CCD cameras, is placed. A proper displacement of the objective
lens allows the full-disc image of the Sun to pass in front of the instrument’s entrance
slit. With the motion of the Sun’s image at the entrance slit, a proper motion of the
photographic material (or of the recording CCD) allows a full-disc image of the Sun to
be recorded at the wavelength the instrument is operated.
Following the first two models at the Paris and Kenwood observatories, several spectro-
heliographs were built and put in regular operation at different sites, e.g. in 1904 at the
Kodaikanal, in 1915 at the Mt Wilson, in 1917 at the Mitaka, in 1926 at the Coimbra,
and in 1931 at the Arcetri observatories. The spectroheliographs at the Coimbra and
Paris observatories, each equipped with a 45 cm coelostat and 25 cm objective lens, are
Downloaded from https://www.cambridge.org/core. Max-Planck-Institut fuer Sonnensystemforschung, on 04 Feb 2020 at 10:59:46, subject to the Cambridge Core
terms of use, available at https://www.cambridge.org/core/terms. https://doi.org/10.1017/S1743921318001849The potential of Ca II K observations for solar activity and variability studies 117
still operated to this day. In 2008 and 2002, respectively, the photographic plates were
replaced with CCD cameras.
In the 1960s, regular full-disc Ca II K observations started at several sites also with
telescopes equipped with narrow band Lyot-type and interference filters, e.g in 1964 at
the Rome, 1968 at the Kandilli, and in 1971 at the Big Bear observatories.
A large fraction of the historical Ca II K observations is still stored in its original form,
i.e., in photographic archives, some of which have recently been digitized, e.g. the Arcetri
(1931–1974), Kodaikanal (1904–2007), Kyoto (1926–1969), Mitaka (1917–1974), and Mt
Wilson (1915–1985) ones.
At present, routine full-disc Ca II K observations are performed with modern instru-
ments at the Baikal, Brussels, Chrotel-Teide, Kanzelhöhe, Mitaka, Pic du Midi, Rome,
San Fernando, and Valašské Meziřı́čı́ Observatories. These series started in 2003, 2012,
2009, 2010, 2015, 2007, 1996, 1986, and 2013, respectively.
Further information on existing Ca II K archives can be found in e.g. Chatzistergos
(2017) and Chatzistergos et al. (2018a).
3. Scientific programs
Since early observations, regular Ca II K data have been used to monitor the evolution
of the most prominent disc features, in particular of plages and prominences. Besides,
they have long served as diagnostics of the solar chromosphere. For example, Ca II K
data have been used to understand the formation of the Ca II K line and to produce
an atmosphere model of the broad height range sampled by the line. Indeed, the tem-
perature structure of the semi-empirical atmosphere models by Vernazza et al. (1981)
and Fontenla et al. (1993) were also tested on the available Ca II K observations. Over
time, analysis of the differences between spatially-averaged profiles and high-resolution
observations of the Ca II K line in different disc regions have also given hints to the
strongly inhomogeneous and dynamic nature of the chromosphere. However, the most
prominent aspect of the Ca II K line is its ability to provide information about solar
magnetism, due to the large increase in the intensity of the K3 line core when sampling
bright magnetic regions (plage). The potential of the Ca II K observation to serve as
proxy of the magnetic field, which was first noticed by Babcock & Babcock (1955), has
inspired many scientific programs aimed at determining the evolution of the solar mag-
netic field. To this aim, the position, dimensions, number, type, and evolution of the
different magnetic regions observed on the solar disc were derived from the observations
collected at several sites. The measurements of these various parameters were tabulated,
graphically represented, and published in volume series by several observatories. Copies
of the photographic observations were also produced and distributed to various research
centres. Finally, the connection between the Ca II K emission and magnetism has long
served to study the magnetic activity of stars other than the Sun.
The photometric observations obtained over the last two decades have also been used
to analyse the radiative properties of the different disc features in time. For example,
Ermolli et al. (2007) studied the photometric properties of plages over the activity cycle,
from analysis of Rome-PSPT data obtained from 1998 to 2005, showing that selection
effects associated with identification methods can produce significant differences in the
results. They also showed that the plage contrast is a function of the selection method
and the heliocentric angle, but also of the feature size, the activity level, and the con-
tent of the analysed images. Besides, Ermolli et al. (2010) analysed the radiative emis-
sion of various types of solar features, such as quiet Sun, enhanced network, plage, and
bright plage regions, studying the dependence of the measured radiative emission on the
Downloaded from https://www.cambridge.org/core. Max-Planck-Institut fuer Sonnensystemforschung, on 04 Feb 2020 at 10:59:46, subject to the Cambridge Core
terms of use, available at https://www.cambridge.org/core/terms. https://doi.org/10.1017/S1743921318001849118 I. Ermolli et al.
filter bandpass and comparing results from observations with those derived from spectral
synthesis performed on semi-empirical atmosphere models in the literature.
Over the last decade, digitization of some prominent photographic archives has initi-
ated extensive exploitation of the Ca II K series for studies of the long-term variation of
the chromospheric magnetic field and a variety of retrospective analyses. To date, histor-
ical Ca II K data have been mainly used to produce e.g. time series of the disc coverage
of plage and network regions, i.e. of the other obvious magnetic features on the solar
disc besides sunspots. For example, Ermolli et al. (2009b), Foukal et al. (2009), Tlatov
et al. (2009), and Chatterjee, Banerjee & Ravindra (2016) presented plage area time
series derived from analysis of different archives with distinct image processing methods.
The annual mean time series presented by these authors show some similarities between
independent analyses, but also display significant differences in the overall long-term
trends and rank ordering of activity cycle amplitudes. Besides, since Ca II K observations
track the spatial distribution of magnetic flux distribution over the disc, Harvey (1992),
Ermolli et al. (2009a), Chatterjee, Banerjee, Ravindra (2016) produced butterfly dia-
grams of plage regions identified on the Ca II K observations of the Mt Wilson, Arcetri,
and Kodaikanal observatories, respectively. These diagrams complement similar data
obtained from sunspot observations and extend butterfly diagrams derived from magne-
tograms to times when such data were not available. Moreover, to study the magnetic
field at different heliographic latitudes and the toroidal and poloidal components of the
solar cycle, Sheeley, Cooper & Anderson (2011) and Pevtsov et al. (2016) produced Car-
rington maps from Ca II K observations of the Mt Wilson and Kodaikanal archives.
Finally, an analysis of the supergranulation scale variation based on present-day Rome-
PSPT Observations and historical Kodaikanal data was presented by e.g. Ermolli et al.
(2003) and Chatterjee et al. (2017), respectively. Network area measurements were pre-
sented by Foukal & Milano (2001) and Priyal et al. (2014).
Understanding the variation of plage and network properties from analysis of Ca II K
observations has a broader impact than just describing two of the most prominent solar
disc features. Indeed, such measurements may be useful for constraining models of mag-
netic flux transport on the surface of the Sun during multiple sunspot cycles, and for
estimating the long-term contribution of facular emission to the total and spectral solar
irradiance. Accurate and significant analysis of long-term Ca II K series has thus a lot
of potential for new knowledge in solar physics.
4. Comparison among series
All studies listed above confirm some well-known characteristics of past cycles, e.g. they
all report that solar cycle 19 showed remarkably high plage coverage and broad latitudinal
distribution of active regions. They also agree on the overall increase of the solar activity
over the first half of the 20th century and decrease over the last decades. However,
comparison of results presented in the literature also clearly shows that most of the
reported findings are inherently inconsistent, due to large differences in absolute values
and details in the detected short- and long-term trends. These differences affect results
derived from distinct time series, as well as findings from the same archives obtained in
different studies.
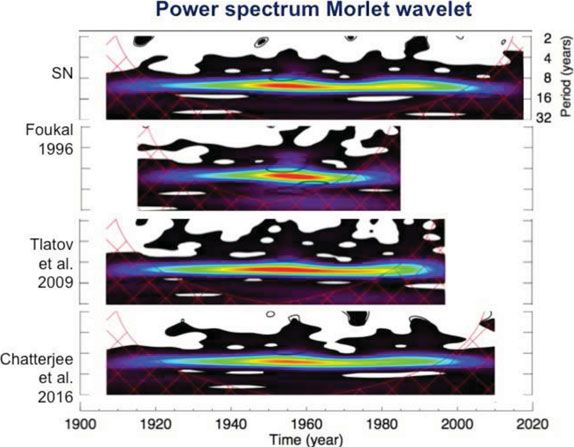
As an example, in Fig. 2 we compare the power spectrum of three published plage area
time series using the Morlet wavelet. In particular, we consider plage area values derived
by Foukal (1996), Tlatov et al. (2009), and Chatterjee et al. (2016) from the Mt Wilson
and Kodaikanal archives and compare them with results for the sunspot number series
(SN); focus is on the periods between 2 to 32 years. The dominant feature in all panels
Downloaded from https://www.cambridge.org/core. Max-Planck-Institut fuer Sonnensystemforschung, on 04 Feb 2020 at 10:59:46, subject to the Cambridge Core
terms of use, available at https://www.cambridge.org/core/terms. https://doi.org/10.1017/S1743921318001849The potential of Ca II K observations for solar activity and variability studies 119
Figure 2. Example of the power spectrum of plage area timeseries reported in the literature
using the Morlet wavelet. From top to bottom, power spectrum of the sunspot number series
(SN) and of the plage area values by Foukal (1996), Tlatov et al. (2009), and Chatterjee et al.
(2016), from analysis of the Mt Wilson and Kodaikanal series. For the sake of clarity the panels
only show the power spectrum for periods between 2 to 32 years. Black to red show low to high
values, respectively.
is obviously the 11 year cycle, and cycle 19 is the strongest one in all records. However,
some differences among the series in the modulation of the high- and low-frequency
variations are also seen. It is worth noting that the considered plage area values were
independently derived from analysis of different datasets, but the studies by Tlatov et al.
(2009) and Chatterjee et al. (2016) are based on images from different digitization of the
same archive.
The discrepancy in published results can be mostly attributed to differences in obser-
vation set-ups, to different samples of considered data, and to the data processing applied
by the various authors. As shown by Chatzistergos et al. (2018b), simple visual inspec-
tion reveals considerable variance between the images taken on the same days at different
sites, because of instrumental and operational characteristics. Furthermore, Ermolli et al.
(2009b) showed that the image quality and contents of three prominent Ca II K archives
varied with time, probably due to instrument changes, aging of the spectroheliographs
used, degradations of the photographic material, and changes in the observing programs.
However, another important reason for the discrepancies in published results is the pro-
cessing applied to the data. Historical observations suffer stronger geometrical distortions
and photometric uncertainties than similar present-day data and hence demand a signif-
icantly more careful processing than modern observations to derive meaningful results
from their analysis. It is worth noting that most of the results presented in the literature
lack error estimates. Chatzistergos et al. (2018a) showed that with proper methods it is
possible to derive consistent and accurate results e.g. of the plage coverage for images
from different Ca II K archives including both historical and modern observations. See
also the contribution by Chatzistergos et al. (2018b) in this volume.
Downloaded from https://www.cambridge.org/core. Max-Planck-Institut fuer Sonnensystemforschung, on 04 Feb 2020 at 10:59:46, subject to the Cambridge Core
terms of use, available at https://www.cambridge.org/core/terms. https://doi.org/10.1017/S1743921318001849120 I. Ermolli et al.
5. Conclusions
A large quantity of full-disc Ca II K observations has been archived at different sites
since the beginning of the 20th century. A few series are still being updated and extended
using either old spectroheliographs or modern telescopes equipped with narrow-band fil-
ters. Some historical observations have been digitized and made available to the commu-
nity. These time series are particularly important because they carry information on the
chromospheric magnetic field over a time span exceeding 110 years. Indeed, apart from
sunspots, chromospheric plage and network are the next obvious magnetic features on
the solar disc and they are clearly spotted in the Ca II K observations.
Analyses of Ca II K time series show both cyclic and long-term variations of plage and
network properties. Results presented in the literature from analysis of available data are
reasonably in agreement, since they all show some known features of past activity cycles
and of long-term solar variation, but also inherently inconsistent, due to differences in
the employed data and the methods used to process the observations.
Understanding variations of both plage and network properties has a broader impact
than just describing two of the most prominent solar surface features. However, meaning-
ful results on the long-term variation of the magnetic field and on solar variability from
analysis of Ca II K datasets require accurate processing of the available observations
and merging of the information stored in different archives. In fact, analysis of multiple
archives is critical for detecting and correcting instrumental trends, both systematic and
otherwise. Besides, study of present-day observations is also fundamental for optimizing
and evaluating the accuracy of the processing applied to historical datasets.
References
Babcock, H. W., & Babcock, H. D. 1955, ApJ, 121, 349
Chatterjee, S., Banerjee, D., & Ravindra, B. 2016. ApJ, 827, id.87
Chatterjee, S., Mandal, S., & Banerjee, D. 2017, ApJ, 841, id.70
Chatzistergos, T. 2017, Analysis of historical solar observations and long-term changes in solar
irradiance (Uni-edition), Göttingen
Chatzistergos, T., Ermolli, I., Solanki, S. K., & Krivova, N. A. 2018a, A&A, 609, A.92
Chatzistergos, T., Ermolli, I., Solanki, S. K., & Krivova, N. A. 2018b, Proc. IAU Symposium
340
Ermolli, I., Berrilli, F., & Florio, A. 2003, A&A, 523, 857
Ermolli, I., Criscuoli, S., Centrone, M., Giorgi, F., & Penza, V. 2007, A&A, 523, 305
Ermolli, I., Marchei, E., Centrone, M., et al. 2009a, A&A, 499, 627
Ermolli, I., Solanki, S. K., & Tlatov, A. G., et al. 2009b, ApJ, 698, 1000
Ermolli, I., Criscuoli, S., Uitenbroek, H., et al. 2010, A&A, 523, A.55
Fontenla, J. M., Avrett, E. H., & Loeser, R. 1993, ApJ, 406, 319
Foukal, P. 1996, GeoRL, 23, 2169
Foukal, P. & Milano, L. 2001, GeoRL, 28, 883
Foukal, P., Bertello, L., Livingston, W. C., et al. 2009 SolPhys, 255, 229
Harvey, K. 1992, The solar cycle, ASP Conference Series, 27, 335
Linsky, J. L. & Avrett, E. H. 1970, PASP, 82, 169
Pevtsov, A. A., Virtanen, I., Mursula, K., Tlatov, A., & Bertello, L. 2016, A&A, 585, A.40
Priyal, M., Singh, J., Ravindra, B., Priya, T. G., Amareswari, K. 2014 SolPhys, 289, 137
Sheeley, N. R., Jr., Cooper, T. J., & Anderson, J. R. L. 2011, ApJ, 730, 51
Skumanich, A., Lean, J. L., Livingston, W. C., & White, O. R. 1984, ApJ, 282, 776
Tlatov, A. G., Pevtsov, A. A. & Singh, J. 2009 SolPhys, 255, 239
Tsuneta, S., Ichimoto, K., Katsukawa, Y., et al. 2009 SolPhys, 249, 167
Vernazza, J. E.;, Avrett, E. H., & Loeser, R. 1981, ApJS, 45, 635
Downloaded from https://www.cambridge.org/core. Max-Planck-Institut fuer Sonnensystemforschung, on 04 Feb 2020 at 10:59:46, subject to the Cambridge Core
terms of use, available at https://www.cambridge.org/core/terms. https://doi.org/10.1017/S1743921318001849You can also read