THE POWER OF BEING UNDERSTOOD - White Paper: Optimizing Supply Chain Cost - Export and Import Logistics - RSM Global
←
→
Page content transcription
If your browser does not render page correctly, please read the page content below
THE POWER
   OF BEING
   UNDERSTOOD

www.rsmindia.in

White Paper: Optimizing Supply Chain Cost - Export
and Import Logistics

THE POWER OF BEING UNDERSTOOD
1.0   Introduction
      India currently has cross border trade of US$ 844 billion comprising of exports of US$ 330 bil-
      lion and imports of US$ 514 billion. India has set an ambitious target of 5% share in global ex-
      ports (US$ 1 Trillion by 2025). Government of India’s policy initiatives such as ‘Make in India’
      and the nation-wide implementation of GST system hold promise for improving India’s global
      competitiveness. Logistics industry would be a crucial enabler for achieving the envisioned
      growth potential - with better stakeholder coordination, enhanced infrastructure, improved oper-
      ational efficiency and enhanced investments

      In this backdrop, RSM India has carried out an intensive analysis to review the challenges in
      Export and Import logistics faced by different stakeholders. This paper aims at exploring differ-
      ent strategies to overcome these challenges and achieve cost efficiency in the Indian business

2.0   Global Logistics Landscape and India’s Position
      About 90% of the world trade by volume is carried out by the shipping industry. Considering
      trade at global level, the economies of scale make shipping the most cost efficient mode of
      perceived that the shipping industry would undergo transformation. India too utilises sea and
      ocean based transportation for about 90% of its exports and imports. A landmark development
      in this context is the ‘New Silk Road’ or One Belt One Road initiative, spearheaded by China
      and involves 34 countries from Asia, Africa and Europe.

       In India, the logistics cost as a percentage of its GDP stands at 14%. This cost is very high
      compared to the similar cost in the US (9.5%), Germany (8%) and Japan (11%). Nevertheless,
      the Government has set a target to bring down this cost to less than 10% by 2022.
      Despite growing over 7% in 2014 – 2018, India
       has the highest share of logistics’ cost to
                                                          Country GDP (in      Logistics    Logistics
      GDP in BRICS nations (Refer Table 1). Also
                                                          (BRICS)    Billion   Cost (As     Costs (in
      if we compare India on LPI (Logistics
                                                                      USD)      share of     Billion
      Performance Index) published by World Bank,
                                                                                 GDP)         USD)
      India is ranked 44th in 2018 with a score of        China     13,368    9.0%         1203
      3.18 while Germany leads with the highest LPI
                                                          India     2,719     14.0%        381
      score of 4.2.
                                                          Brazil    1,869     12.4%        232
      India’s LPI slipped 9 places from 35th Rank        Russia 1,657       6.3%        104
      in 2016 to 44th Rank in 2018. The performance      South  359         11.2%       40
                                                         Africa
      saw a major downfall in the categories
                                                         World  3,638,42 13.0%          4730
      Infrastructure and Logistical Competence.
      This indicates that despite initiatives like ‘Make
      in India’ and ‘Digital India’ and the government                  Table-1 --
      trying to establish Ease of Trade, the challenges Logistics Costs as a share of GDP in
      which need to be addressed, lie at grassroots                  BRICS nations
      level of the supply chain.                                    Source – World Bank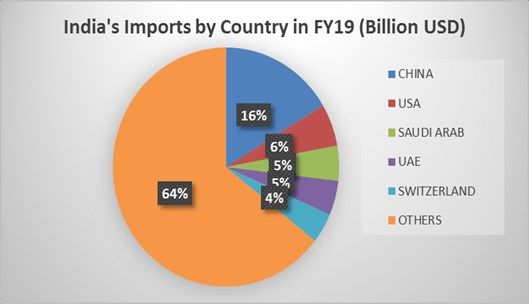
LPI Rank moved
                                                                                       9 places from 35
                                                                                        in 2016 to 44 in
                                                                                                2018

                               Figure 1 -- LPI Comparison of BRICS Nations

               Data Source – World Bank, Logistics Performance Index (LPI)
LPI can be further improved by reducing clearance time, optimizing border procedures (i.e.
speed, simplicity and predictability of formalities) and improving quality of infrastructure (e.g.
improving quality of roads, rail and ports, developing and adopting intermodal hubs, digitization
and technological advancements)

           Figure 2   - Logistics Performance Indicators- India 2016 & 2018 with Germany 2018
                            Source – World Bank, International Scorecard for LPI

India's logistics sector is considered complex with more than 20 government agencies, 40
partnering government agencies (PGAs), 37 export promotion councils, 500 certifications,
10000 commodities, and an 11 billion MTs’ market size. It also involves a 12 million
employment base, 200 shipping agencies, 36 logistic services, 129 ICDs, 168 CFSs, 50 IT
ecosystems and banks & insurance agencies. Further, 81 authorities and 500 certificates are
required for Export and Import. GST is yet to show results and many stakeholders are oblivious
of other reforms.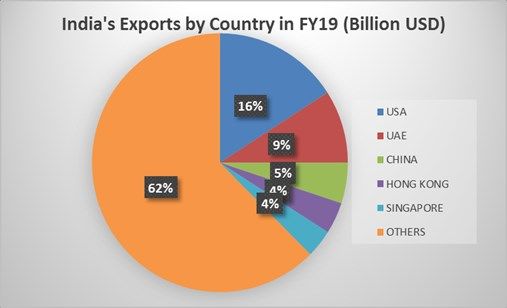
3.0 Import and Export Logistics In India
Trade has been constantly evolving as newer products and technologies have entered the
market. Global trade fluctuations as well as regulatory and domestic market changes impact
the international trade in and out of India.
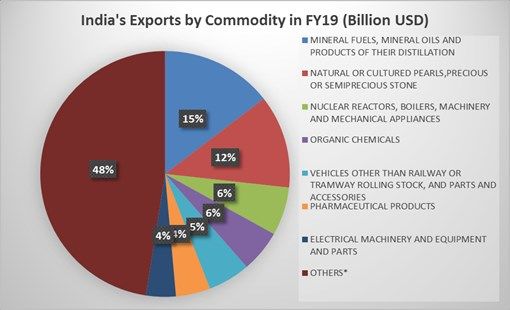
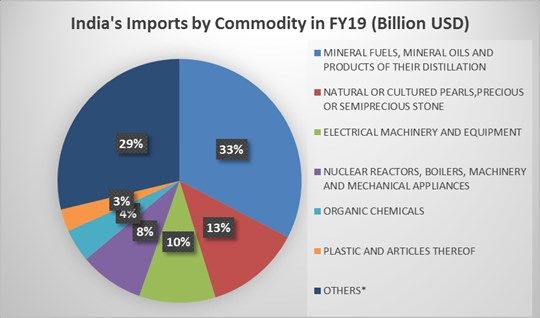
3.1 Imports and Exports - Composition of Trade in India
OTHERS include commodities other than HS OTHERS include commodities other than
codes 27,71,85,84,29 and 39 HS codes 27, 71, 84, 29, 87, 30 and 85
Source - Department of Commerce, Export Import Data Bank, GOI
From the FY19 figures, USA, China and UAE are the major trade partners of India with almost
30% of total imports as well as exports by value are happening with these countries. With
China, our imports have been massively increasing year on year and currently stand at almost
16% of total import value. Current market shifts have a lot to offer to India potentially. With
encouragement in manufacturing and export of Computer Machinery, Electronics and
Handicrafts and Global economies in the state of flux, the logistical landscape is going to vary
accordingly. This has further been discussed in the next section.
3.2 Factors Determining Indian Export and Import Logistics Landscape
A significant shift in logistics landscape in India is envisioned by both declining and upcoming
opportunities in trade, favorable and unfavorable laws, seasonal changes and the shift in sup-
ply and demand. Few factors determining the same are described below:
3.2.1 Global Trade from India:
Shifting the focus from exporting what we can (or supply based), to items for which there is world
demand and where we also have basic competence and rationalisation of tariffs is required.
India’s exports to Most Favored Nations (MFNs) need to be its major exports to generate maxi-
mum revenue.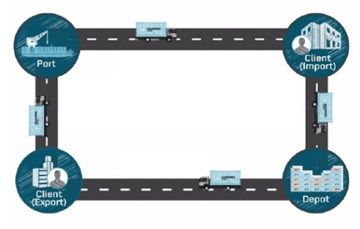
Contrary to expectations, the US-China trade wars did not aid Indian trade in 2019.
However $350-550 billion of exports are estimated to move out of China to India, Vietnam,
Mexico and Bangladesh. With manufacturing being encouraged with ‘Make in India’, Indian
trades have shown an opportunity to take over the market and fill the gap. As an example,
manufactured machinery and electrical equipment is currently worth $34.7 billion in exports.
Even with an adoption rate of only 20%, there is a potential to increase to 200% in the
coming years. This will consequently facilitate the usage of major ports like Madras, based
in southern shores, where most of the electrical manufacturing is centred. A shift in traffic
from traditional ports like JNPT and Mundra is hence expected.
Encouragement to manufacturing sector has seen a rise in imports of good required for
these industries. Under the ‘Manufacture under Bond’ scheme, all factories registered to
produce their goods for export are exempted from import duty and other taxes on inputs
used to manufacture such goods. Against this the manufacturer is allowed to import goods
without paying any customs duty. The production is made under the supervision of customs
or excise authority. This includes small electrical parts from China (supporting India’s
manufacturing of electrical/mechanical equipment), chemicals (as raw material for
pharmaceuticals and cyclic hydrocarbons) and some exports from preferred countries.
Sagarmala Project - It aims to promote port-led development with a view to reducing
logistics cost for EXPORT, IMPORT and domestic trade. Since ports like Nhava Sheva
(JNPT) and Mundra remain congested for most part of the year, the shift on other ports has
become a crucial requisite. As per the studies conducted under the Sagarmala Programme,
it is expected that by 2025, cargo traffic at Indian ports will be approximately 2500 MMTPA
while the current cargo handling capacity of Indian ports is only 1500 MMTPA. A roadmap
has been prepared for increasing the Indian port capacity to 3500+ MMTPA by 2025 to
cater to the growing traffic. This includes port operational efficiency improvement, capacity
expansion of existing ports and new port development.
Summary of projects under Sagarmala (as of 30th September 2019)
Total Completed Under Implementation
Theme
No. of Project No. of Project No. of Pro- Project
Projects Cost (Rs. Projects Cost (Rs. jects Cost (Rs.
Cr.) Cr.) Cr.)
Port Modernization 236 1,18,352 68 22,551 70 36,998
Port Connectivity 235 2,35,528 35 5,803 94 1,19,360
Port Led Industriali-
35 2,40,234 2 512 17 1,51,745
zation
Costal Community
68 7,369 16 1,362 20 945
Development
Total 574 6,01,483 121 30,228 201 3,09,048
Table -- 2
Source: sagarmala.gov.in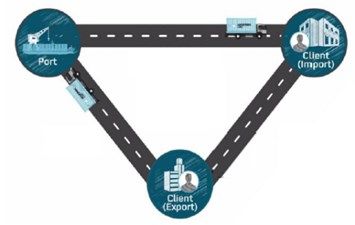
3.2.2 Reforms and Government Initiatives
Indian container based cargo market has shown improvement in transhipment numbers at Indian
ports. With direct port delivery (DPD), direct port entry (DPE), increase in authorized economic
operators (AEOs), port community systems (PCS), digitization and automation of cargo
movement through port gates, etc., we see the key areas of improvement notably saving
significant costs for stakeholders if adopted as expected. Healthy competition among major and
private ports is improving. Other significant measures are:
Infrastructural:
Investments for eight primary warehouse hubs across India to facilitate an efficient hub and
spoke model for the 168 CFS’s and 129 ICD’s.
Completion of the Dedicated Freight Corridors (DFCs) will also enhance the share of rail
freight in the country from the current 30% to around 60-70% as in developed countries.
Schemes:
I. Import Side Measures:
Direct Port Delivery (DPD): This scheme allows registered importers to complete
customs clearances at the terminal itself and thus take the container directly to the factory
(without proceeding to the Container Freight Station). To further increase DPD coverage,
other measures by the Government are:
Default One-Time Intimation – To reduce time and provide ease of transportation
within the port.
JNPT is discontinuing the requirement of physical copies of certain documents (OOC
copy, delivery order issued by the shipping line, proof of payment of stamp duty),
presently being collected by Terminal operators for DPD from port terminal.
“Priority in verification of assessment for DPD importers to assist port terminals in
early evacuation of containers. This would enhance overall speed and efficiency in
clearance of DPD consignments
“On-Wheel” examination within terminal area exists to ensure DPD availability.
e-Sanchit: This is an online application that allows a trader to electronically submit all
supporting documents for consignment clearance with digital signatures. This has been
mandatory for imports at JNPT. This substantially reduces time and costs and makes the
process of clearance paperless
Authorized Economic Operator (AEO) Scheme: It seeks to offer tangible benefits in the
form of faster Customs clearance and simplified customs procedures those business
entities who offer a high level of security guarantee in their supply chains. Average
release time for AEO imports in 2018 was 103.06 hours as against the 144.18 hours on
other imports.
II. Export Side Measures:
Direct Port Entry (DPE): Under this scheme, export containers are allowed direct entry
into the port terminal prior to granting Let Export Order (LEO). Earlier this was only availa-
ble for refrigerated Containers, Over Dimensional cargo (ODC), Motor Vehicles and
perishable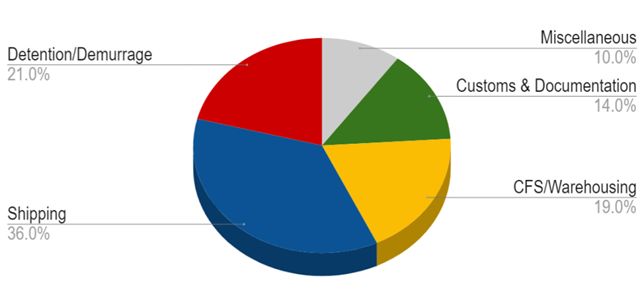
non Refrigerated Cargo and AEO status holders but now it has been extended to all
factory stuffed export containers.
Implementation of Electronic Sealing (e-Seals) of Containers by Exporters under
“Self-Seal Procedure”: This introduces Self-Sealing using RFID tamper proof e-seals
in place of physical seals used earlier. This has significantly reduced clearance time for
export containers. Costs are also reduced as for every supervised sealing, exporters do
not have to bear customs service charges. 158,553 e-Seals were used in 2018.
Reduction in Logistics Cost For North Eastern States :To facilitate connectivity to
North Eastern States through Kolkata and Haldia ports, movement of Export and Import
cargo and reduce logistic costs, an agreement on the use of Chattogram and Mongla
Port for movement of goods to and from India between the Bangladesh and the India
has been established. Haulage distance to Assam has reduced by 450 kms with this
policy.
Government reforms that cater to developing better and efficient logistics become crucial to
understand. Ease of flow in storage units, port logistics, and encouraging trade are other
important factors that are being worked on and will optimise Indian logistics. A new logistics
division has been established in the Department of Commerce by identifying the necessity of
the sector to develop and coordinate integrated development of the industry, improvement in
existing procedures, identification of bottlenecks and gaps, and introduction of
technology-based Interventions.
3.2.3 Technological Developments and Infrastructural Investments
Digital Brokering: Platforms have been developed to track, customise, and monitor the
trader’s cargo. This is aimed at assisting the market to a paperless business environment
for greater transparency and visibility across the supply chain. Examples: TradeLens by
Maersk, CogoPort, Lynkit etc.
SmartShip: Initiated by the Synergy Group, this is an Internet of Things (IoT) platform
that enables on-board operation of multiple systems with varying degrees of autonomy.
SmartShip provides clear, tangible financial and environmental gains in terms of fuel and
predictive maintenance savings, increased safety and compliance and enhanced asset
utilisation. The company estimates that annual savings of fuel and maintenance cost due
to enhanced regulatory compliance and operational performance are in the range of
$150,000 per ship per year.
Remote Temperature Monitoring for Refrigerated Container: To tackle wastage in
perishable exports and cater to the rise in demand of Indian refrigeration based products,
Maersk and Concor and various other digitally integrated forwarders have come up with
the option to provide the trader with real time monitoring of the container’s temperature in
transit. This provides assured quality and prevents losses due to rejects. An app or
software would be provided where the details of the containers can be checked and
controlled. Cold Chain Solution Providers: While India lacks cold chain infrastructure which leads
to losses in perishable products, there has been rapid and sustained growth in
refrigerated exports during the past few years. Commodities like fish, vegetables, fruit and
nuts, meat, pharmaceuticals, and chemicals have been driving constant demand for
Export and import of refrigerated cargo. Refrigerated Indian imports — mostly in
Germany, South Korea, and Russia have also seen a positive inclination, propelled by
their middle class with rising demand for frozen and packaged foods. Maersk and
CONCOR will provide customised refrigerated cargo forwarding and increase capacity to
help the existing cold-chain market. India has also rapidly grown to become the world's
second largest beef exporter, accounting for 20% of world's beef trade based on its large
water buffalo meat processing industry.
Upcoming Infrastructure and Investment:
All Cargo has set up Kolkata’s largest and most equipped CFS. The facility also
houses a 40,000 sq. ft. warehouse and a total capacity of 1800 containers. For
importers, this CFS has been offering the fastest turnaround at the port and the con-
venience of last-mile delivery services.
The rampant growth of e-commerce industry resulted a rise in demand logistics and
warehousing, in Tier-I and II markets. LOGOS India invested about $100 million in
Casagrand Distripark in Chennai, Morgan Stanley Real Estate invested $50 million in
KSH Infra in Pune, and Embassy Industrial Parks pooled in nearly $50 million into DRA
Projects (Bengaluru), in 2019. Warburg Pincus invested about $180 million in Embassy
Group for a project in Bengaluru, while Proprium Capital Partners invested nearly $100
million in Musaddilal Projects in Hyderabad.
Adani Ports and Special Economic Zone will set up its first container terminal outside
India in Myanmar by June 2021 to facilitate trade from east coast.
3.3 Costs Involved in Port Logistics in India
Since major share of global trade in India is done through ocean freight, understanding Port
Logistics and its components becomes essential. It would help in devising strategies as an
exporter or importer by exploring the levers where cost efficiency can be achieved. Analysis of
Indian ports by Niti Aayog and Dun and Bradstreet reveals that majority trades in India face
extra (and hence avoidable) charges due to delays, congestion and other external factors. The
breakup of port logistics is given below :
Figure 3 -- Cost Break-up of Port Logistics in India
Data Source - Report on Performance of Indian Ports- Niti Aayog and Dun&Bradstreet
These costs further vary for imported and exported freights. Since there are many intermediaries,it could be difficult calculating all the variable cost components involved in it. The industry has
given enormous impetus to the intermediary service providers who may impose high charges
that are ultimately borne by traders and add to the cost of the final product. Deriving the logistic
costs from many unorganized players across the value chain of Export and Import cycle is
tenuous and the value will vary based on many variable components like terminal handling
charges, customs charges, sea freight charges, cargo consolidation charges, forwarder & CHA
charges, storage charges, haulage charges, dry port charges, land transportation, mode of
transportation, intermediary charges etc. , the average cost incurred by the trade on port
logistics as a percentage of the total value of consignment at the major container ports is 16%.
Furthermore, detention and demurrage together account for 21% of the total port logistics cost
at the major container ports. 85% trade faces penalties for up to 20% of the year.
4.0 Major Challenges - Indian Export and Import Trade
While most business houses have been dealing with day to day operational and external
challenges, the Export and Import trade performs at suboptimal performance level. These
challenges, if defined properly in the context of the respective businesses, can be overcome by
applying appropriate strategy. In this section we discuss the challenges followed by the
respective strategies to overcome them in the next section. Key challenges faced by the
businesses are given below.
4.1 Process Inefficiencies at Various Stages of Export and Import Cycle Causing De-
lays and High Costs
Unpredictability of Port Processes - There is a lack of standardisation in processes which
makes costs and time for key processes unpredictable. This exists for the same processes
across ports as well as for consecutive processes within an individual port.
Regulatory Issues – Delays in customs clearance of containers from the port
For exports, time taken at the terminal varies from 17 to 46 hours.
Number of documents can range from 3 to 20 for customs clearance, 9 to 15 for
obtaining gate pass and 5 to 14 for getting the delivery order.
Prevents traders from planning a proper fixed structure causing various bottlenecks.
At CFS and Warehousing: Major delays are observed when the cargo transit involves
warehousing. This comprises almost 20% of the port logistics cost. Such high costs and
delays are due to :
Operational Issues – Delays in the processes of CFS tractor trailers (TT) entering
the yard as well as picking up containers. The former issue reportedly pertains to
the availability of the customs officer to clear the cargo from the yard, while the latter
is attributed to multiple factors such as late movement of the TTs from the CFS,
congestion at the port gate, dearth of container handling equipment for loading/ un-
loading and lack of adequate number of TTs at the authorised CFS. Time in transit
(CS/warehouse to terminal) varies from 10 to 32 hours.
Shipping Line-CFS nexus affecting the selection process of CFSs by the importers/
CHAs and also increasing the transaction costs.
This adversely affects the entire management by increasing the Turn Around Time.
E.g. Total inland transit time till loading on vessel can vary from 6-14 days for an
export container from NCR Delhi to nearby ports, while the same for a similar route
in China would be 4-6 days. Transit time and cost is high in India.4.2 True Cost Discovery of Logistics services -
In India, freight cost is generally determined by shipper requesting for quote from multiple vendors
and selecting a lowest value quote for vendor selection. However, very few efforts are taken to
evaluate if cost provided by transporter are realistic or not. There is seldom any practice of
deriving the most realistic transportation cost for a route. This leads to higher supply chain costs.
Most customers realise that the true costs are at least 10-15% lower than their existing
expenditure on certain segments of exports and imports such as land transportation, CFS, cargo
handling, equipment hiring etc.
4.3 Mode of Transport for Inland Movement
Nearly 2/3rd of long haul freight is carried by road, which adds 25% to 30% more to logistics cost
in comparison to using multimodal transportation
Share of railways in moving freight is only around 33% (International Average is 55%), and
the demand for railways fell 8% in the 3rd quarter of FY20.
111 officially notified Inland National Waterways are not being used to their full potential.
Customers pay INR 3 per MT per Km of freight through roadways in comparison to a cost of
about INR 1.12 per MT per Km in waterways.
Multimodal infrastructure is often incorrectly assessed without considering the first and last mile
and this has proven to be one of the major stumbling blocks in the end-to-end chain.
4.4 Low Penetration of New Initiatives -
The major Government initiatives to ease logistics at ports in 2018-19 were adopted for only
40% of the total trade. Reforms have difficulty reaching the target as stakeholders remain
uninformed and decline proper consultancy. For example, the target set for Direct Port Delivery
(DPD) was 80% of total imports by the end of 2018. But by March 2019, DPD share in total
import was only around 40% at JNPT and 45% at Chennai port. Similarly, paper based
documents are still prevalent due to ports not adopting electronic documenting as proposed the
Department of Commerce.
4.5 Lack of Cold Chain Infrastructure Leading to Wastage
India loses 40% of agricultural production to wastage in the supply chain, whereas In OECD
countries, the loss of agricultural products during shipment is on the order of 2% to 3%. Absence
of Reefer container linkages and high and increasing power costs are proving to be major hurdle
in growth of import/export of perishable cargo. High wastage further leads to income loss and
inflation of over all prices for final consumer. For example, in India merely 4% fruits and
vegetables are transported through cold chain logistics compared to 85% in the U.S. The total
value of India’s wasted fruit and vegetables is INR 44,000 Cr per year. Lack of cold chain and
inefficient last mile distribution has restricted basic vaccines’ penetration to 60–70%. .
4.6 Sub-optimal Shipment Planning
Planning of the shipment is carried out without looking at a holistic view of the cargo size, total
shipment quantity, etc. For example, small size cargo/shipments need not fit completely in a 20’
container, leaving large underutilised volumes.
Lower Than Container Load (LCL) options are available and cost effective for smaller size
shipments. By not planning the shipments/imports using such facility leads to additional
costs. On the other hand, a huge shipment which should have been planned using 40’
containers arrives with 50% quantity in 20’ containers. The ocean logistics and han-
dling costs are comparable for both 20’ and 40’ HC. However, the shipper/importer
loses opportunity to save potential costs by not planning for higher size containers.
4.7 Improper Vehicle Selection and Utilisation
Cargo characteristics are rarely linked to selection of the mode of transport, storage and terminal
handling protocols. Trucks are one of the most critical assets that offering a great value in inland
transportation networks. Ample time is not invested in evaluating what all types (tonnages) of
trucks are needed for their dispatches. Typically truck type selection and allocation is left on
market availability and historical usage which is a not a smart practice. As a result, the high cost
nodes like roads are highly utilized at the expense of cost-effective modes like inland waterways
and railways.
4.8 Underutilisation of Infrastructure
India lost around US $ 45 billion in 2017 due to poor utilisation of logistics infrastructure, which
is equivalent to 2% of India's GDP. By 2020 it is expected to go up to 5%, which might amount
to wastage of US$ 140 billion (Report by McKinsey & Company). Not utilising owned or hired
machinery, labor and other infrastructure to their full potential counts as an investment without
returns.
For example, in FY 2018-19, total throughput of Indian container terminals registered was
16.99 million TEUs with year-on-year growth of 10.5%. In the same year, total installed
capacity available is 28.65 million TEUs, with capacity utilization of 60%. West coast ports
capture 66% of overall.
Indian capacity by contributing 72% of total Indian container volumes majorly supported by
largest container terminals of JNPT and Mundra terminals. East coast ports handled 28% cent
of overall Indian container volume out of 34% of total Indian container capacity.
4.9 Lack of Technology Causing Incompetent Trade
IT systems and EDI (Electronic Data Interchange) facilities are insufficient. As such, it is not
always feasible to depend on a standardized system to transfer information electronically, which
makes it hard to get real-time status of operations and services causing delays. Another key
limitation is slow adoption of new technologies. There is less awareness about the economic
benefits of using digital technology and alliance among stakeholders. Not opting for strategies
like IoT for automation to reduce manual errors, block chain, cloud computing, data analytics to
strategize dispatches according to demand etc. makes the logistics ecosystem fraught with
operational inefficiencies and poor asset utilization.
4.10 Dispatch Skews during Peak Shipping Days
Carriers charge as much as 40-50 per cent extra towards the end of the month. Since most
manufacturers and sellers rush work towards the deadline, the month end witnesses extremely
high demand and gets congested for transport, hence the high cost. This is most commonly
observed during festive periods like Diwali and New Year’s Eve.
4.11 Losing Substantial Share of Consignment in Quality Rejects
Despite leaving the supplier warehouse in good condition, the goods face damage at either the
Port of Discharge, Carrier (improper packing, faulty container, water seepage, rust) or due to
unavailability of functioning equipment. 17% cargo at major ports faced damages due to poor CHE
(Cargo handling Equipment) in 2017.4.12 Inefficiencies in the Final Mile Delivery
Last Mile or Final Mile delivery is significantly different from long haul trucking. It is growing ex-
ponentially due to accelerating urbanization and the market is projected to grow from current INR
2.6 trillion to INR 13.6 trillion by 2026. For frequent exporters and importers (E-Commerce, Food
and Beverages, FMCG), it is highly essential.
The cost is extremely high (for e.g. In E-commerce Supply Chains Final mile counts 53% of
the Logistics Cost)
It creates significant externalities such as congestion and pollution
Major Inefficiencies in Final miles Deliveries are as under:
Underutilisation of resources (Vehicles/People/Time)
Lack of Infrastructure at the delivery points
Location of Warehouse from which shipment originates: Logistical sprawl phenomenon
resulting lower deliveries per trip .
4.13 External Factors Affecting Import Export Logistics
With infrastructure largely being under-developed and incapable of catering to a growing
economy, logistics management in India becomes quite convoluted. Unsatisfactory condition of
infrastructure directly translates to higher turnovers, pushing up operating costs and reducing
efficiency. Complex regulatory compliances like Restrictions under the Cabotage Law and limited
adoption and utilization of technology at the ports have resulted in increased documentation and
inability to communicate effectively with customers. Poor condition of roads, rising price of fuel,
slow adoption of GST are among others.
It can be seen that Indian Export and Import Market is primarily being held back due to factors
like regulations, inefficiencies in paperwork, out-dated technology, irregular operational time
division and quality rejects which hamper the process whereas major exporters like USA,
Members of EU and China, being operationally strong in their value chain and policies, face
problems at internal levels like pricing, demand analysis, business models etc. This implies that
despite good business plans and products, Indian traders cannot make full usage of their
potential. Hence it becomes of penultimate importance to understand ways in which the
productivity of the trade is increased and goals are reached faster.
5.0 Cost Optimization Levers for Export and Import Logistics
Spending $380 Billion in 2018, India’s logistics costs are about 40% higher than that in most devel-
oped countries. A reduction will result in more competitive goods and services, resulting in more
trade and commerce. In the backdrop of the growing importance of maritime trade to the Indian
economy, it becomes crucial to identify and plug the logistical loopholes that are dragging Indian
Exports and Imports. The Department of Commerce estimates that a 10 per cent decrease in indi-
rect logistics cost can increase 5-8 per cent of exports. Some cost optimization levers are de-
scribed in the following paragraphs to address key challenges faced by the business community.
5.1 Process Improvements
Since there is significant inefficiencies at different stages of Export and import logistics it is im-
portant to critically analyse processes to identify non value adding activities. Tools like value
Stream Mapping (VSM), Four Field Process Mapping, etc. should be used to map the processes
like documentation clearance, CFS Turn-Around-Time, customs handling etc. The process steps
should be analysed with the following approachE - Can it be Eliminated
C - Can it be combined with Another Step
R - Can it be Rearranged
S - Can it be Simplified
A - Can it be Automated or Digitized
This type of process improvement drives 20% - 30%
reduction of time and other resources required to carry
out operations leading to reduced costs.
5.2 True Price Discovery of Key Logistics Services
Prices for land transportation, CFS, equipment line handling etc. should be verified and re-verified
from multiple service providers to get the true rates. The method provides a fundamental means
of arriving at the realistic estimate of cost using all cost element and draw a reference limit of
should be costs. This becomes a very strong negotiation tool. Cost models for different services
can be developed and made dynamic in order to adapt to changing situation.
Online exchanges can be useful to understand the shipping costs on a particular route. For
example, ‘The Baltic Dry Index’ which is reported daily by Baltic Exchange in London. The Baltic
Exchange provides a benchmark for the price of moving major raw materials (iron ore, crude oil,
cement, coal etc) over 23 different shipping routes.
Moreover there are ocean freight aggregator platforms to check and verify ocean freights
provided by different shipping companies on the spot. For example, globally ‘Freightos’ and in
India ‘Cogoport’ are such platforms to compare ocean freight rates of different shipping
companies.
5.3 Selection of Incoterms
Before venturing into exports/import is important to understand the best Incoterm based on the
product and convenience which would make logistics risk free and cost efficient.
When negotiating an Incoterm with buyer/supplier, keep in mind that the Incoterm you decide
should be on the basis of maximising revenue (for Exporter/Seller) and cargo quality and
minimising costs (for Importer/Buyer) and risk. Try to come to a mutual understanding and make
sure all points are clearly defined to avoid problems. Refer below table to understand the most
commonly used incoterms for Export and import along with their benefits.
Suitable Incoterms to opt as Importers
Table -- 3
Incoterm FOB (Free on Board) CIF (Cost Insurance & Freight)
Transfer of Risk On board vessel On board vessel
Packaging Seller Seller
Loading Seller Seller
Delivery to Port Seller Seller
Export duty, taxes and
Seller Seller
security clearance
Origin terminal
Seller Seller
chargesLoading on carriage Buyer Seller
Carriage charges Buyer Seller
Insurance Buyer Seller
Destination terminal
Buyer Buyer
charges
Delivery to destination Buyer Buyer
Import duty taxes and
Buyer Buyer
security clearance
1) You are in charge of hiring the 1) Supplier bears all costs up to
international shipping services. the port of discharge.
2) Gives you absolute control of 2) Minimal responsibilities for
all expenses and co-ordination you as importer, knowing that
of cargo delivery to the final the exporter is responsible to
destination. ensure shipment safely at the
3) Hence, you can negotiate the port.
freight cost according to your 3) Recommended only when
Benefits convenience. you have a long term contract
4) Recommended when it is an with a trusted supplier
established business with a long
history of dealing with
stakeholders, since there would
be awareness about customs
and logistics of their own operat-
ing region.
Table-- 4
Suitable Incoterms to opt as Exporters
Incoterm EXW (Ex-Works) CFR (Cost and Freight)
Transfer of Risk At Buyer's disposal On board vessel
Packaging Seller Seller
Loading Buyer Seller
Delivery to Port Buyer Seller
Export duty, taxes and
Buyer Seller
security clearance
Origin terminal
Buyer Seller
charges
Loading on cariage Buyer Seller
Carriage charges Buyer Seller
Insurance Buyer BuyerDestination terminal
Buyer Buyer
charges
Delivery to
Buyer Buyer
destination
Import duty taxes
and security Buyer Buyer
clearance
1) Competitive and does not
1) Exporter delivers simply when involve too much risk.
the goods are placed at the 2) Seller has control over the
disposal of the buyer at an international shipping cost up to
agreed point, which are usually the port of discharge.
the seller’s own premises. 3) This gives the flexibility to
2) More inclined with seller as opt for most cost effective
Benefits
they do not need to have shipping options such as best
concerns regarding the freight routes, rates and transit time.
after it has left their locations. 4) Recommended when along
3) Recommended when the with manufacturing, the
business is solely of business also professionally
manufacturing. comprises packaging and has
contacts with forwarders.
5.4 Freight Consolidation-Deconsolidation for Smaller Shipments
In cases of smaller size/volume shipments, one needs to avoid paying extra charges for the
volume which is not occupied and use freight consolidation by accommodating small packages
into LCL (Less Than Container Load) shipments. This is for small ocean freight shipments not
requiring the full capacity of an ocean container – usually less than 20 CBM (cubic meters).
Reduced transit times of LCL hub movements have provided opportunity to shippers to move their
LCL consignments faster, at extremely cost effective LCL sea tariffs. Due to the reworking of such
cargo at nominated hub points within India, direct destination sailings to USA, Europe, Africa, Gulf
etc., become available via the Mumbai/Chennai transshipment HUBs. This also reduces the sea
transits for LCL movements, which otherwise have to face a more expensive transshipment at
locations like Singapore or Colombo.
LCL movement from Terminals to Port is taking place both by Rail as well as by Road. At present,
Dronagiri Node is the major consolidation hub for LCL cargo.
Examples: Small businesses, goods requiring one-time export/import, cargo with spare parts
5.5 Route optimization
Route and the respective mode of transport need to be evaluated for shipments in and out of the
company premises. Companies can explore route optimization possibilities for surface (source to
nearest port) as well as container shipping routes. Knowledge of available infrastructural and oper-
ational facilities and selection of the end to end route becomes critical while planning for large ship-
ments.
Cargosmart has launched a software called ‘Route Master’, for optimization of container shipping
routes in 2017. Route Master helps the customers visualize and optimize their ocean containershipping routes based on weighted parameters and improve the route planning process. It
provides the company with exact port pair and service details to match the specific needs. The
software also prepares for contracting with the carriers. It also provides valuable information to
share to demonstrate the options available and the basis for recommending specific services The
insights help to build the routing guide to ensure that customer teams book according to the plans
that best meet their customers’ needs.
Figure-- 4
Route Optimization scenarios in Exports – Potential Options
Port 1
Dry Port 1
Port 2 Customer
Dry Port 2
Dry Port 3 Port 3
Port 4
Road
Rail
Sea
As shown in above figure, various routing options can be explored by considering key criteria like
transit time, total cost, distance, customer choice as well as potential damages to cargo.
Evaluation of each option can be done using these criteria and optimum route can be selected.
5.6 Optimising Load – Using The Right Container Mix
Since ocean carriers charge a rate per-container, the container quantity should be optimised to
bear minimum cost. For example, there is a small ocean freight cost difference between 20ft. and
40 ft. HC due to the volumetric consolidation. Using a 40HC container instead of two 20 ft.
containers makes huge savings for large freight quantities. You load the same amount of cargo by
paying a significantly lower price. The port handling charges can reduce by up to INR 2500 per
container at major ports and SSR charges by INR 5000.
5.7 Using Multimodal Logistics and 3PL services
Using different modes of transport at different stages of the path for your good under the same
contract can help the cargo reach quicker and can optimize costs. Proper analysis of volume and
type of goods and their destination needs to be made in choosing the vehicle and means.
Multimodal transport can be also be intermodal, where different types of vehicles will be used to
transport the load, or combined transport that will use the same chain of vehicles to move the
load.
Most popular multimodal strategies in India have been the Sea-Rail and Sea-Rail-Road and
sometimes inland waterways. Usage of Railways: The following can be opted for
15 Private Freight Train Operators (PFTOs) as 3PL (Third Party Logistics). Example:
Hind Terminals, DP World, Adani Logistics, CWC all moving their own trains
Run your own Private Freight Terminals (PFTs). Under this scheme, operators can
lease rakes from Indian Railways to have their own rakes manufactured
Usage of Inland Waterways: The cost of coastal shipping, per MT per kilometre, is two to
three times lower compared to either roads or railways. Shipping through rivers would cost
only INR 1.12 per MT of freight in comparison to the INR 2-3 via roads. A Deloitte-
Assocham report states that "addressing these inland logistical anomalies alone provides a
huge potential to lower logistics cost in the economy by INR 21,000-27,000 Cr by 2025".
Opportunities on the East Coast:
Freight village development in Varanasi along the river to enhance the potential of
Eastern DFC and to augment traffic capacity along the National Waterway 1.
Inland waterways cargo movement from NW-1. Used by PepsiCo, Dabur, Emami,
IFFCO from Kolkata to Varanasi.
The world’s largest container company Maersk Line has also started the movement of
goods on that route.
Opportunities on the West Coast:
Transportation through Kandla port in the west via western DFC, aggregation in Palwal
and then distribution via road to U.P, Punjab and Haryana.
Port led cargo movement is inclined heavily towards the west coast due to the presence
of natural harbours and economic weight of Maharashtra and Gujarat.
5.8 Adapting New Government Initiatives
DPE, DPD, AEO, E-Sanchit and various other schemes have been let out by the Government to
ensure faster and smoother logistics. They not only reduce time but also cut on Port Handling
charges, saving up to Rs7000 per container and eliminate the effort of loading and unloading the
truck twice. With E-Sanchit the number of paper based documents is aimed to be halved from the
current 115 documents. This helps in overcoming the challenge of massive variation that exists
on the ports and prevents penalties due to delays, saving both time and costs.
5.9 Tracking and Monitoring Shipments
Make sure you’re caught up with the departure and arrival date and time of the vessel. Remain in
constant communication with your freight forwarder so they can inform you of any changes. Plan
your import container movement from Port to destination within 48-72 hours after vessel berthing
in order to avoid container ground rent charges. Similarly in case of export shipment, plan your
shipment one week ahead before vessel berthing so that the container reaches port on time and
you need not have to bear the SSR (Special Service Request) charges to gate in the containers
after vessel cut- off date and time.Strategies like online tracking systems, synchronizing the logistics with dispatch planning and
receiving alerts for any deviations can be used for tracing. This avoids detention and other
penalties and reduces the risk of negligence.
5.10 Negotiating better contracts
Significant savings can be potentially availed while the customers negotiate with different service
providers on short or long term. Higher volumes attracts discounts from the service providers.
With considerable volume and frequency of Export and Import shipments, one should demand
the volume discounts which can be offered by major service providers across the supply chain
like Freight forwarders, Shipping line, CFS (Container freight stations), Concor (For Rail
movement), and Custom clearing agents.
Since large ports like JNPT and Mundra have a relatively higher number of CFS (35 and 9
respectively), competitive rates can be obtained. Also it can be seen that some CFSAI member
agencies have facilities across multiple ports and hence in cases of multi-port involvement in the
Export and Import Business, it is another opportunity to try and get cheaper rate by using the
same CFS provider. Moreover, the importer / exporter should look at combining volumes of all
group companies to avail maximum discount.
5.11 Shipping During Off-Peak Days and Times to avoid GRIs
Proper analysis of supply and demand should be made to avoid general rate increase (GRI)
during peak days. Traders should also stay updated with global trends and market stability to find
the best shipping time. For example, a larger GRI can be triggered by lack of container capacity
along particular shipping lanes. On The Contrary, the GRI will be lower if the demand for vessels
along shipping lanes is lower than normal which results in giving you better rates than before .
The best way to avoid getting impacted by a GRI is shipping on off-peak days and being prepared
for the congestion during the festive season. You can also negotiate set rates with a third-party
logistics (3PL) carrier and enter into a contract.
Using this tactic in road logistics saves as much as 40%-50% of truck haulage cost in India.
5.12 Using Data Analysis and Information Technology
Reducing manual intervention to bring down costs: Artificial intelligence (AI) can help
out in automating business processes to remove manual processes for freight handling
which improve quality, speed up processes and subsequently bring down logistics costs.
Block chain Technology: This technology has enormous potential and significance in the
Indian context, given the fragmented nature of the sector and lack of common platforms to
share information . It can be used to improve the utilisation of infrastructure and assets,
synchronizing multi-party logistics chains etc. For example, TradeLens blockchain-enabled
digital shipping platform jointly developed by Maersk and IBM in 2019 empowers
businesses and authorities along the supply chain with a single, secure source of shipping
data, enabling more efficient global trade. Major ocean carriers such as Hapag-Lloyd,
Ocean Network Express, MSC and CMA CGM are looking forward to adopt TradeLens.
Data analysis and big data management should be adopted to develop algorithms and
estimate the remaining useful life of assets, identify areas of operational inefficiencies,
eliminate redundant costs and drive future strategy.5.13 Container triangulation
For Export and Import businesses performing exports as well as imports (Examples - Jewellery,
Precious Stones, and Assembly of Electronics etc.), the shipping agency can be contacted
reutilise the import containers it ships into India by triangulating the import boxes for export
movements, thereby optimising on repositioning empties reduces risk, since the entire process
would fall under the same contract can save about 7-10% (up to 15,000 per interchanged
container) of backhaul shipping costs (i.e. reduced cost of empty containers’ shipping)
Agencies like MatchLog (As a part of MSC at Gujarat based ports) and Maersk (At Nhava Sheva,
Mumbai) have recently tapped into this breakthrough. The process is entirely digitalised, where
you can track your Export and import shipment along with the empties and can also avail Value
Added Services like insurance and transit customs. Although most such operations are currently
available for inland road transport, the concept, if implemented on a pan-India basis in Export and
Import, will help cut costs on container logistics by as much as $10 billion a year says a report by
MatchLog.
Triangulation can be arranged directly with the shipping line, as this is an excellent way to save a
transport leg, saving you costs while still making the same money from your customer.
Traditional Trade logistic Trade logistic with container triangulation
Loaded movement Empty movement
Figure-- 5
6.0 Conclusion
The Export and Import logistics landscape in India is undergoing significant transformation,
while India has set ambitious goals for international trade. World trade continues to get
disrupted due to geo-political changes and India’s contribution to the global trade gets further
impacted by regulatory policies and domestic demand / supply situations. The Export and
Import logistics has seen several positives during the last few years, and expectations of higher
infrastructural developments lead to a strong positive outlook for Export and import trade from
and to India.The Export and Import business community has experienced declining margins due to stiff
global competition in the International market, and it will further shrink unless the businesses
proactively take actions. Logistics spend continues to be one of the largest component of the
Export and import costs. Exporters and Importers have acted on some of the key elements of
the costs in the past few years. However, there are several inefficiencies, still to be addressed.
We have pointed out some critical areas which need to be focused and strategies to be applied
to improve cost efficiency in Export and Import Logistics costs. The potential for cost reduction
remains very high, which can lead to strengthening the competitive advantage for India’s Export
and Import trade.
Sources:
CARE Ratings
CFSAI
IMF, World Bank, CIA Library
Containers India, Maritime India Services
Bibliography:
India - On the Cusp of a Logistics Revolution- Deloitte
A Study on the Performance of Major Ports in India -International Journal of Management
(IJM) Volume 6, Issue 10, Oct 2015, pp. 48-55, Article ID: IJM_06_10_007
Port Logistics Issues & Challenges in India Published in India by Dun & Bradstreet
Information Services India Pvt Ltd
Indian Container Market Report 2019, Containers India
News articles from Business Standard, Economic Times, Business TodayFor further information please contact:
RSM Astute Consulting Pvt. Ltd.
13th Floor, Bakhtawar, 229, Nariman Point, Mumbai -
400021.
T: (91-22) 6108 5555 / 6121 4444
F: (91-22) 6108 5556 / 2287 5771
E: emails@rsmindia.in
W: www.rsmindia.in
Offices: Mumbai, New Delhi - NCR, Chennai, Kolkata, Bengaluru, Surat, Hyderabad, Ahmedabad, Pune,
Gandhidham, and Jaipur.
facebook.com/RSMinIndia
twitter.com/RSM_India
linkedin.com/company/rsm-india
RSM Astute Consulting Pvt. Ltd. (Including its affiliates) is a member of the RSM network and trades as RSM. RSM is the trading name used by
the members of the RSM network.
Each member of the RSM network is an independent accounting and consulting firm each of which practices in its own right. The RSM network
is not itself a separate legal entity of any description in any jurisdiction.
The RSM network is administered by RSM International Limited, a company registered in England and Wales (company number 4040598)
whose registered office is at 50 Cannon Street, London EC4N 6JJ .
The brand and trademark RSM and other intellectual property rights used by members of the network are owned by RSM International
Association, an association governed by article 60 et sec of the Civil Code of Switzerland whose seat is in Zug.
This newsflash is general in nature. In this newsflash, we have summarized various aspects of the supply chain cost dimension in Export and
Import Logistics . It may be noted that nothing contained in this newsflash should be regarded as our opinion and facts of each case will need to
be analyzed to ascertain applicability or otherwise of the said notification and appropriate professional advice should be sought for applicability of
legal provisions based on specific facts. We are not responsible for any liability arising from any statements or errors contained in this newsflash.
30 January 2020
© RSM International Association, 2020You can also read