The Role of the Ostensives in Understanding Quantitative Statistical Variables
←
→
Page content transcription
If your browser does not render page correctly, please read the page content below
ISSN: 2178-7727
                                                                            DOI: 10.17648/acta.scientiae.6532

The Role of the Ostensives in Understanding Quantitative
                  Statistical Variables
                                                                     a
                                     Irene Mauricio Cazorla
                                        Afonso Henriques a
                                                                        b
                                     Gleidson Santos Correia
                                                                    c
                                      Cláudio Vitor Santana

       a
        Universidade Estadual de Santa Cruz, Programa de Pós-graduação em Educação em Ciências e
                                        Matemática, Ilhéus, BA, Brasil
  b
      Centro Territorial de Educação Profissional Litoral Sul, Comunidade Quilombola, Maraú, BA, Brasil
         c
           Colégio Estadual de Educação Profissional em Biotecnologia e Saúde, Itabuna, BA, Brasil

             Received for publication 25 Mar. 2021. Accepted after review 1 Jul. 2021.
                      Designated editor: Claudia Lisete Oliveira Groenwald

            ABSTRACT
          Background: One of the main challenges of teaching statistics in basic
education is the treatment of quantitative statistical variables because, besides the
calculations involved in the abstract measures, understanding the behaviour of these
variables and the meaning of their statistics is complex by their very nature. In this
sense, using manipulable concrete materials and the student’s action as ostensive
mathematical objects in the management and representation of this type of variable can
help understand them. Objectives: this research investigates how the concrete
manipulable materials and the student’s action contribute to understanding and
representing quantitative statistical variables in different registers. Design: we make
theoretical reflections on the active use of the ostensive objects in the representation
and transformation of data into statistics – tables, graphs, and summary measures – in
basic education based on the anthropological theory of the didactic and the theory of
registers of semiotic representation. Data collection and analysis: this is a theoretical
study that uses results already published in related research. Results: the analyses point
out that the use of the ostensive objects helps students’ understand the statistical
concepts and that from this point on, they represent and transform the representations
of statistical information in different registers more fluidly. Conclusions: the study
reveals that using the ostensives and the students’ actions in managing statistical
concepts is a fundamental aspect of learning.
          Keywords: Quantitative statistical variables; Statistical data; Concrete
manipulable material; Student actions; Ostensives.

__________________
Corresponding author: author’s full name. Email: author@emaildomain.com

                              Acta Sci. (Canoas), 23(4), 16-51, Jul./Aug. 2021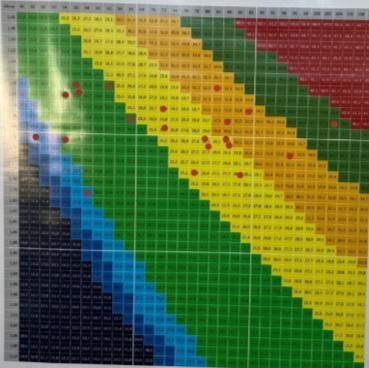
O papel dos ostensivos na compreensão das variáveis estatísticas quantitativas

        RESUMO
         Contexto: um dos principais desafios do ensino de Estatística na Educação
Básica é o tratamento das variáveis estatísticas quantitativas, pois além dos cálculos
envolvidos nas medidas resumo, a compreensão do comportamento dessas variáveis e
o significado de suas estatísticas são, pela sua própria natureza, complexas. Nesse
sentido, o uso de materiais concretos manipuláveis e o papel da ação do estudante como
ostensivos na gestão e na representação desse tipo de variável podem auxiliar nessa
compreensão. Objetivos: esta pesquisa investiga como os materiais concretos
manipuláveis e a ação do estudante contribuem para a compreensão e representação das
variáveis estatísticas quantitativas em diferentes registros. Design: tecemos reflexões
teóricas sobre o uso ativo dos ostensivos na representação e transformação dos dados
em estatísticas – tabelas, gráficos e medidas resumo – na Educação Básica a partir da
Teoria Antropológica do Didático e da Teoria de Registros de Representação Semiótica.
Ambiente e participantes: trata-se de um estudo teórico que utiliza resultados já
publicados em pesquisas correlatas. Coleta e análise de dados: esses dados foram
coletados a partir de artigos publicados em periódicos científicos bem como em
dissertações disponíveis em meio digital. Resultados: as análises apontam que a
utilização dos ostensivos ajuda na compreensão dos conceitos estatísticos pelos
estudantes e que a partir disso esses estudantes tem maior fluidez na representação e
transformação das representações das informações estatísticas em diferentes registros.
Conclusões: o estudo revela que a utilização dos ostensivos e da ação do estudante na
gestão dos conceitos estatísticos é um aspecto fundamental na aprendizagem.
         Palavras-chave: variáveis estatísticas quantitativas; dados estatísticos;
material concreto manipulável; ações dos estudantes; ostensivos.

        INTRODUCTION
        Statistics contents in basic education in Brazil were officially included
in 1997 with the publication of the National Curriculum Parameters by the
Ministry of Education (MEC, 1997) and later ratified in the BNCC Common
Curriculum National Base (MEC, 2018).
         This inclusion is due to the recognition of the importance of thought
and statistical literacy for reading and understanding the world, which became
much more evident in the context of the Covid-19 pandemic, when terms that
were usually within academic scope became part of the population’s jargon,
assisting in public managers’ and citizens’ decision making, as shown in the
works of Alsina, Vásquez, Muñiz-Rodríguez, and Rodríguez-Muñiz (2020),
Rodríguez-Muñiz, Muñiz-Rodríguez, Vásquez, and Alsina (2020), Correia and
Cazorla (2020), and Samá, Cazorla, Velasque, Diniz, and Nascimento (2020).

                       Acta Sci. (Canoas), 23(4), 16-51, Jul./Aug. 2021             47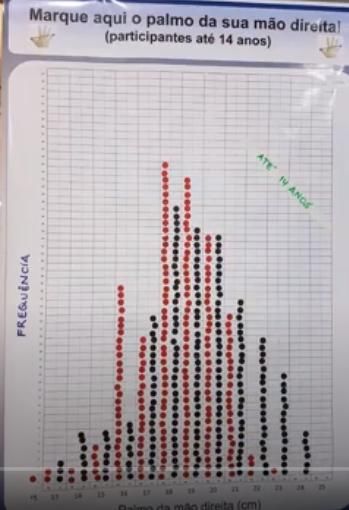
In this sense, the scientific production in the field of statistical
education has been very profitable, as can be seen in the various review works
(Santos, 2015; Oliveira Junior & Vieira, 2015; Schreiber & Porciúncula, 2019;
Tavares & Lopes, 2019; Oliveira & Paim, 2019). These mappings indicate an
increase in the studies in statistics teaching, mainly in basic education.
         There has also been some progress in the production of material for
statistics teaching. Lima, Bezerra, and Valverde (2016) used colourful little
balls with bags and, by drawing lots, developed basic concepts of probability
and statistics with elementary school students. Silva (2019) built the “statistical
box” using wood and styrofoam pellets to develop population concepts, sample,
and sampling methods with high school students. Porciúncula and Schreiber
(2019) reported the positive perception of prospective mathematics teachers
when using manipulable concrete materials didactically.
        Despite all this progress, we still find there is a lack of understanding
of basic statistical concepts. When investigating the specific knowledge of
mathematics teaching degree students, Oliveira (2020) found that the freshmen
and senior students still had conceptual gaps and misunderstood basic concepts.
        One factor that explains that gap is that the students do not understand
how data can and should be collected, or how raw data becomes statistics -
which are thought, here, as the set of concepts and procedures that involve the
process of organising and summarising data, i.e., tables, graphs, and summary
measures, a procedure that gets more complex when we consider the
quantitative variables.
         According to Pfannkuch and Rubick (2002), one of the key points in
statistical research is to define measures that “capture” qualities or
characteristics of the elements that compose the population of the phenomenon
to be investigated. For this reason, we should pay particular attention to the
concepts of variables and the statistical data generated by their
operationalisation. In this context, the practical material that can be
manipulated can play a fundamental role, especially when those concepts are
presented for the first time.
       Manipulable concrete material in mathematics teaching is very much
used, especially in early childhood education and in the early years of
elementary school. This trend is also seen in statistics teaching, as shown by
the works of Selva (2003), Caetano (2004), Alsina (2017), Cazorla, Henriques,
and Santana (2020), among others. This seems to be partly explained because,

48                    Acta Sci. (Canoas), 23(4), 16-51, Jul./Aug. 2021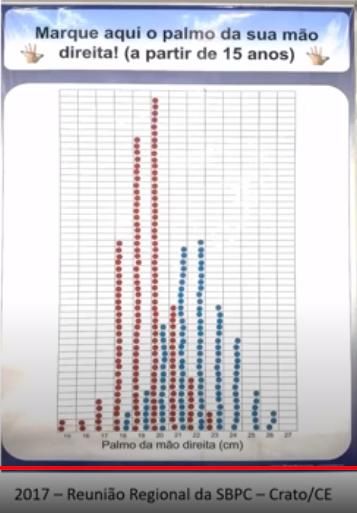
in this stage of basic education, more emphasis is placed on the treatment of
qualitative variables, according to the BNCC (MEC, 2018).
        However, the use of manipulable concrete material in the final years of
elementary school and high school is a little more restricted, which, in our view,
owes to the fact that in this level of education, we must work with the
quantitative variables, which requires greater investment in the design of these
materials to make them accessible to teachers. Studies by Nascimento (2007),
Silva, Magina, and Silva (2010), Silva (2019), Cazorla and Santana (2020), and
Santana (2020) show that those materials bring benefits in the apprehension of
the meaning of the quantitative variables, allowing the representation and
transformation of statistical data between different registers.
        Thus, this article aims to reflect theoretically on the role of the
manipulable concrete material and the students’ actions in the representation of
quantitative statistical variables in different registers. To this end, we find a
basis in the theory of registers of semiotic representation (TRSR) and the
anthropological theory of the didactic (ATD).
        With this article, we extended the theoretical framework about the use
of ostensive objects in the teaching of qualitative statistical variables (Cazorla,
Henriques, & Santana, 2020) for quantitative variables. However, this study is
limited to statistical concepts; therefore, we will not deal with probabilistic
concepts.

        THEORETICAL BACKGROUND
         In this section, we present the two theoretical frameworks, namely: the
anthropological theory of the didactic (ATD), proposed by Chevallard (1992),
restricting us to ostensive and non-ostensive objects that allow us to analyse the
role of the students’ actions regarding the use of concrete manipulable materials,
and the theory of the registers of semiotic representation (TRSR), developed by
Duval (1999), in which we focused on the conversion of the raw data of
quantitative variables into corresponding representations from the numerical
register into the graphic register.

       The anthropological theory of the didactic: the role of the
ostensive objects
       Similar to what Cazorla, Henriques, and Santana (2020, p. 1249)
proposed, given the use of ostensives in the representation of qualitative

                      Acta Sci. (Canoas), 23(4), 16-51, Jul./Aug. 2021          49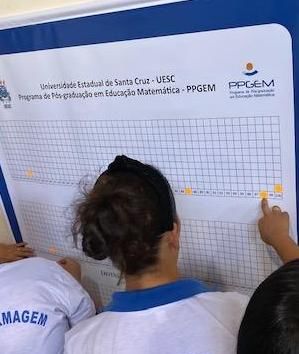
variables, we based this study on the anthropological theory of the didactic
(ATD) regarding the concepts of ostensives and non-ostensives, which allow us
to explore “the potential of manipulable concrete materials as ostensives
suitable to the representation of theoretical statistical data based on the mental
mobilisation of the inherent non-ostensive objects, as well as the observation
and analysis of the students’ quantitative actions,” aiming to expand that
theoretical framework for the representation of the quantitative variables.
         According to Henriques (2019, p. 65), the ostensives are all objects that
have a sensitive nature and certain materiality in a perceptible reality; the non-
ostensives are objects that, like ideas, intentions, or concepts, exist
institutionally “without being seen, said, understood, perceived, or shown by
themselves: they can only be evoked or summoned up from the proper
manipulation of ostensive objects associated.” For example, writing f(x) = 2x
can be understood as a simple manipulation of ostensive, objects, but this
representation could not be made intentionally without the intervention of
specific non-ostensive objects, such as the exponential function concept.
Chevallard (1999) uses the term manipulation to designate the various possible
uses of ostensive objects by man. In fact, several concrete materials can be part
of this manipulation in the students’ actions.
        To Henriques (2019, p. 33), the manipulable concrete material or
manipulable didactic resource is “every ergonomic and cognitive, hand-free
tangible instrument, capable of enabling knowledge management, and is
therefore useful in the teaching-learning process of objects of institutional
knowledge.”
        We, therefore, believe that access to or management of knowledge
through the mediation of those materials is an essential condition in learning
since the students’ manipulation of appropriate materials can enhance their
action in the face of the activities proposed in various ways, particularly in
visualisation, design, and transformation of raw data into statistics.
        Thus, counting on this theoretical reference, we analysed the role of the
concrete material free-hand manipulable and the students’ action in the
representation and conversion of the statistical data, because we understand that
this process pervades the mobilisation of ostensive and non-ostentative objects
in each register of representation considered.

50                    Acta Sci. (Canoas), 23(4), 16-51, Jul./Aug. 2021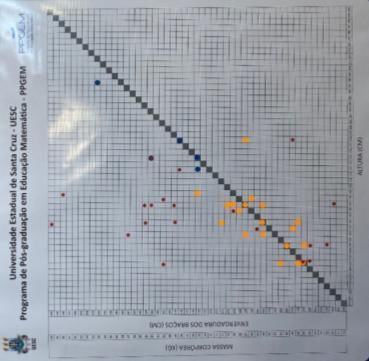
The Theory of Registers of Semiotic Representation: the
        Role of the Conversion of Registers
         This theory was proposed by Raymond Duval, for whom a
representation register is a semiotic system endowed with signs that allow the
identification of a representation of an object of knowledge. Three cognitive
activities are involved in this process. The first activity refers to the
construction of the representation of the mathematical object by means of traits
that allow identifying the object represented within a system of its own, with
clear rules (Duval, 2009).
        Such rules, called compliance rules, must be respected when building
a representation, not only so that the object represented can be identifiable but
also because they allow the occurrence of the second cognitive activity, the
treatment of the representation, within the semiotic system used. Thus, a new
representation is obtained, showing new characteristics for the same object that
was first represented and maintaining the same original register system (Duval,
2009).
         The third cognitive activity consists of representing this same object in
another register or semiotic system by means of conversion. This activity will
allow us to elucidate other characteristics of the object represented, but in a new
system, emphasising that this conversion process involves cognitive processes
distinct from those used to treat a representation. In the treatment, the system
presents their own internal rules for transformations to occur; however, when
one wishes to start from one semiotic system to another through conversion,
there are no rules defined to perform it, as would occur in the translation of a
language, for example, or in a decoding process, which makes conversions
more complex (Duval, 2009). The author states that:
                 Conversion and treatment are totally independent sources of
                 problems in mathematics learning, and it seems that conversion
                 is a more complex cognitive process than treatment. The
                 problem most students find is so deep that conversion can be
                 considered as the limit of understanding. The conversion of
                 semiotic representation usually appears as a trick that cannot
                 be well learned and is not taught! (Duval, 2006, p. 149)
        As in mathematics, those activities are extremely important in the
teaching and learning process of statistics and are at the heart of the process of
understanding the objects under study, such as the statistical variables,
especially the quantitative ones. Therefore, we argue that those three cognitive

                      Acta Sci. (Canoas), 23(4), 16-51, Jul./Aug. 2021          51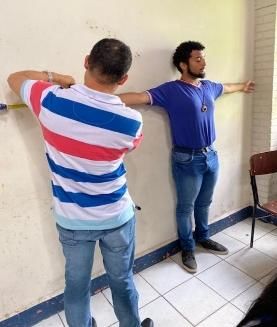
processes should be mobilised in statistical education. We also stress that in the
absence of mobilisation of those processes, the students’ learning about the
object can be compromised. For this very reason, Duval says:
                 Learning mathematics is learning to discriminate and to
                 coordinate semiotic systems of representation in order to
                 become able of any transforming of representation. That can
                 summed up in one sentence. Mathematics learning does not
                 consist first in a construction of concepts by students but in the
                 construction of the cognitive architecture of the epistemic
                 subject. What is at stake in mathematics education through
                 particular content acquisition is the construction of this
                 architecture, because it creates future abilities of students for
                 further learning and for more comprehensive understanding.
                 (Duval, 2000, p. 14)

        According to Duval (2012), the process of understanding mathematical
objects always involves the mobilisation of at least two different types of
semiotic registers, although only one register is chosen to represent this object
in a given situation, according to the characteristic that is to be evidenced by
the object represented. In view of this, it is clear that the study of mathematics
will always require coordination between the various possible registers to
represent a single object. In this way, “The coordination of the registers is not
a consequence of the understanding of mathematics; on the contrary, it is an
essential condition for it” (Duval, 1999, p. 11, our translation).
         Although we have included the core principles of the TRSR, our focus
is on the role of the ostensives and the hand-free manipulable concrete material
in the representation or formation of the quantitative variable, in the numerical
register and its corresponding conversion into the graphic register. Based on
these two references, we present the results obtained in our research and its
discussions below.

        RESULTS AND ANALYSES
         According to Cazorla and Oliveira (2010), a quantitative statistical
variable is the one whose results provide quantities. They can be classified as
discrete variables, if likely to be counted, generating whole numbers, or as
continuous numbers, when they are the result of a measurement, generating any
real value in a range. The statistical variables can also be classified as empirical,

52                     Acta Sci. (Canoas), 23(4), 16-51, Jul./Aug. 2021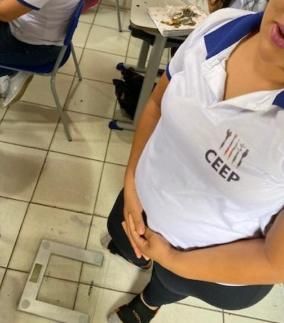
which are those that have a reference in the sensitive world, and conceptual,
which “cannot be observed directly, but inferred by the behaviour of the
subjects involved in the research” (ibidem, p. 121), which requires the creation
of instruments for their operationalisation.
         In this article, we work only with quantitative empirical variables since
those can be counted (discrete) or measured by measuring instruments
(continuous), making it possible to use concrete manipulable materials, which
becomes complex in the case of conceptual variables. We will also explain
better the operationalisation of the variables because, according to Pfannkuch
and Rubick (2002), it is essential to define measures that “capture” qualities or
characteristics of the elements that make up the population; also, there are
several ways to apprehend the same variable (Cazorla, Utsumi, & Monteiro,
2021a).
         As we want to analyse the role of students’ actions in the face of the
use of concrete manipulable materials and the conversion of representations of
statistical data into different registers, we address the situations in which the
students collect the data, since this step has already been performed with data
collected from secondary sources.
         According to Cazorla and Oliveira (2010), in the variables collected by
the students, we have three sources that generate statistical data: observation,
experimentation, and simulation. In an observation, the data would be collected
directly from the source, without any interference in the phenomenon, as in the
problem of the eutrophication of a lake by the aquatic plant water hyacinth
(Correia & Cazorla, 2020). The observation step would consist of visualising
the natural phenomenon as it occurs, without any intervention, only data
collection. In an experiment, this situation would be replicated under controlled
conditions, and the doubling of the plant biomass would be observed in a water
tank, for example. As the authors propose, the simulation can be developed with
bottle caps (as if they were the water hyacinths) in a paper drawing simulating
the lake, as we will see later.
         In a school situation, the data to be observed can be from the students’
themselves, such as age and anthropometric measurements (height, body mass,
etc.), as done by Santana (2020); or through the students’ action, for example,
by checking the number of people inside cars passing by (Watson, 1996), or the
number of vehicles per colour (Alsina, 2017), among other things.
        The data collected in the experiment could be shared with science,
biology, and physical education, such as checking the amount of canary seed

                      Acta Sci. (Canoas), 23(4), 16-51, Jul./Aug. 2021         53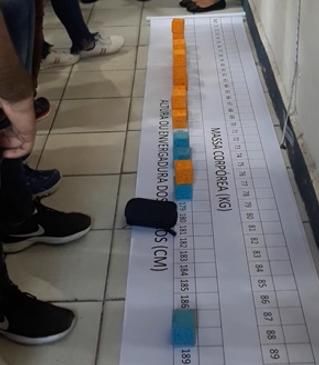
that germinated (Vendramini & Magina, 2010) or the growth of sunflowers
(Santos, 2018). Similarly, we could generate data by simulating the
phenomenon, such as the eutrophication of the lake (Correia & Cazorla, 2020).
         We observe that many genuinely continuous variables, as a rule, are
discretised in a school situation, i.e., they are represented by whole numbers,
such as student height (H) in centimetres without millimetres, or in decimal
numbers limited to a fixed number of decimals (in metres, with two decimal
places); body mass in kilogrammes without grammes, or age in complete years,
allowing the use of manipulable concrete material. However, in some cases,
this strategy does not work, as in the case of body mass index – BMI (BM/H2),
because to work with BMI ranges, one of the limits is 18.5, as reported by
Santana (2020).
         Another issue that must be taken into account is the “degree of
ostensibility.” In the case of empirical variables, some can be seen by the naked
eye, such as the height of students, and others need some material to assist in
the representation, such as the number of letters of the first name, where we
would need posters/paper cutouts/statistical cube to note down the value.
Conceptual variables are not noticeable to the naked eye and need concrete
material, such as posters with scores given by judges in olympic competitions
or instruments such as Likert scales.
        Before analysing the prototypes of the use of the ostensives and the
students’ action in the collection, representation of the data and their possible
transformations, we should score the concepts and procedures involved in the
analysis of quantitative variables in a univariate and bivariate way.
         According to the BNCC (MEC, 2018), the statistics knowledge objects
that must be taught throughout basic education are: sample and census survey;
qualitative and quantitative variables, population, and sample; statistical tables
and frequency distribution tables (FDT), single and double-input; bar/column,
line, and pie charts, pictogram, stem and leaf diagram, box-plot, and histogram;
summary measures: absolute and relative frequency; measures of central
tendency – MCT (mean, median, and mode); dispersion measures – DM (range
and standard deviation). However, as Cazorla, Utsumi, and Monteiro observed
(2021a), the quartiles and interquartile range were not listed, but they are
implicit in the construction of the box-plot. Likewise, we advocate the teaching
of the dot-plot and the rod graphs, which were not covered.
        Cazorla, Utsumi, and Monteiro (2021b) present a scheme of the
possible transformations of the raw data in charts, tables, and summary

54                    Acta Sci. (Canoas), 23(4), 16-51, Jul./Aug. 2021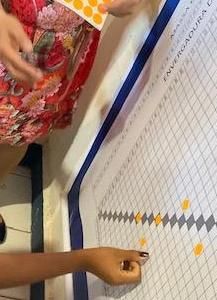
measures for quantitative variables, which we adapted, as shown in Figure 1.
From this, we analysed the potential of the use of the ostensives. We observe
that in the bivariate context, this use becomes complex, requiring some
attention, as we will see later.

Figure 1
Transformations of data of quantitative variables in the univariate context

         With this theoretical framework, we present three prototypes of the
representation and transformation of raw data of quantitative variables, using
concrete manipulable material and the action of students, namely: (a) in the
univariate analysis of discrete variables that take few values; (b) in the
univariate analysis of continuous or discrete variables that take many values;
and (c) in the bivariate context in the analysis of two quantitative variables.
        We also focus on two processes in the use of ostensives. The first
concerns the representation or formation of quantitative variables, and the
second concerns the conversion of data representations between registers, as
we will see in the three prototypes announced.

                     Acta Sci. (Canoas), 23(4), 16-51, Jul./Aug. 2021         55
(A) the use of ostensives in the univariate analysis of discrete
variables that take few values
In this prototype, we include discrete variables that take few values
generated from the students’ actions, that can be observed by the naked eye,
such as the “shoe size,” or that students can use ostensives (posters) for
viewing, such as the “number of letters of the first name.”
For the formation or construction of an idea in a register, we mobilised
some signs and compliance rules. In this sense, we referred to the various
representations (real, iconic, verbal, numerical, and graphic) for a qualitative
variable proposed by Cazorla, Henriques, and Santana (2020) and expanded
into the quantitative variables. We included algebraic representation because
we use the concept of ordered pairs and variables to form a mathematical
function in the final years of elementary school and high school.
In Figure 2, we present a proposal considering as an example a discrete
variable that assumes few values, referring to the students’ “shoe size.” The first
representation, which we call “real,” occurs when the student shows his shoes.
The second, called “iconic” or “pictorial,” appears when we use figures or
ostensives to represent the size of the footwear. In this case, we may ask
students to draw the orthogonal projection of the footwear on paper, as
performed by Fielding-Wells (2018, p. 1). The third is the “verbal”
representation, when we represent the shoe size orally or in written form in the
mother-tongue register, “thirty-one”. The fourth, is the “numeric”
representation, when we write the numeral “31”. The fifth, algebraic, is when
we represent the letter x with a subscript i (xi) to denote the value of the variable
X “shoe size” of the i-th student. Finally, the graph, when we use a circle in the
dot-plot diagram in a proper frame or a “unit” trace/line segment in the rod
graph or a “unit” portion of a bar in the bar chart.
56 Acta Sci. (Canoas), 23(4), 16-51, Jul./Aug. 2021Figure 2
Types of representations of a discrete variable that takes few values
Once the data have been collected, the next step is to organise and
summarise them to briefly describe the variable “shoe size” using the ostensives,
so that students can follow the data transformations in the “statistics” from
direct, hand-free manipulation.
In Figure 3a, we observe the students formed rows according to the
shoe size. Here, the students themselves acted. In Figure 3b, the student
represented the size of his/her shoes on one side of the statistical cube and
stacked them. Finally, in Figure 3c, each student drew the orthogonal projection
of his/her right foot footwear (it could be the left footwear, the important thing
is to be always just one of them) on a paper or cardboard, cut, and glued it on
the wall. In these three situations, we observed that the students acted actively,
either by forming ordered rows representing their data in the statistical cube or
by stacking or drawing and sticking the drawings of their shoes to the wall.
Acta Sci. (Canoas), 23(4), 16-51, Jul./Aug. 2021 57Figure 3
Representation and organisation of a discrete variable using ostensives
(a) forming rows according to shoe size (b) stacking statistical cubes with student data
Source: Silva, Cazorla, and Kataoka (2011, p. Shoe size
41)
(c) using cutouts of paper/cardboard/EVA with the outline of the student’s footwear
Shoe size
Caption: red – girls, blue – boys.
In all these cases, students recognise their data and can visualise the
distribution of the variable under study. In other words, there is a two-way
relationship between the student and his/her data, which can be emphasised by
placing the student’s name on one side of the cube or the drawing of his/her
footwear, and different colours can be used to distinguish a qualitative variable.
For example, red for girls and blue for boys; or one colour for each age, which
will allow students to visualise possible characteristics of the variable.
We can also use other materials, not as ostensives, as those in Figure 3,
but that the students can still manipulate. In Figure 4a, we show a “bar graph,”
widely used in basic education, with standardised paper cutouts stuck to the
squared paper and glued to/drawn on the blackboard; circular stickers to the
frame of the dot-plot diagram (Figure 4b) or matches/straws to the rod graph
frame drawn in the cardboard (Figure 4c). As we can see, students can still
recognise and track their data.
58 Acta Sci. (Canoas), 23(4), 16-51, Jul./Aug. 2021Figure 4
Organisation and representation of the variable “shoe size” using ostensives
(a) sticking standardised paper cutouts to the (b) pasting circular stickers onto the dot-plot frame
blackboard 4
3
2
1
0
34 35 36 37 38 39 40 41 42 43
Shoe size number
(c) sticking matches to the cardboard in the stem diagram frame (Magina, Lautert, & Cazorla, 2021, in
press)
We used Figure 4c to represent the mean shoe size numbers of girls,
boys, and in general by using triangles at the base of the numerical scale
(abscissa). In this figure, we can observe that girls’ feet are smaller than the
boys’, and the distribution of this variable presents a bimodal behaviour
influenced by gender.
Figure 5a presents the dot-box-plot, coloured by gender; the general
dot-box-plot (Figure 5b); and the box-plot for each gender and global (Figure
5c), the three built with the software GeoGebra. We also present the diagram of
stem and leaves by gender and general (Figure 5d). In these charts, we are
mobilising the non-ostensive elements, referring to the Cartesian plane, the dots,
the straight line segments that make up the box-plot, besides having calculated
the median, the quartiles, and examined the presence of discrepant values.
Acta Sci. (Canoas), 23(4), 16-51, Jul./Aug. 2021 59Figure 5
Organisation and representation of the variable “shoe size” using non-
ostensives
(A) Dot-box-plot of the shoe size number per (b) Dot-box-plot of the shoe size number
gender
(c) Box-plot of the shoe size number per gender (d) Stem and leaves diagram
Opposite (bivariate) per gender Univariate
Feminine Stem Masculine Stem Leaves
444 3 3 444
3 3
66 3 3 66
7777 3 3 7777
888 3 3 888
3 99 3 99
4 0 4 0
4 1111 4 1111
4 222 4 222
4 3 4 3
Stem: tens
Leaf: units
As we have already mentioned, the dot-plot was not listed in the BNCC.
However, we can observe its contribution to constructing and understanding the
box-plot because the students can still “see” the dot that can represent their data
and track their data in the stem and leaf diagram. The box-plot detaches from
the data and becomes an abstract object so that the students no longer recognise
theirs. We, therefore, believe that the dot-plot must be taught before the box-
plot.
When variables are not noticeable to the naked eye, such as the number
of letters that make up the first name, we need to use concrete material, such as
standardised paper cutouts, posters or statistical cubes, in which the student
represents their data (Figure 6a). This strategy can also be used for continuous
variables. The treatment of this variable can follow all the steps described above,
and the students will form rows according to the number of letters in their name,
60 Acta Sci. (Canoas), 23(4), 16-51, Jul./Aug. 2021stacking the cubes. They can also stick their paper cutouts or write their names
in full on the board (Figure 6b).
Figure 6
Ostensives to represent the variable “number of letters of the first name”
(a) using ostensives to represent the (b) sticking standardised paper cutouts to the blackboard
datum
paper cutout poster statistical cube
Number of letters of the first name
Source: Images from freepick.com Caption: orange – girls, green – boys
As part of the experiment, Vendramini and Magina (2010) presented
the “seed germination” task, in which the students planted ten seeds of birdseed
in small disposable coffee cups, guessed and registered the number of seeds
that would germinate (conceptual variable) and, after some time, counted the
seeds that sprouted (empirical variable). Santos (2018) conducted a similar
experiment with pre-school children using sunflower seeds.
This prototype of analysis and use of the ostensives applies to any
discrete variable that takes few values that results from the observation, such
as the number of siblings or letters that form the first name, or values produced
by them in an experiment, such as the quantity of seeds that germinated, or via
simulation, by flipping coins, instead of planting seeds.
(b) The use of ostensives in the univariate analysis of
continuous or discrete variables that take many values
Just as we use the ostensives to represent and organise the discrete
variables that take few values, we can use the same strategies for the
representation and organisation of discrete variables that take many values,
such as the number of passengers travelling a day on an urban bus or continuous
variables, such as the height of a plant or a student.
We observed that there are strategies that allow us to collect data from
continuous variables on a continuous scale, such as that performed by Santos
Acta Sci. (Canoas), 23(4), 16-51, Jul./Aug. 2021 61(2018), in which children track the growth of sunflowers using 10 and 20 cm-
long straws, making marks to observe how much the plant grew (Figure 7a) or
in the constant suggestion in the Pacto Nacional pela Alfabetização na Idade
Certa [National pact for literacy in the right age] (MEC, 2014), for students to
measure the height of their colleagues with a string, cutting and sticking it to
the blackboard (Figure 7b).
Figure 7
Use of ostensives to measure height (continuous variable, continuous scale)
(a) Height of sunflowers (Santos, 2018, pp. 51-52) (b) Students' height (MEC, 2014, p. 63)
To illustrate how we can represent the continuous variables, we
consider as an example the “students’ height,” in which we have the student
himself (real) and we can cut paper/twine strips with a mark representing the
student’s height and stick them to the wall, represent them orally or in writing
fully, and so on, as shown in Figure 8.
62 Acta Sci. (Canoas), 23(4), 16-51, Jul./Aug. 2021Figure 8
Types of representations of a continuous variable (discretised)
Students’ height
Iconic,
Real Verbal Numeric Algebraic Graphic
pictorial
The student Paper or Name of Use of the Notation A circle in the dot-
standing twine strip the digit plot diagram
of the number xi
student’s
size one metre
and sixty 1,60 (m)
centimetres
or or
one 160 (cm)
(Source: hundred
freepick.com) and sixty
cm
Silva, Magina, and Silva (2010) worked with anthropometric variables
with 25 students from the 9th grade. To work on the variable “students’ height”,
the authors mobilised students to experience data representation using their
own bodies, asking them to form a row in ascending order (lower to higher)
(Figure 9a). Students at the same height were asked to stand behind each other
(“stacked”), forming rows perpendicular to the main one, forming a human
“dot-plot”. In this figure, we see the researcher asking the student that occupied
the 13th position to take a step forward to imply that her height represented the
median height.
In Figure 9b, researchers used a giant tape measure (as an ostensive) to
show students that being side by side does not mean that the distance is the
same, therefore the representation in the numerical line is important. In Figure
9c, we observed the representation of the human dot-plot data in the numerical
register. It plays an important role in finding the position measures, the median
(Md), the first quartile (Q1) and the third quartile (Q3). However, the
corresponding conversion in the graphic register is necessary, aiming at the real
quantification of the variable “height”, as shown in Figure 9d.
Acta Sci. (Canoas), 23(4), 16-51, Jul./Aug. 2021 63Figure 9
The role of the students’ action in the representation and of ostensives of the
variable height
(a) The representation of the median (b) the use of the giant tape measure
(c) the numerical register and the determination of the median and quartiles
Gender F M F M F F F F F F F F F F M M M M M M M M M M M
157
161
162
162
163
163
165
166
166
166
169
170
173
173
173
173
174
176
178
178
179
179
180
180
184
Height
21s
3rd
23r
4th
5th
6th
7th
8th
9th
10t
12t
13t
14t
15t
16t
17t
18t
19t
20t
24t
25t
Position
11t
1st
2n
22
nd
d
h
h
h
h
h
h
h
h
h
h
h
d
h
h
t
Statistics Q1 = 164 Md Q3 = 178
(d) the graphic register and the determination of the median and quartiles
5
0
155 160 165 170 175 180 185
Q1=164 Md=173 Q3=178
Height (cm)
Regarding the use of concrete material, Silva, Kataoka, and Cazorla
(2014) worked with 24 mathematics teachers of high school, who built the dot-
box-plot (Figure 10) using the Styrofoam base, coloured pins/thumbtacks to
represent the dots and the crepe tape outline the box-plot.
64 Acta Sci. (Canoas), 23(4), 16-51, Jul./Aug. 2021Figure 10
Dot-box-plot built with concrete material (Silva, Kataoka, & Cazorla, 2014,
p. 4)
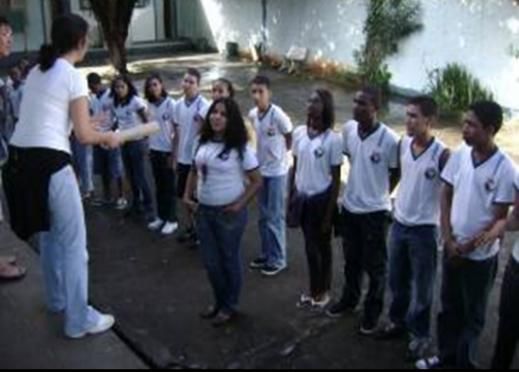
Santana (2020) advanced with the use of ostensives and students’
actions in the management of quantitative variables, in the study of the role of
the statistical variables in the contextualisation of the affine function. The
author used the statistical cube (Cazorla & Santana, 2020) as an ostensive to
represent seven variables, namely: gender (qualitative with two categories),
using the colour of the cube, being orange for girls and blue for boys, and on
the faces of the cube, the age, height, and arm span and the body mass
(continuous discretised). BMI (with one decimal) and BMI ranges (ordinal
qualitative). The author used a tape measure, a digital scale, and a statistical
cube in the process of representation, formation, and representation of the
variables (Figure 11).
For the students to see the distribution of the variables, the author built
four banners, two for univariate analysis and the other two for bivariate analysis.
The first banner was three meters long and half a meter wide (Figure 12), with
a squared sheet to represent the height/arm span (150 to 200 cm) and body mass
(50 to 100 kg). Each square measured 5.5 cm on the side to accommodate the
statistical cube, formed by squares of 5 cm on the side.
Acta Sci. (Canoas), 23(4), 16-51, Jul./Aug. 2021 65Figure 11
The role of the students’ action in the representation and the ostensives in the
representation of variables (Santana, 2020, Figure 55, p. 111)
(a) measuring height (b) by measuring the (c) measuring body (d) writing the data in
breadth of the arms mass (weight) the statistical cube
To analyse the data distribution, Santana (2020) asked each student to
put their cubes in the banner (Figure 12a). After all the students placed their
cubes in the banner, the author asked them to describe the data distribution
(Figure 12b). To indicate where the mean was likely to be found, the students
used a black pencil case (Figure 12c).
Figure 12
The role of the students’ action in the management of the height variable
using the statistical cube (Santana, 2020, Figure 56, p. 113)
(c) students analysing (c) students analysing
(a) Student placing the
the likely location of the likely location of
cube in the banner
the mean the mean
66 Acta Sci. (Canoas), 23(4), 16-51, Jul./Aug. 2021In this case, the statistical cube acts as an ostensive that still maintains
a biounivocal relationship with the students’ data because each student
recognises its cube. Therefore, the representation still adheres to the students’
data.
The second banner was built to accommodate the 2 cm diameter
circular stickers (Figure 13). Thus, each square had 2.1 x 2.1 cm2. Next, the
researcher delivered circular stickers (orange for women and blue for men) and
asked them to stick on the places related to the measures in the cube (Figure
13a), building the dot-plot of height, arm span, and body mass, coloured by
gender (Figure 13b).
Figure 13
The role of the ostensives in the management of representation and conversion
of statistical data of the numerical register into graphic register using circular
coloured stickers (Santana, 2020, Figure 57, p. 113)
(a) student’s action (b) dot-plots constructed by students with ostensives
Since the banner was large and glued to the wall, once the students
finished pasting their stickers, the author asked them to look at the data
distribution by asking them guiding questions: Who are the highest ones? The
shortest? Where should the mean be? Comparing the height and arm span
distribution, which of the two varies the most? When comparing the body
Acta Sci. (Canoas), 23(4), 16-51, Jul./Aug. 2021 67height and body mass distribution, which of the two varies the most? The
students registered their guesses of the mean values in their notebooks, which
were then compared with the mean calculated using the data. The author
observed how close the guesses of the mean values were. This strategy of
collective analysis was very promising because one student’s reasoning
complemented the reasoning of the other, forming a collective knowledge.
(c) the use of ostensives in the bivariate analysis of
quantitative variables
For the bivariate analysis, the author built a third banner simulating the
Cartesian plane (Figure 14b), with 1.5m in the side, the height was in the
abscissa, the measurements ranging from 150 to 200 cm, in units. In the
ordinate, there were two scales, one for the arm span, taking the same height
values, and a second scale for the body mass, whose measurements ranged from
50 to 100 kilograms. The difference for the traditional Cartesian plane is that
the lines of the mesh intersect in the whole numbers. In this construction, the
numbers are found between the squared lines to include the circular sticker in
this squared sheet. This adaptation was a didactic strategy to represent the
continuous variables, which had to be discretised for the concrete material to
be used. In this graph, the measurements of short and thin people are located in
the lower-left corner, those of thin and tall people in the lower-right corner, the
short and obese people in the upper-left corner, and those of tall and obese
people in the upper-right corner.
The fourth banner (Figure 14c) is a dispersion diagram suitable to track
the BMI. It had body mass in the abscissa, ranging from 46 to 110 kg, and the
height in the ordinate, ranging from 1.46 to 2.10 meters (both discretised,
varying in one unit). The reading starts at the dot (1.46 m; 46 kg) in the upper-
left corner, the reading for the abscissa from left to right, and the reading of the
ordinate from top to bottom. At the intersection of each measurement is the
BMI calculated value, which is coloured according to the BMI ranges. In this
graph, the measurements of people within the normal range are situated
diagonally, slightly to the left (green band), the measurements of people with
low weight problems are at the bottom of the diagonal (blue band) and the
measurements of people with signs of obesity are above the diagonal (yellow,
orange, dark green and red bands).
68 Acta Sci. (Canoas), 23(4), 16-51, Jul./Aug. 2021Figure 14
The role of the ostensives in the management of representation and the
conversion of statistical data of the numerical register into graphic register
using circular coloured stickers (Santana, 2020, Figure 57, p. 113)
(a) student’s
(b) “traditional” dispersion diagram (c) BMI dispersion diagram
action
Caption: Figure 14a and 14b: Orange circle (feminine), blue (masculine) for the ordered pair (H, BM) and
red circle for the ordered pair (H, BM) in both banners (Figure 14b and Figure 14c.
Figure 14c: blue “Underweight” (less than 18.5); light green - “Normal weight” (between 18.5
and 24.9); yellow - “Overweight” (between 25 and 29.9); orange - “Class 1 Obesity” (between
30 and 34.9); dark green - “Class 2 Obesity” (entre 35 and 39.9) and red - “Class 3 Obesity”
(over 40).
To perform the bivariate analysis, Santana (2020) asked the students to
check their heights (H) and arms spans (AS), represented in the statistical cube,
to identify the ordered pair (H, AS) and to stick the circular sticker in the square
(blue for men and orange for women) From the third banner (Figure 14a),
forming a cloud of dots quite adherent to the line of equality (AS = H) and
asked them to place themselves in relation to Vitruvius’s hypothesis that the
arm span is equal to the height (AS = H).
Next, the author asked the students to look at their heights (H) and body
masses (BM) and stick a red sticker (without distinguishing gender) in the
corresponding location, thus building the dispersion diagram of BM and H
(Figure 14b), whose dot cloud was randomly dispersed, no pattern.
Acta Sci. (Canoas), 23(4), 16-51, Jul./Aug. 2021 69Finally, the author asked the students to look at their heights and body
masses and glue their stickers on the fourth banner (Figure 14c), when the
students were impacted by the tendency to obesity of most of them.
By way of illustration, we present the example of simulation for
modelling the exponential function performed by Correia and Cazorla (2020) –
in the context of deterministic covariation – inspired by the video by Maurício
Féo1, which explains the exponential growth in the eutrophication process of a
lake by water lilies, by asking the following question: “Until when can I clean
the lake, before I lose control and the water lilies take all the place?” In this
case, the authors proposed that the students simulated the eutrophication
process by the water plant E. crassipes, known as water hyacinth, which, in
ideal conditions, manages to double its biomass in approximately 15 days. For
this, they suggested that they used bottle caps/coins/beans or any concrete
material of an equal shape and size to simulate the water hyacinths and to draw
a lake in cardboard (Figure 15).
Figure 15
The simulation of lake eutrophication by the water hyacinth, exponential
growth (Correia & Cazorla, 2020, Figure 3, p. 12)
This student knows that the process baseline is zero (x=0), with one
water hyacinth, and, at each period, it doubles its biomass in a process similar
to meiosis (cellular division). The authors suggest that the linear growth with a
rate equal to two be worked in parallel and that a table and a squared sheet are
at hand to have them build the graphs in the paper/pencil environment.
In this process, the student has the bottle caps as ostensives to represent
the number of water hyacinths in the lake at each period. The student’s action
by adding caps each time may enhance his understanding of the covariation
present in the simulation because, strategically, the student may count the total
number of caps he must have on the lake for each period or identify that given
1
https://g1.globo.com/bemestar/coronavirus/noticia/2020/04/10/enigma-da-vitoria-
regia-vira-exemplo-em-video-que-explica-o-que-e-o-crescimento-exponencial-da-
pandemia.ghtml
70 Acta Sci. (Canoas), 23(4), 16-51, Jul./Aug. 2021the quantity existing in the period Xn, he must add only one quantity Xn+1 – Xn
to complete the quantity required in Xn+1. In other words, by working with this
reasoning, completing the amount that is lacking, the student may, through his
action, develop the notion of covariation, identifying that in the linear situation,
the increment is equal in all periods. Still, in the exponential situation, it
increases more in each period.
For the statistical covariation, the authors propose the follow-up of the
accumulated cases of infected individuals and deaths by Covid-19, which at the
moment of expansion can be modelled by the exponential function. However,
those are secondary data, so that students do not have direct action unless by
searching for official sources. In addition, we will hardly be able to use
ostensives to represent them, not least because the order of magnitude exceeds
thousands, and it is necessary to use free electronic spreadsheets or
mathematical/statistical software, such as GeoGebra, for example, but that we
will not address in this work.
As a suggestion of additional reading, Cazorla, Samá, Velasque, Diniz,
and Nascimento (2021) bring several possibilities of work with the statistical
concepts inherent to the data generated in the Covid-19 pandemic context. They
introduce two applets to simulate exponential growth and contagion rates,
sensitising students about the importance of adherence to prevention measures,
such as mask use, avoiding closed sites and human agglomeration, and how it
impacts the graph paths - which sometimes drastically change.
There are other studies in which researchers have used the ostensives
in an encouraging way, such as, “Let us measure the palm of our hand?”, carried
out by the “Statistics Tent”, led by the professors. Lisbeth Cordani and Doris
Fontes, from the Brazilian Statistical Association, who have travelled the
country in the meetings of the Brazilian Society for the Progress of Science –
SBPC, popularising the teaching of statistics, as we can see in the video on
YouTube (https://www.youtube.com/watch?v=cqIQAXFO8Aw).
During the visit to the Statistics Tent at SBPC meetings, professors
Lisbeth and Doris encouraged visitors to measure their right-hand palm and
glue a sticker (red for girls and blue for boys) on one of the banners, one for
children and adolescents (up to 14 years old) and the other for adults (15 years
or more), as shown in Figure 16.
Acta Sci. (Canoas), 23(4), 16-51, Jul./Aug. 2021 71Figure 16
The use of ostensives in the popularisation of statistics (Statistics Tent)
In the above-mentioned video, professor Cordani contextualises and
analyses the possibilities for understanding the fundamental ideas of statistics,
such as the difference by gender, by age group, the more symmetrical and
concentrated distribution of the older and more widespread of the younger ones,
which is explained by the presence of children and adolescents in full growth,
among other aspects. We encourage readers to watch the video and participate
in the online experience.
CONCLUSIONS
The fundamental ideas of statistics present a paradox. They are intuitive
and complex because although they do not have mathematical complexity in
their concepts, they are not easy to interpret. The most emblematic case is that
of the mean, since most students know how to calculate it but cannot attribute
meaning, as Santana’s work (2020) shows, when the students were asked to
give their guesses about the average height value by examining the distribution
of the cubes in the banner. However, based on a key question-driven analysis,
students understand the real meaning of the mean, so much so that their guesses
were very close to the value calculated with the data.
72 Acta Sci. (Canoas), 23(4), 16-51, Jul./Aug. 2021Also, one of the key points is the definition and operationalisation of
variables, the generation of data, and how they are transformed into statistics –
tables, graphs and summary measures. In this sense, the use of the ostensives
and the students’ actions in managing statistical concepts are fundamental
aspects of learning.
When students participate in the whole process, from collecting the
data to tracking how data turn into statistics, they can understand and give
meaning to the measures, as Cardoso, Nagamine, and Cruz (2010, p. 8) report
about one student’s speech, whose height was the median value in the human
dot-plot. She was so amazed that when she saw the median in the box-plot
diagram, she said: “That little dot in the median is me.” Or Santana’s (2020, p.
116) students, who exclaimed: “We must watch out about our food!” and “about
physical activities.” Those statements reveal that involving the student in the
whole learning process seems to be a promising didactic strategy.
Throughout this article, we have seen numerous possibilities for using
the ostensives. We hope that, with this, teachers feel encouraged to use free-
hand concrete manipulable materials that actively involve students in the whole
process of data collection and transformation.
However, as can be seen in the construction of the banners, it is
necessary to be flexible and pay attention to the modifications that we must
make so that the ostensives can fulfil their role, assisting the student to capture
data and transform them into different representation registers.
With this article, we hope to have built a theoretical reflection on the
role of the free-hand concrete manipulable material and the student’s action in
producing statistical knowledge, empowering them to read the world.
AUTHORS’ CONTRIBUTIONS STATEMENTS
I. M. C. is responsible for the conception of the work, A. H. for the
theoretical framework of the TRSR and the ATD, C. V. S. provided the data of
his master’s dissertation regarding the contribution of the statistical variables
in the contextualisation of the affine function and G. S. C. is developing his
dissertation with the modelling of the exponential function and the context of
deterministic and statistical covariation.
Acta Sci. (Canoas), 23(4), 16-51, Jul./Aug. 2021 73DATA AVAILABILITY STATEMENT
The data supporting the results of this study will be made available by
the first author of this article, I. M. C., upon reasonable request.
REFERENCES
Alsina, A. (2017). Contextos y propuestas para la enseñanza de la estadística y
la probabilidad en Educación Infantil: un itinerario didáctico. Épsilon,
34(95), 25-48.
Alsina, A., Vásquez, C., Muñiz-Rodríguez, L. & Rodríguez-Muñiz, L. J.
(2020). ¿Cómo promover la alfabetización estadística y probabilística
en contexto? Estrategias y recursos a partir de la Covid-19 para
Educación Primaria. Épsilon, 104, 99-128.
Caetano, S. (2004). Introduzindo a estatística nas séries iniciais do Ensino
Fundamental a partir de material manipulativo: uma intervenção de
ensino (229 f.). Dissertação de mestrado, Educação Matemática,
Pontifícia Universidade Católica de São Paulo, São Paulo.
Cardoso, N., Nagamine, C. & Cruz, L. (2010). Uma sequência didática para o
ensino de estatística: o homem vitruviano. In Anais do X Encontro
Nacional de Educação Matemática.
https://atelierdigitas.net/CDS/ENEM10/artigos/MC/T11_MC401.pdf.
Cazorla, I. & Oliveira, M. (2010). Para saber mais. In I. Cazorla e E. Santana
(Orgs.). Do tratamento da Informação ao Letramento Estatístico (pp.
113-144). Via Litterarum.
Cazorla, I., Henriques, A. & Santana, C. (2020). O papel dos Ostensivos na
representação de variáveis estatísticas qualitativas. Bolema, 34(68),
1243-1263. hppt://dx.doi.org/10.1590/1980-4415v34n68a19.
Cazorla, I., Santana, C. (2020). O cubo estatístico: material para trabalhar
variáveis estatísticas. 2020. In. Anais X Congreso Internacional sobre
enseñanza de las Matemáticas.
http://congreso.pucp.edu.pe/xciem/wp-
content/uploads/sites/59/2019/02/XCIEM_programa_resumenes_14_
02_2020.pdf.
Cazorla, I., Samá, S., Velasque, L., Diniz, L. & Nascimento, L. (2020).
Reflexões sobre o papel da Educação Estatística na formação de
74 Acta Sci. (Canoas), 23(4), 16-51, Jul./Aug. 2021You can also read