The role public transport can play in Safer Journeys and, in particular, to advance the Safe System approach December 2015
←
→
Page content transcription
If your browser does not render page correctly, please read the page content below
The role public transport can play in Safer
Journeys and, in particular, to advance the
Safe System approach
December 2015

B Frith, J Burton, M Trotter, G Rive
Opus Research, Lower Hutt

NZ Transport Agency research report 581
Contracted research organisation – Opus Research
ISBN 978-0-478-44543-5 (electronic)
ISSN 1173-3764 (electronic)

NZ Transport Agency
Private Bag 6995, Wellington 6141, New Zealand
Telephone 64 4 894 5400; facsimile 64 4 894 6100
research@nzta.govt.nz
www.nzta.govt.nz

Frith, B, J Burton, M Trotter, G Rive (2015) The role public transport can play in safer journeys, and, in
particular, to advance the Safe System approach. NZ Transport Agency research report 581. 74pp.

Opus Research was contracted by the NZ Transport Agency in 2014 to carry out this research.

This publication is copyright © NZ Transport Agency 2015. Material in it may be reproduced for personal
or in-house use without formal permission or charge, provided suitable acknowledgement is made to this
publication and the NZ Transport Agency as the source. Requests and enquiries about the reproduction of
material in this publication for any other purpose should be made to the Manager National Programmes,
Investment Team, NZ Transport Agency, at research@nzta.govt.nz.

Keywords: accident, bus, ferry, mode, multimodal, New Zealand, public transport (PT), risk, Safe Systems,
Safer Journeys, safety, train, transport, travel
An important note for the reader
The NZ Transport Agency is a Crown entity established under the Land Transport Management Act 2003.
The objective of the Agency is to undertake its functions in a way that contributes to an efficient, effective
and safe land transport system in the public interest. Each year, the NZ Transport Agency funds innovative
and relevant research that contributes to this objective.

The views expressed in research reports are the outcomes of the independent research, and should not be
regarded as being the opinion or responsibility of the NZ Transport Agency. The material contained in the
reports should not be construed in any way as policy adopted by the NZ Transport Agency or indeed any
agency of the NZ Government. The reports may, however, be used by NZ Government agencies as a
reference in the development of policy.

While research reports are believed to be correct at the time of their preparation, the NZ Transport Agency
and agents involved in their preparation and publication do not accept any liability for use of the research.
People using the research, whether directly or indirectly, should apply and rely on their own skill and
judgement. They should not rely on the contents of the research reports in isolation from other sources of
advice and information. If necessary, they should seek appropriate legal or other expert advice.
Acknowledgements
The authors would like to acknowledge the input of the following people for their valuable contributions to
this work:

•   Steering Group chair Peter Kippenberger

•   Steering Group members: Wayne Jones, Ministry of Transport; Rob Gould, New Zealand Transport Agency;
    Iain McAuley, New Zealand Transport Agency; Viviane McGuire, Ministry of Transport; Carolina Lukkien,
    New Zealand Transport Agency.

•   External peer reviewers: Professor Brian Fildes; Iain McGlinchy

•   The large number of people from New Zealand and around the world who assisted with the provision of
    information.
Contents
Executive summary ............................................................................................................................................................ 7
Abstract ............................................................................................................................................................................... 10
1          Introduction ........................................................................................................................................................... 11
2          Road safety strategy in New Zealand – its development .................................................................... 12
           2.1         Road safety strategy in New Zealand prior to the Safer Journeys strategy ....................... 12
           2.2         The strategy and its framework ...................................................................................... 14
           2.3         The context of the Safer Journeys strategy with respect to PT ........................................ 14
3          Road safety strategy overseas ....................................................................................................................... 16
           3.1         The Netherlands ............................................................................................................ 16
           3.2         Sweden .......................................................................................................................... 17
           3.3         Norway .......................................................................................................................... 17
           3.4         Australia ........................................................................................................................ 18
4          New Zealand’s Safer Journeys and public transport ............................................................................. 19
5          How public transport is regulated ............................................................................................................... 21
           5.1         Passenger ferries ........................................................................................................... 21
           5.2         Passenger rail ................................................................................................................ 21
           5.3         Urban buses .................................................................................................................. 23
6          Intermodal crash and injury rate comparisons ....................................................................................... 24
           6.1         Intermodal comparisons ................................................................................................ 24
           6.2         Non-crash injuries on PT or while exiting/entering PT .................................................... 28
           6.3         Pedestrian and PT accidents ........................................................................................... 33
                       6.3.1          Discussion......................................................................................................... 33
                       6.3.2          Conclusions ...................................................................................................... 36
           6.4         Catastrophic risk ........................................................................................................... 36
7          Traveller safety when travelling to and from public transport ........................................................ 38
           7.1         Walking infrastructure.................................................................................................... 38
           7.2         Lighting for pedestrians ................................................................................................. 38
           7.3         Non-motor vehicle pedestrian and bicyclist crashes ....................................................... 39
           7.4         Safe interchange facilities .............................................................................................. 41
           7.5         Urban planning to influence modal split ......................................................................... 42
8          How public transport can fit into a Safe System framework – lessons from
           overseas .................................................................................................................................................................. 44
           8.1         The European Commission............................................................................................. 44
           8.2         The World Bank.............................................................................................................. 44
           8.3         The World Health Organisation ....................................................................................... 44
           8.4         The European Transport Safety Council .......................................................................... 45
           8.5         The United Nations ........................................................................................................ 45
           8.6         Sweden .......................................................................................................................... 45
           8.7         Norway .......................................................................................................................... 45
           8.8         France ........................................................................................................................... 46
           8.9         United Kingdom ............................................................................................................. 46
           8.10 Australia ........................................................................................................................ 46

                                                                                               5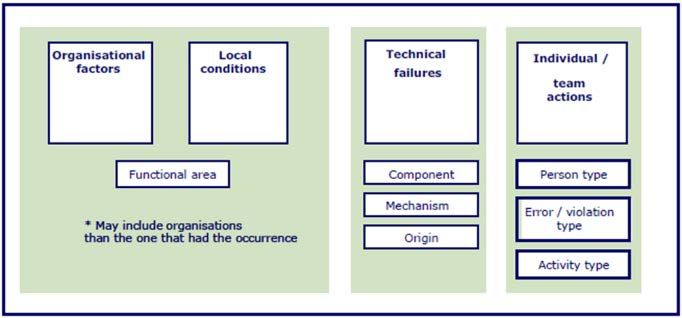
8.10.1 The Federal Government.................................................................................... 46
8.10.2 States and territories of Australia ....................................................................... 47
8.11 Austria .......................................................................................................................... 49
8.12 Finland .......................................................................................................................... 50
8.13 Germany ........................................................................................................................ 50
8.14 Hungary ........................................................................................................................ 50
8.15 Netherlands ................................................................................................................... 50
8.16 Summary ....................................................................................................................... 50
9 Summary of insights gleaned ......................................................................................................................... 52
10 The potential impact of increased PT use on injuries in the main urban areas ........................ 53
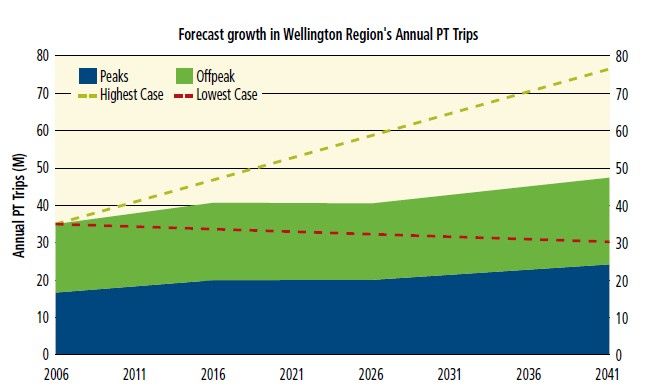
10.1 An example of travel changes associated with doubling PT in two measures of
travel ............................................................................................................................. 54
10.2 MPT injury decreases associated with doubling of bus PT according to two
measures of travel ......................................................................................................... 55
10.3 Increases in bus-related injury associated with doubling bus PT according to two
measures of travel ......................................................................................................... 56
10.3.1 Social costs ....................................................................................................... 57
11 Should modal shift to public transport be viewed as a road safety measure by
road safety strategists? .................................................................................................................................... 59
11.1 Discussion ..................................................................................................................... 59
11.2 Summary ....................................................................................................................... 61
12 Implementation .................................................................................................................................................... 62
13 Conclusions ........................................................................................................................................................... 63
14 Recommendations ............................................................................................................................................... 66
15 References .............................................................................................................................................................. 67
Appendix A: Glossary ..................................................................................................................................................... 74
.
6
Executive summary
The key objectives of this research were to identify the contribution that urban public transport (PT) can make
to the Safe System approach, and to develop an implementation plan for the insertion of PT as a safe mode
into the Safer Journeys framework and action plans.

In order to achieve these goals, the project:

•   completed a comprehensive review of existing international and New Zealand literature and practice,
    identifying best practice examples of Safe System approaches with an emphasis placed on PT systems

•   in the light of knowledge from the review and information from transportation studies, drew conclusions
    regarding the potential contribution of a modal shift to PT with present urban form, and how this
    contribution could be enhanced with the use of urban densification

•   used the insights drawn to devise a method of integrating PT issues fully into the Safe System approach
    to road safety, and to make recommendations as to how this might also be integrated into Safer
    Journeys.

The review is carried out from a Safe System perspective. It is thus assumed that a Safe System approach is
appropriate for all urban transport modes including ferry and rail, whether or not this Safe System approach
is pursued within the umbrella of New Zealand’s Safer Journeys road safety strategy or by some other
mechanism.

PT is generally considered a safe form of transport. For example, in New Zealand, passengers in cars and
vans are seven times more likely than bus passengers to be killed or injured in a crash (for the same time
spent travelling), indicating that bus travel is comparatively a very safe mode of travel for passengers. Note
that this does not include falls inside of buses or injuries sustained entering or exiting buses. Bus drivers are
very seldom killed, with no deaths in 2012, but six drivers were seriously injured and 43 sustained minor
injuries in that year.

The literature and case studies from the Auckland and Wellington main urban areas indicate that PT is indeed
safer than motorised personal transport modes. However, when injuries to PT users accessing PT, exiting
from PT, on PT, and journeying to and from PT, are taken into account, the difference narrows. These injuries
relate to walking and cycling infrastructure, including lighting, PT interchange and bus stop design, PT vehicle
design (and internal infrastructure) and the driving behaviour of PT drivers. Journeys to and from PT vehicles
may use vulnerable modes. It is important for walking and cycling safety to be a high priority to encourage
people to use these modes and access the health benefits they afford. Also, fewer injuries will occur if there is
good urban planning to provide efficient transport and reduce unnecessary journeys.

The review looked at the Safe System approach to road safety (sometimes called Vision Zero or sustainable
safety) as it has been adopted by New Zealand, the governments of other developed countries, and
international organisations with an interest in road safety. It also looks at how its relationship to PT is viewed.

In New Zealand, PT strategies and Safer Journeys are both over-arched by the Government Policy Statement
on Land Transport (GPS). Safer Journeys impacts on PT only through measures to reduce level crossing
crashes and crashes where buses or trams hit other vehicles or pedestrians. Safer Journeys does not actively
try to improve safety by increasing PT’s modal share on the basis that it is safer. Instead it leaves PT funding,
which is a major determinant of PT usage, to be determined by other urban transport considerations
articulated by the government in the GPS.

                                                        7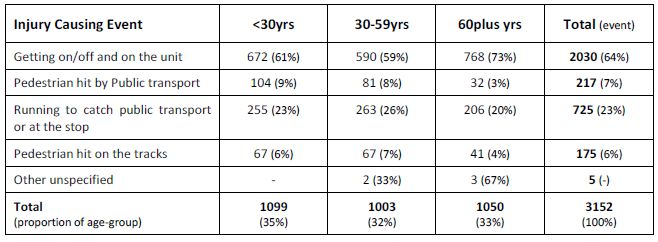
The role public transport can play in safer journeys and, in particular, to advance the Safe System approach

A literature search and a survey of overseas government agencies revealed that a similar approach had been
adopted overseas. Road safety strategies sometimes contained aspirational statements relating to increasing
the share of urban trips carried by PT but this was not accompanied by actions. Where the reasons for this
were articulated they related to the historical reality that PT strategies and policies had always been decided
by considerations outside of road safety. Thus the best strategy for road safety was to accept this and
maximise the safety of the networks as they had been built to accommodate such systems. This would mean
including in Safer Journeys PT-related injury not at present covered in Safer Journeys actions. This approach
was then accepted as appropriate for the New Zealand context and the means of inclusion of PT within Safer
Journeys was considered.

In New Zealand, this step, in the case of on-road vehicles like buses and trams, is already able to be fitted
within the existing Safer Journeys framework for motor vehicle crashes, but not for PT injuries not related to
collisions with other vehicles or pedestrians. New areas of interest and actions (which would of course need
funding) are all that is required to make it happen in New Zealand. Such actions would incur the costs of
gathering the crash information necessary to evolve countermeasures and the cost of the countermeasures
themselves.

To cover PT fully (by including urban commuter rail and ferries), Safer Journeys needs to move from urban
road safety to urban transport safety 1. This would require no structural change, just a restatement of the
reach of the strategy and the inclusion of some new areas of interest and action plans. To achieve this:

•      The whole journey rather than just the road phase needs consideration.

•      Data should be gathered and analysed on injury related to all aspects of the journey.

•      Safety expertise can be positioned in organisational structures to influence how PT is operated. The
       experience of New South Wales is a pointer to what can be achieved.

•      Tools to better monitor PT safety can be made available and used (an example is the progress made by
       Sweden in counting pedestrian-only crashes and injuries to PT passengers).

All the above could relate to Safer Journeys priorities accompanied by Safer Journeys action plans without
changing the framework. In New Zealand, improvement would involve taking actions within the present Safer
Journeys system to better ensure the safety of PT-related travel. These actions could include better
recognition of non-motor vehicle pedestrian injuries and injuries entering/exiting PT in the present system.
Safer Journeys currently addresses injury that occurs on the road network and about which we have
accessible data. There is some information on cycling where no motor vehicle is involved. However, the
following injuries in relation to buses and trams are recorded in separate databases that do not feed into
Safer Journeys:

•      injuries on/within the vehicle

•      injuries boarding/alighting the vehicle

•      injuries walking to/from the vehicle (unless a motor vehicle is involved).

In order to include these injuries in Safer Journeys in such a way that Safe System countermeasures may be
worked out, it is necessary to set up systems that better capture their incidence and characteristics so that
their epidemiology can be better known and countermeasures evolved.

1   This would logically also include freight but this was excluded from the current project.

                                                                8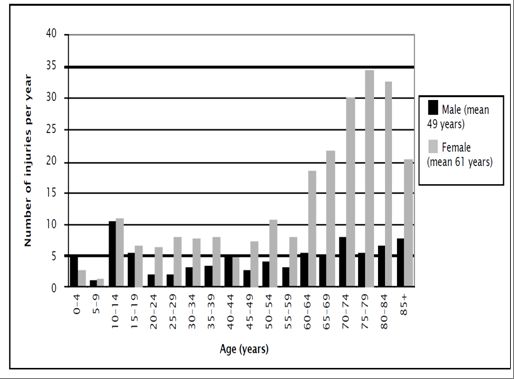
Executive summary

At present pedestrian infrastructure receives no Transport Agency subsidy unless it is part of a joint
pedestrian/cycle facility. This means the money to build and maintain it comes from scarce rate-payer funds.
This may have detrimental impacts on walking routes to and from PT.

There is also an understandable aspiration to make popular walking surfaces visually pleasing. Visually
pleasing surfaces can be safe and of high walkability but they have to be carefully designed, implemented
and maintained if they are to play a full part in a Safe System, and may require higher levels of maintenance
than some simpler surfaces. This will become even more important as the population ages, as older people
are more fragile and thus more vulnerable to injury than younger people.

Also road work practices as they apply to pedestrians require examination, as footpath closures may not
always be accompanied by adequately safe alternative routes. Similar requirements would apply to the safety
of bus/train/ferry stops, access to stops and any safety issues involved in getting on and off vehicles.

Other important areas are the interior design of PT vehicles and the training of drivers to minimise on-vehicle
injury, the design of PT interchanges, vehicle design and operation, and driver management.

On the planning front, safety input to the design of PT projects is important. This would reflect Safe System
principles like:

•   maximal separation of conflicting modes, particularly potentially aggressive modes and vulnerable
    modes, and widespread use of separate travel paths

•   moving towards self-explaining ‘no surprises’ routes for all modes

•   regular Safe System audits of PT systems, including all aspects of the PT journey.

The actions advocated above will not overtly and visibly increase PT patronage. However, these types of
action can also be expected to have a knock-on effect, whereby the resulting safer environment for PT users
on all parts of their journey would encourage further use.

The Safer Journeys strategy was produced and the action plans are overseen by the National Road Safety
Committee (NRSC). The members of the NRSC are the main public sector stakeholders with an interest in road
safety in New Zealand, including the Ministry of Transport, the NZ Transport Agency, the Accident
Compensation Corporation and the NZ Police. Any changes to be made to the strategy and action plans would
need to be agreed by the NRSC. An area such as PT would therefore have to be considered by the NRSC in
conjunction with the other road safety areas set out in Safer Journeys, and included and prioritised
accordingly. The timing and extent of any changes to the priorities and action plans in the strategy would
need to be discussed.

If commuter rail was to be included a decision would need to be made as to whether commuter rail operators
should be represented on the committee when rail-related topics were up for discussion, or whether the
input of the Transport Agency’s Director of Rail Safety would be sufficient.

The recommendations arising from this work are that:

•   The uptake and provision of urban PT is encouraged by the government in parallel with road safety under
    the overarching GPS.

•   The NRSC consider the incorporation of urban PT safety into the Safer Journeys strategy accompanied by
    an appropriate name change for the NRSC to better reflect its wider scope.

•   This includes consideration of Safer Journeys actions in these areas:

    –   The acquisition of data to allow analysis of the safety of the whole journey, including segments to
        and from the PT vehicle, the journey on the PT vehicle, entering and leaving the vehicle, and the

                                                       9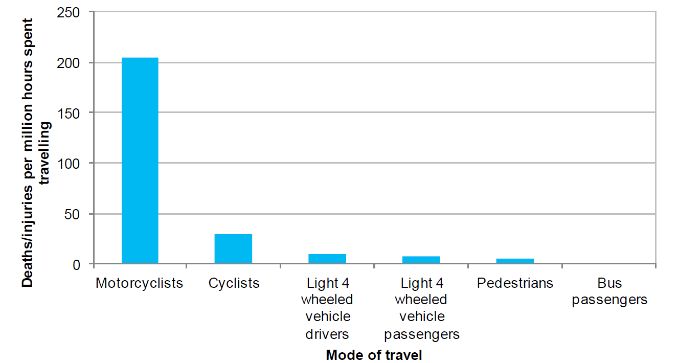
The role public transport can play in safer journeys and, in particular, to advance the Safe System approach

         implications after this for a pedestrian or cyclist. This would include the feasibility of such
         acquisition, the utility of the available data, and the costs of such acquisition related to the benefits.
         Most of this data would be from sources outside of Police reported crashes and would thus be
         outside the scope of the NZ Transport Agency’s Crash Analysis System

    –    Analysis of the above data to provide safety benchmarks and information related to the development
         of Safe System countermeasures

    –    Carrying out work to develop Safe System actions in the form of countermeasures to ameliorate any
         safety problems the analyses may uncover

    –    Assess the priority of such actions relative to existing actions.

•   The NRSC consider whether the Safer Journeys strategy should include the management systems of non-
    road PT providers as it does at present for on-road PT.

•   The NRSC consider carrying out work to elucidate the impact on road safety funding allocation of
    including the above additional areas into Safer Journeys actions.

Abstract
The key objectives of this research were to identify the contribution that urban public transport (PT), which is
generally considered safer than travel by light motor vehicles, can make to the Safe System approach, and to
develop an implementation plan for the insertion of PT as a safe mode into the Safer Journeys framework and
action plans. The work indicated that, as in New Zealand, the practice overseas was for road safety strategists
not to attempt to influence modal split in the direction of safer PT modes, but rather to accept the levels of
modal split resulting from government PT policies and then to ensure that the system which results is
managed according to Safe System principles. This would mean including in Safer Journeys PT-related
injuries not at present covered in Safer Journeys actions. This would require no structural change, just a
restatement of the reach of the strategy and the inclusion of some new areas of interest and action plans. To
achieve this, the whole journey rather than just the road phase needs consideration. Data on injury related to
all aspects of the journey should be gathered and analysed; safety expertise can be positioned in
organisational structures to influence how PT is operated, and tools to better monitor PT safety can be made
available and used.

                                                            10
1 Introduction
1 Introduction
The purpose of this research project was to identify systematic contributions that could be made to improve
road safety outcomes in New Zealand when considering urban public transport (PT) specifically, including
road-based modes, rail and ferries, and to determine how PT could best be inserted in the Safer Journeys
framework and action plans. PT includes the entire journey of which the leg taken on the PT vehicle is part.
This represents a gap in the current New Zealand approach, with the relationship between PT and Safer
Journeys not having been considered previously. Journeys to and from PT may use vulnerable modes. It is
important for walking and cycling safety to be a high priority to encourage people to use these modes and
access the health benefits they afford. Also, fewer injuries will occur if there is good urban planning to
provide efficient transport and reduce unnecessary journeys.
PT is generally considered a safe form of transport. For example, in New Zealand, passengers in cars and
vans are seven times more likely than bus passengers to be killed or injured in a crash (for the same time
spent travelling) (MoT 2015e), indicating that bus travel is comparatively a very safe mode of travel for
passengers. Note that this does not include falls inside of buses or injuries sustained entering or exiting
buses. Bus drivers are very seldom killed, with no deaths in 2012, but six drivers were seriously injured and
43 sustained minor injuries in that year. A good illustration of this safety increment over cars comes in a
2007 Ministry of Transport trial of scrapping older vehicles in order to increase the safety of the vehicle fleet
(MoT 2008). The safety benefits to drivers of subsequently using PT by virtue of a free PT pass given as a
participation incentive substantially exceeded the safety benefits from upgrading a personal vehicle.
The key objectives of this research were to identify the contribution that PT could make to the Safe System
approach, and to develop an implementation plan for the insertion of PT as a safe mode into the Safer
Journeys framework and action plans.
In order to achieve these goals, the project had the following objectives:
• Complete a comprehensive review of existing international and New Zealand literature and practice
identifying best practice examples of Safe System approaches with an emphasis placed on PT systems.
• In the light of knowledge from the review and information from transportation studies, draw conclusions
regarding the potential contribution of a modal shift to PT with present urban form, and how this
contribution could be enhanced with the use of urban densification.
• Use insights drawn to devise a method of integrating PT issues fully into the Safe System approach to
road safety, and make recommendations as to how this might also be integrated into Safer Journeys.
• Develop an implementation plan communicating, advising and suggesting means of incorporation of
findings from the project into Safer Journeys.
The first part of this project involved a review of information available to date. Note that PT has been defined
as urban PT, in areas where the environment is predominantly built. The review was carried out from a Safe
System perspective. It was thus assumed that a Safe System approach was appropriate for all urban transport
modes including ferry and rail, whether or not this Safe System approach was pursued within the umbrella of
New Zealand’s Safer Journeys road safety strategy or by some other mechanism.
11The role public transport can play in safer journeys and, in particular, to advance the Safe System approach
2 Road safety strategy in New Zealand – its
development
2.1 Road safety strategy in New Zealand prior to the Safer
Journeys strategy
Road safety strategy in New Zealand began to develop with the first New Zealand National road safety plan
published in 1991 by the then Land Transport Division of the Ministry of Transport (MoT 1991). The Land
Transport Division was established in 1988 when the component parts of MoT were given greater autonomy.
The plan came as a response to discussion at a series of road safety seminars held by MoT in July and August
1990. An issue which arose from the seminars was a need to improve coordination through a national road
safety plan. The plan was prepared for an Officials Committee on Road Safety which reported to an
overarching Ministerial Committee on Transport Policy. Previously, road safety actions tended to be carried
out on a more ad-hoc basis. Road safety strategies tend to reflect the background of the people charged with
producing them and the governments in power at the time. The 1991 strategy, written primarily by a health
promotion professional, took a generally public health perspective, while acting as a precursor to the later
Safe System approach by using a frame of reference including the four themes:
• safer people
• safer roads
• safer vehicles
• safer systems.
The public health perspective in the document is reflected in its quoting of the WHO Ottawa Charter for
Health Promotion (1986) and its five interactive strategies for health promotion as underpinning principles of
the plan. The five strategies were:
• Building healthy public policy – by putting health on the agenda of policy makers in all sectors and at all
levels within society
• Creating supportive environments – creating living and working environments which promote health and
are ecologically sound
• Strengthening community action – making it easier for concrete and effective community action to take
place as part of the health promotion process
• Developing personal skills – providing information and education for health and enhancing life skills
• Re-orienting health services – moving the health sector in a health promotion direction, beyond its
responsibility for providing clinical and curative services.
The public health perspective was further reflected in targets to progressively reduce carbon dioxide
emissions by reducing vehicle travel, which would have side benefits in the road safety arena. Land use
planning was also included, with a target to ‘include road safety statements in territorial local authority land-
use planning/resource management statutory documents by 1995’. The mention of travel reduction and land
use planning meant that PT encouragement by appropriate land-use planning was on the table implicitly as a
possible tool but never actually mentioned. After the Land Transport Division of the MoT was rebranded as
the Land Transport Safety Authority (LTSA) in 1994, it was decided to plan a road safety strategy to 2010,
with challenging but achievable targets. This time the strategy was directed by a person with an economics
122 Road safety in New Zealand – its development
background, resulting in a quantitative process involving econometric modelling. A key component of
New Zealand’s road safety strategy to 2010 was an outcomes management framework linking outputs with
outcomes via the road safety pyramid shown in figure 2.1.
Figure 2.1 Road safety pyramid
Social
cost
Final
outcomes
Road
user
groups
Intermediate
outcomes
Regions
Outputs
Definitions
• Social cost is the aggregate measure of all costs that crashes inflict on the community. It includes not
just material losses but also pain and suffering.
• Final outcomes consist of fatalities and serious injuries. They are what society seeks to avoid and are
the main components of social cost.
• Intermediate outcomes are not desired for themselves but for what they entail – better final outcomes.
They include average traffic speeds, the proportion of drunk drivers, the seatbelt-wearing rate, fitness
to drive or ride, the physical condition of the road network, and the standard of the vehicle fleet.
Intermediate outcomes are measured because it is both easy to do so and because they are generally
reliable indicators of how well road safety interventions are working.
• Outputs represent physical deliverables, for instance the number of police patrols and infringements,
and the amount of advertising delivered. Alternatively they correspond to milestones showing that a
specified task has been completed.
• Social cost and final outcomes, but not all intermediate outcomes and outputs, can be broken down
by road user group and local government region. This ensures that the benefits of road safety are
fairly distributed.
Source: LTSA (2000)
In LTSA (2000), the Safe System approach, in the forms of the Swedish ‘Vision Zero’ and the Netherlands
‘Sustainable Safety’, is discussed in a fashion which implies acceptance (p58), but is never explicitly
mentioned in the final strategy document (MoT 2003). This document, which is the condensed end product of
a long and technically demanding gestation process, does not mention PT. However, PT was considered in the
consultative discussion document which accompanied the launch of the process to develop the strategy (LTSA
2000). The document includes the following textbox (p12):
Public transport is generally much safer than travel by car, motorcycle or bicycle. So by
encouraging people to use public transport instead, we can increase road safety. The
government has recently announced a new funding system for public transport that subsidises
public transport operators on the basis of their patronage. The aim is to increase the role of
13The role public transport can play in safer journeys and, in particular, to advance the Safe System approach
public transport as a safe and affordable alternative to car travel. We recognise, however, that
safety is only one factor in optimising the mix of private and PT; cost, convenience and
environmental impact must also be considered.
This view underpinned the strategy’s standpoint of dealing only with traffic as it appeared on the road, rather
than trying to influence the uptake of public transport. This was left to the overarching transport strategies of
the government of the time, which would determine public transport’s level of subsidy, and thus its share of
the Road Transport Fund’s dollar vis-à-vis personal transport. When this strategy had run its course it gave
way to the present Safer Journeys, which is discussed in the following section.
2.2 The strategy and its framework
New Zealand’s Safer Journeys road safety strategy takes a Safe System approach to road safety. This
approach focuses on creating safe roads, safe speeds, safe vehicles and safe road use. Under the Safe System
approach to road safety, a road system is created in which serious and fatal injuries do not occur. In order for
this to happen, all necessary measures must be taken to avoid crashes and, if crashes do occur, the people
involved should not be subjected to the sort of trauma that would result in fatal or serious injury. The Safe
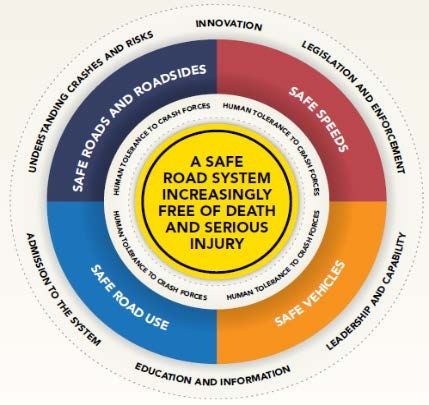
System approach, as it applies to Safer Journeys, is illustrated in figure 2.2. Safer Journeys is accompanied by
a series of action plans (www.saferjourneys.govt.nz/action-plans/) attacking various ‘areas of concern’ within
the framework illustrated.
Figure 2.2 The Safe System approach as it applies to Safer Journeys
2.3 The context of the Safer Journeys strategy with respect
to PT
PT strategies and Safer Journeys are both over-arched by the Government policy statement on land transport
2015/2016 (GPS 2015) and are administered in parallel by the MoT and its partner agencies. Regarding PT
this states:
We see the need for public transport to help unlock the potential of our urban areas by providing
additional capacity on key corridors and a choice of ways to move around, particularly during
peak commuting periods (p8)
142 Road safety in New Zealand – its development
GPS 2015 provides for increased provision of public transport, if justified by demand (p8)
Much of this investment has been ahead of patronage demand, particularly in metro rail
services. A period of consolidation is needed where the focus is on securing the anticipated
patronage gains (p19)
A previous MoT publication (MoT 2011) also saw PT as a means to reduce emissions:
Improve modal choice in our main urban areas, so people can make greater use of PT, walking
and cycling, thereby reducing their emissions. (p32)
Regarding road safety, the GPS (2015) states:
Road safety is one of the Government’s top transport priorities. This GPS continues support for
the Safer Journeys programme and its ‘Safe System’ approach, which targets safer roads and
roadsides, speeds, vehicles and road users. (p1)
15The role public transport can play in safer journeys and, in particular, to advance the Safe System approach
3 Road safety strategy overseas
The fundamental principles of the Safe System approach to road safety (sometimes called Vision Zero or
Sustainable Safety) have been adopted by the governments of other countries such as Austria, the Czech
Republic, Denmark, Sweden, Norway, Poland, Finland, Iceland, the Netherlands, Switzerland, Slovenia, the
European Commission generally, and Australia, as well as in New Zealand (OECD 2014; OECD/ITF 2008). The
International Transport Forum (ITF) organisation within the Organisation for Economic Cooperation and
Development (OECD) encourages all its member nations to adopt the Safe System approach to road safety.
The Safe System approach is also endorsed by the Global Road Safety Partnership (www.grsproadsafety.org/,
the World Bank, the World Health Organisation (WHO), the EU and the European Transport Safety Council
(ETSC) 2 3. Those countries without a Safe System approach have, in the majority, based their strategies on the
use of targets and/or statements with which to improve safety, or in some way lead in safety (see OECD
2014). More detail on the approach of four of the leading Safe System countries is provided in the next part
of this section.
3.1 The Netherlands
The Netherlands has adopted a version of the Safe System approach called ‘Sustainable Safety’. The genesis
of this approach came from Koornstra et al (1992) which contains the following statement:
In a sustainably safe road traffic system, infrastructure design inherently and drastically
reduces crash risk. Should a crash occur, the process that determines crash severity is
conditioned in such a way that severe injury is almost excluded.
This was based on the proposition that widespread injury should not be tolerated on the road, in a similar
way to its not being tolerated in other modes. Over the years this principle has led to infrastructure
improvements aimed at separating incompatible modes, an emphasis on safe vehicles, and human
behavioural measures like a very low permissible blood alcohol level for drivers and copious practice
requirements for novice drivers. How this statement of principle should work out in practice is summarised in
five sustainable safety principles as presented in table 3.1 from Wegman et al (2006).
Table 3.1 Netherlands Sustainable Safety principles
Sustainable Safety principle Description
Functionality of roads Monofunctionality of roads as either through roads, distributor roads,
or access roads, in a hierarchically structured road network
Homogeneity of mass and/or speed and Equality in speed, direction and mass at medium and high speeds
direction
Predictability of road course and road user Road environment and road user behaviour that support road user
behaviour by a recognisable road design expectations through consistency and continuity in road design
Forgivingness of the environment and of road Injury limitation through a forgiving road environment and
users anticipation of road user behaviour
State awareness by the road user Ability to assess one’s capability to handle the driving task
2The ETSC (http://etsc.eu) is a Brussels-based independent non-profit making organisation dedicated to reducing the
numbers of deaths and injuries in transport in Europe.
3 http://etsc.eu/wp-
content/uploads/2014/03/ETSC_Response_to_EC_First_Milestone_Towards_an_Injury__Strategy_May_2013.pdf
163 Road safety strategy overseas
Detailed proposals for what can be done in the Netherlands to 2020 based on the above principles are
contained in Wegman et al (2006). The proposals in this document do not involve PT directly but urban
planning measures to increase PT usage are seen as something that is serendipity for road safety.
3.2 Sweden
The Swedish Vision Zero concept is based on a similar premise to the Netherlands’ Sustainable Safety, namely
that ‘eventually no one will be killed or seriously injured within the road transport system’ (Swedish Ministry
of Transport and Communications 1997). In October 1997, this vision was officially adopted in a Road Traffic
Safety Bill passed by a large majority in the Swedish parliament. This has been the cornerstone of Swedish
road safety policy ever since. Over the years this principle has led to infrastructure improvements aimed at
separating incompatible modes, an emphasis on safe vehicles and human behavioural measures like low legal
alcohol limits for driving, and extensive practice requirements for novice drivers. The measures Sweden has
taken to move in the direction of Vision Zero are well summarised in an article in The Economist (2014). The
Economist relates how planning has played the biggest part in reducing crashes. Safety is prioritised over
speed or convenience. There are low urban speed limits, pedestrian zones and barriers that separate cars
from bikes and oncoming traffic. Building 1,500km (900 miles) of ‘2+1’ roads, where each lane of traffic
takes turns to use a middle lane for overtaking, was claimed to have saved around 145 lives over the first
decade of Vision Zero. Also, 12,600 safer crossings, including ‘pedestrian bridges and zebra-stripes flanked
by flashing lights and protected with speed-bumps’ have contributed to halving the number of pedestrian
deaths over the past five years. Less than 0.25% of drivers tested are over the alcohol limit. At three deaths
per 100,000 population, Sweden is one of the safest countries in road safety by that measure 4. This record is
attributed primarily to the widespread adoption of the Safe System philosophy. Sweden’s recent name change
of Swedish Roads Administration to Swedish Transport Administration further reflects its commitment to not
just road safety but transport safety in general.
3.3 Norway
Norway has a National Plan of Action for Road Traffic Safety which is published every four years, and is based
on Vision Zero (Directorate of Public Roads 2015) as a fundamental principle. The Norwegian version of
Vision Zero is ‘A vision of no road fatalities or road accidents causing lifelong injury is set out for the long-
term road safety effort’ (Ministry of Transport and Communications 2000).
According to OECD (2014) ‘Norway adopted Vision Zero by a decision in Parliament (Stortinget) in 2001, and
strategies based on the vision were first implemented in the National Plan of Action for Traffic Safety 2002–
2011. The government has since reiterated that Vision Zero will provide the basis for traffic safety activities in
Norway in all subsequent national transport plans and in the latest National Plan of Action for Traffic Safety
2010–2013’. OECD (2014) also states that the Norwegian Vision Zero involves all modes of transport but
provides no information outside traditional road safety areas.
The latest version of the plan identifies and describes 152 measures that will be implemented by the national
government agencies, namely the Norwegian Public Roads Administration, the National Police Directorate, the
Norwegian Directorate of Health, the Norwegian Directorate for Education and Training and the Norwegian
Council for Road Safety.
4 www.internationaltransportforum.org/irtadpublic/pdf/risk.pdf Accessed 7 June 2015.
17The role public transport can play in safer journeys and, in particular, to advance the Safe System approach
3.4 Australia
Australia’s approach to road safety is similar to New Zealand’s. Indeed, the approaches of the two countries
have developed in the background of an extensive interchange of ideas. All the states have their own
variations on the theme, as will become apparent later from the state survey responses, but the principles are
summarised in the National Road Safety Strategy which is coordinated by the Federal Government and put
together by a National Committee on which all states and territories are represented. According to OECD
(2014), ‘the strategy is firmly based on Safe System principles and is framed by the guiding vision that no
person should be killed or seriously injured on Australia's roads’. To progress towards this vision the strategy
includes a 10-year plan to reduce the annual numbers of both deaths and serious injuries on Australian roads
by at least 30% by 2020, relative to the average numbers of fatalities and serious injuries in the baseline
period 2008–2010.
184 New Zealand’s Safer Journeys and public transport
4 New Zealand’s Safer Journeys and public
transport
As with most other road safety strategies, Safer Journeys does not specifically address PT issues. It also
does not contain any actions related to PT apart from the reduction of crashes involving buses, which has
always been a recognised part of the road safety problem to be addressed by such documents. It does,
however, in the related document Safer Journeys for planners (New Zealand Government 2012), provide
the following as something which can be done to provide good planning for road safety:
Provide for safe and secure public environments that encourage walking and the use of PT
(p2)
The inclusion of PT in Safer Journeys at a more specific level was considered by MoT at the time of its
development. On p14 of the Ministry’s summary of public submissions (MoT 2009) related to Safer
Journeys, the following statement appears:
One of the most commonly made criticisms of the safe system approach was its focus on cars
and trucks and its lack of emphasis on public transport; sustainable forms of transport such
as walking and cycling; and other modes of freight transport, in particular rail and sea.
Those submitters argued that the strategy is based on the premise that road use will increase
when they believed it should aim to reduce the current number of vehicle trips made.
The document further quotes the following as an example of such submissions:
A further weakness of the systems approach is that it fails to consider cycling, walking, and
passenger transport as being integral parts of the system. They appear as add-ons – in fact
the safety of passenger transport users makes no appearance at all. A transport system
includes non-vehicle modes of transport and passenger transport.
Also in its stakeholder submission on Safer Journeys Auckland Transport recommended:
The encouragement of safer transport choices through public transport and travel plans
(MoT 2012b)
In the end, the Ministry decided that, as it relates to Safer Journeys, public transport would be regarded as
something which is looked after in parallel to road safety as part of overarching strategies under the
government’s policy direction. The government has published Connecting New Zealand, a document which
summarises its policy direction in transport (MoT 2011). With regard to public transport, Connecting New
Zealand contains the following commitment to improving use of public transport:
Improve modal choice in our main urban areas, so people can make greater use of public
transport, walking and cycling, thereby reducing their emissions. (p32)
This statement, which has a similar standpoint to that prevailing in most of the world (as we will see later
in this document) assumes that the safety of public transport is adequately covered in the regulations and
strategies pertaining to the various modes of PT, ie buses, rail and ferry. Part of this project looked at how
these modes are regulated and whether there is any likely improvement available from bringing them
under the Safer Journeys umbrella.
Any attempt to integrate PT into Safer Journeys must have net positive benefits for safety, over and above
those available under the present system. This means the costs of the reduction in trauma events must be
greater than the continuing institutional costs of implementation, and there needs to be some evidence
19The role public transport can play in safer journeys and, in particular, to advance the Safe System approach
that integration will reduce trauma. This in turn means there needs to be a mechanism to achieve this
reduction in trauma.
The methods used must be within a Safe System framework and also be capable of implementation under
the government’s GPS and fiscal constraints. Safer Journeys in essence means movement towards the
ultimate goal of a Safe System while prioritising actions to get best value for money in moving towards
that goal.
The purpose of this research was to identify the contribution that PT can make to the Safe System
approach, which underpins the Safer Journeys road safety strategy in New Zealand.
This means that all components of PT must be consciously moving in the direction of a Safe System and
demonstrate that they are doing so. For instance some countries pay little, if any, attention to rail
trespasser incidents. Becoming a rail trespasser is a ‘mistake’ 5 and Safe System approaches try to save
people whether or not they are mistaken. Thus any Safe System which had no strategy to try to prevent rail
trespasser incidents would be unacceptable.
In addition all PT providers would have to be moving towards Safe Systems within their businesses. This
would include their provision for passenger and staff welfare and would cover such aspects as fatigue
management, vehicle safety and work safety.
5 Unless a suicide is involved.
205 How public transport is regulated
5 How public transport is regulated
PT is in general regulated in terms of its workers along the zero harm lines of occupational health and
safety requirements. Applying Safer Journeys principles to PT would extend this principle to PT users,
giving them similar protection as in the workplace.
5.1 Passenger ferries
At present, passenger ferries are required to comply with Maritime New Zealand safety guidelines
(Maritime New Zealand 2007). They are also required, in terms of their workers, to comply with the Health
and Safety in Employment Act 1992 which, like Safer Journeys, has a zero harm focus.
5.2 Passenger rail
Passenger rail, along with other rail traffic, is regulated by the Transport Agency. According to the
Transport Agency, its role is to:
Ensure rail operators operate in a way that secures the safety of rail passengers, rail workers
and the public when in, or in the vicinity of, the rail corridor (NZ Transport Agency 2013a)
The Transport Agency supports and undertakes regular reviews of safety performance. In 2013, the
Transport Agency commissioned Australasian Transport Risk Solutions Pty Limited to complete an
independent review of its rail regulator function focused on the following questions:
• Does the legislative framework represent best practice?
• Does the rail regulator’s operational policy represent best practice?
• Does the rail regulator’s operational activity reflect best practice?
This review concluded that New Zealand’s current rail legislation represents ‘good’ if not ‘best’ practice.
The legislation in its current form does not prevent or limit, in any way, the role of the Transport Agency
in delivering improved safety performance, but reviewing the legislation and the Transport Agency’s rail
resourcing would be beneficial. The review identified the following areas where, in its opinion,
performance could be enhanced (NZ Transport Agency 2014a). These were:
• Lifting the position of the rail safety regulator to a more senior level within the Transport Agency
• Promoting and reinforcing to stakeholders the role of a visible and respected safety regulator
• Improving resourcing and specialist competencies on the rail safety team
• Establishing a closer working relationship with the Australian National Rail Safety Regulator to take
advantage of the sharing of information and specialist expertise
• Taking a greater role in the leadership, education and provision of information to the New Zealand rail
industry.
In response to the review, the Transport Agency released an action plan in December 2013 (NZ Transport
Agency 2013a) designed to address areas identified for improvement in the review. The goal was to
reduce the rate of death and serious injury associated with the rail industry and achieve a decline in
‘precursor events’ like signals passed at danger (SPAD).This goal is very similar to that of the Safer
Journeys Safe System approach. It is also in accordance with the fact that, as with passenger ferries and
21The role public transport can play in safer journeys and, in particular, to advance the Safe System approach
commercial road vehicles including buses, rail is required to comply with the Health and Safety in
Employment Act 1992 which, like Safer Journeys, has a zero harm focus.
The key foci of the action plan are:
• enhanced governance, including the appointment of a Director Rail Safety in the Transport Agency
(who is now in place)
• performance monitoring and transparency, including establishing a more rigorous approach to
monitoring and reporting of incidents
• increased resource and capability within the Transport Agency and increased sharing of experience
with Australian rail regulators
• review of the financial sustainability of rail safety regulatory services.
Safety improvement strategies are also in place for tunnels, SPADs, level crossings and unauthorised
access (NZ Transport Agency 2014b).
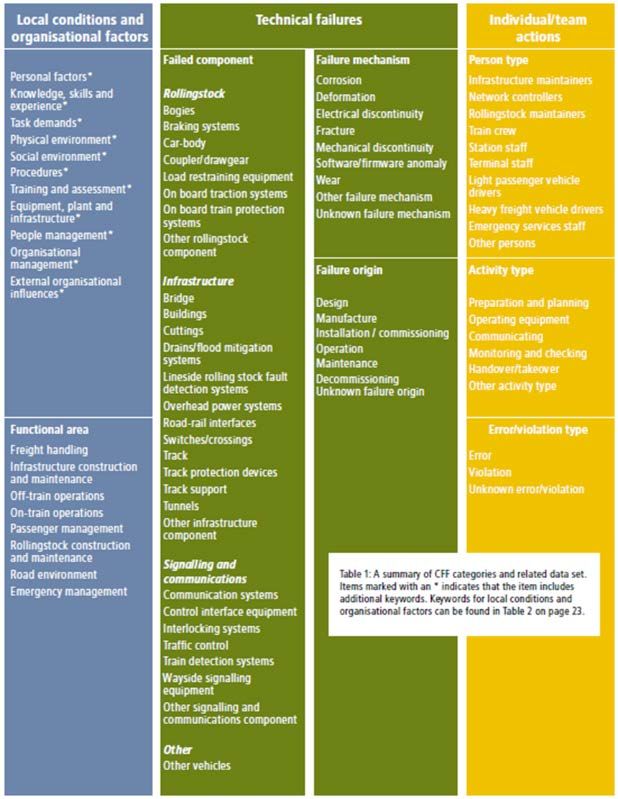
In Australia, a systems approach broadly similar to the Safe System approach of Safer Journeys has been
adopted by the Office of the National Rail Safety Regulator (ONRSR) as a core element of its investigation
process, but has only been applied in Victoria and New South Wales. The Rail Safety Regulators’ Panel has
developed a systems framework, the Contributory Factors Framework, with which to code and analyse all
rail safety occurrences that by law have to be reported to the ONRSR (Rail Safety Regulators’ Panel 2011).
The framework and associated taxonomy (shown in figure 5.1 and figure 5.2) are designed specifically to
address the systemic contributions to rail safety.
Figure 5.1 Summary of Contributory Factors Framework categories
Source: Rail Safety Regulators’ Panel (2011)
22You can also read