FAT-Schriftenreihe 344 - Review of non-exhaust particle emissions from road vehicles - VDA
←
→
Page content transcription
If your browser does not render page correctly, please read the page content below
FAT-Schriftenreihe 344
Review of non-exhaust particle emissions from road vehicles
Review of non-
                     non-exhaust particle emissions
                      from road vehicles

Roy M. Harrison
Division of Environmental Health and Risk Management
School of Geography, Earth and Environmental Sciences
University of Birmingham, Edgbaston
Birmingham B15 2TT
United Kingdom

Das Forschungsprojekt wurde mit Mitteln der Forschungsvereinigung
Automobiltechnik e.V. (FAT) gefördert.
EXECUTIVE SUMMARY

Non-exhaust emissions of particles from road vehicles arise from wear of the brakes, tyres and road

surface, and resuspension of road surface dusts by passing traffic. These now widely exceed exhaust

emissions of particles in countries where the fitting of diesel particle filters has been mandatory for several

years. There have been multiple studies of the creation of particles from the abrasion of vehicle brakes and

tyres. Particle size distributions have been measured both in the laboratory and the field, and can include

an ultrafine fraction generated at higher temperatures. Brake linings, and hence brake wear particles show

huge chemical diversity, but Cu, Ba and Sb can be used as environmental tracers. Fe which arises from both

the pad and disc is emitted in greater quantities, but has other substantial environmental sources. Zn has

been used as a tracer for tyre wear, although it is also emitted from brake wear and other sources. A

number of organic compounds have been used as tracers for tyre wear particles, which are typically

emitted with embedded mineral material. There has been much less work on road surface wear, and

although emission factors are available, there have been few environmental measurements. Its

composition is likely to bear some similarity to that of the other main source, resuspension of road surface

dust, which is dominated by crustal elements such as Si, Al, Ca and Fe. Resuspension emissions are

dependent upon the road surface dust loadings, which are highly variable and rather few measurements

exist. The USEPA algorithm widely used to calculate resuspension emissions is empirical, but has been

subject to some criticism. While most brake wear particles are
Electric Vehicles suggests little overall difference in total particle emissions relative to Euro 6 diesel and

gasoline vehicles.

There have been a number of in vitro studies of the toxicity and Oxidative Potential of non-exhaust

particles, either as brake dust, tyre dust or particles sampled in roadside air, as well as both inhalation and

installation in vivo studies in rodent models. These show toxic effects, typically only at higher

concentrations, but are inconsistent in their findings. They establish a probable hazard from inhalation of

non-exhaust particles, but not the risk to humans. There have also been population-based epidemiological

studies. Such studies require a pre-processing of the air quality data to identify one or more “factors”

which represent non-exhaust particle sources, which are subsequently used to seek associations with

adverse health outcomes. In many of the studies, there appears to be an incomplete separation of source-

related factors, or an erroneous or ambiguous assignment of source to a factor. The studies cover a wide

range of health outcomes, and no consistent pattern of effects related to a “non-exhaust” particle source

emerges from the results of such studies, and hence there are no acceptable exposure-response functions

either for total non-exhaust particles, or for any of the individual non-exhaust sources. These are likely to

prove difficult to determine due to uncertainties in the source attribution stage of the studies, but also

because of the likely strong spatial and temporal correlation of non-exhaust and exhaust particles in the

atmosphere which challenges the ability of epidemiological models to achieve reliable separation of effect

attribution. The recently achieved dominance of non-exhaust over exhaust particles in urban air may

simplify this problem when a traffic factor can be taken to represent largely non-exhaust emissions. In the

absence of exposure-response functions specific to non-exhaust particles, and considering the lack of

adequate coherent information on the differential toxicity of particles from different sources (as concluded

by a number of authoritative bodies) , the only viable approach to estimating the public health impact of

non-exhaust particles is to view them simply as contributors to PM2.5 and PM10 and to apply exposure-

response functions derived for those metrics.

                                                        3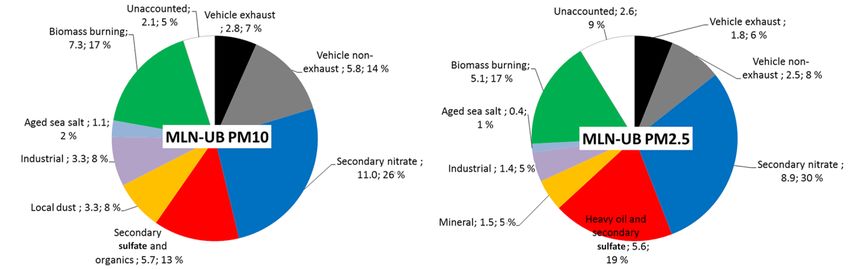
CONTENTS LIST
                                                                               Page No.

EXECUTIVE SUMMARY                                                                  2

INTRODUCTION                                                                       7

1.    REVIEW OF CHEMICAL AND PHYSICAL PROPERTIES OF NON-EXHAUST PARTICLES          7

1.1   Brake Wear Particles                                                         7

            Brake wear particle size spectra                                       9

            Atmospheric concentrations                                             11

            Emission factors for particulate matter                                12

1.2   Tyre Wear Particles                                                          12

            Chemical composition of tyres                                          13

            Experimental rigs                                                      15

            Association of tyre wear and road surface wear particles               16

            Airborne emissions size fractions                                      16

            Particle size spectra                                                  17

            Effects on tyre emissions of vehicle usage and driving behaviour       18

            Contribution of tyre wear particles to airborne concentrations         19

1.3   Road Surface Wear Particles                                                  19

            Composition – road surface                                             20

1.4   Particle Resuspension Emissions                                              21

            Carriageway silt                                                       23

            Resuspension particle size spectra                                     25

            Resuspension – measured by moving vehicles                             25

            Effects of road type, driving and weather conditions                   27

            Chemical characteristics of road dust and resuspended particles        29

1.5   Receptor Modelling                                                           31

1.6   Battery-Electric Vehicles (BEV)                                              32

                                                      4
2. TOXICITY AND HEALTH EFFECTS OF NON-EXHAUST PARTICLES 33
2.1 In Vitro Toxicity Testing 33
2.2 In Vivo Toxicity Studies 34
2.3 Results of Epidemiological Studies 36
2.4 Carcinogenicity of Antimony 40
2.5 Synthesis of Health-Related Studies 40
REFERENCES 42
TABLE AND FIGURE LEGENDS 58
Table 1: Overview of most common key tracers used for brake wear emissions 58
(based upon Grigoratis and Martini, 2015).
Table 2: Emission factors from PM10 from tyre and brake wear (from AQEG, 2019). 58
Table 3: Literature estimations of the contribution of tyre wear particles to airborne 59
PM (%) (from Grigoratos and Martini, 2014).
Table 4: Percentage contributions of road dust sources to airborne PM concentrations 60
(based upon Gulia et al., 2019).
Table 5: In vitro tests of toxicity of source samples and/or airborne particles. 61
Table 6: In vivo tests of toxicity of source materials and/or airborne particles. 61
Table 7: Epidemiological studies with a measure of non-exhaust particles. 62
Figure 1: PM10 emissions from road transport sources according to the UK and German 63
Inventories. The scale on the y-axis applies to both countries
(from Wakeling et al., 2017).
Figure 2: UK non-exhaust emissions (tonnes/year) for different vehicle classes for 2016 from 64
the UK National Atmospheric Emissions Inventory (from AQEG, 2019).
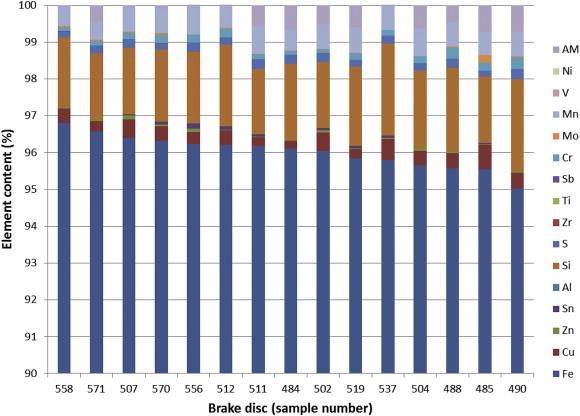
Figure 3: Elemental content of metals in brake pads, as measured by Hulskotte et al. (2014). 65
Figure 4: Elemental content of metals in brake discs, as measured by Hulskotte et al. (2014). 66
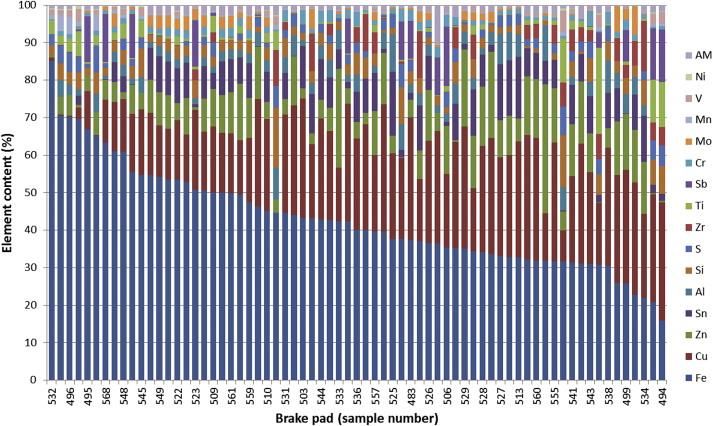
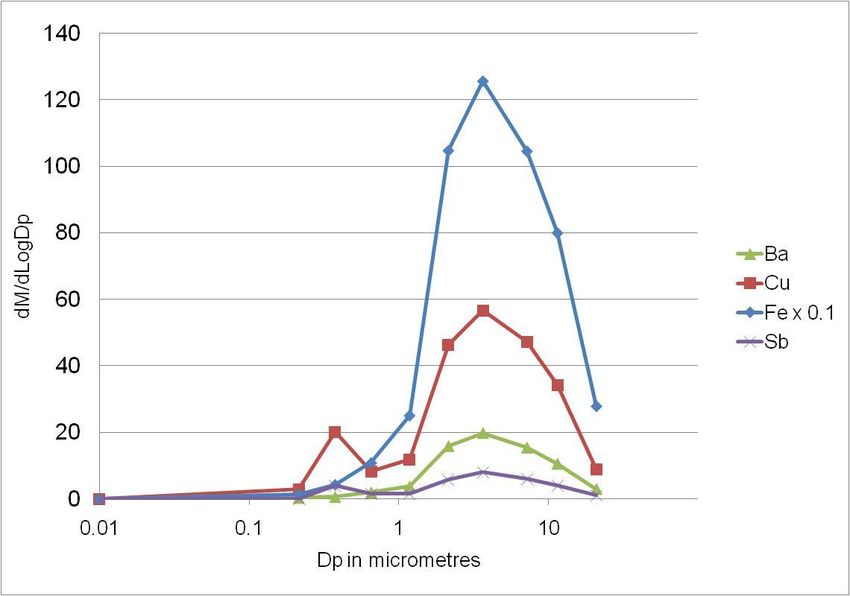
Figure 5: Size Distribution of Ba, Cu, Fe, and Sb at (a) Marylebone Road and (b) Regent’s Park 67
(ng m-3) (from Gietl et al., 2010).
Figure 6: Particle mass size distributions of Ba, Si and Zn scaled to represent the masses of 68
brake wear, resuspension and tyre wear respectively, compared to measured total
mass in the roadside increment at London, Marylebone Road (from Harrison et al.,
2012).
5Figure 7: Speed dependence of emissions factors for brake and tyre wear. Each are normalised 69
to their respective emissions rate at 100 km h-1. In this plot speed refers to the
average traffic speed and not the instantaneous speed of any vehicle (from AQEG,
2019).
Figure 8: Source apportionment of PM2.5 and PM10 in air samples from a Milan urban 70
background site (from Amato et al., 2016c).
Figure 9: Cytotoxicity measured as the release of lactate dehydrogenase (LDH) in A549 cells 71
after treatment with the different PM samplers for 24 h at a [C] or 100 µg/cm2.
Data is shown as percentage of control (untreated A549 cells) for constant mass.
*P < 0.05 vs RB within the same size fraction (ANOVA with Dunnett). Two factor
ANOVA analysis of the full dataset, revealed no significant contrasts related to
particle size, upon adjustment for sampling location (from Wessels et al., 2010).
6INTRODUCTION
As controls on exhaust emissions of particulate matter from road vehicles have taken effect over the past
decade, non-exhaust emissions arising from abrasion of brakes, tyres and the road surface, and from
resuspension of dust have become more prominent, and now exceed exhaust emissions. Figure 1 shows
the estimates and future projections from the United Kingdom and German inventories for the quantified
exhaust and non-exhaust sources which do not include resuspension emissions. Although not as yet
subject to regulation, these are now attracting the attention of regulators and may well be a target for
controls in future, especially since electrification of the road vehicle fleet will not eliminate emissions.
Although all road vehicle types emit non-exhaust particles, passenger cars make much the greatest
contribution (Figure 2). This review seeks to summarise the current state of knowledge of the emissions
and their possible consequences for human health. It is based upon an overview of the voluminous
literature, building upon earlier reviews such as those by Thorpe and Harrison (2008), Grigoratos and
Martini (2015), Amato et al. (2014a) and AQEG (2019), without seeking to be exhaustive. It first considers
the properties and controlling factors for the emissions, and then the possible consequences for human
health.
1. REVIEW OF CHEMICAL AND PHYSICAL PROPERTIES OF NON-EXHAUST PARTICLES
1.1 Brake Wear Particles
Brake dust is the best characterised component of non-exhaust emissions, but exhibits huge complexity,
creating problems for environmental measurements. This complexity arises in part from the use of three
major types of brake lining, referred to as non-asbestos organic, low metallic and semi-metallic (Sanders et
al., 2003), which are each favoured in different markets. Ceramic linings are also used on some of the more
expensive vehicles (Ostermeyer and Muller, 2008). Kim et al. (2020) show that the composition of the
friction materials can have an appreciable effect upon the rate of particle emissions. The lining itself
comprises four main components: binders, fibres, fillers and friction modifiers and more than 3000
materials are reportedly used across brands (Roubicek et al., 2008). This complexity is demonstrated by
data reported by Hulskotte et al. (2014) who collected 50 used brake pads and 15 discs removed from
7passenger cars in maintenance workshops. They found huge variations in the composition of brake linings,
with Fe and Cu as the most abundant metals, but in widely varying ratios. Overall, Fe, Cu, Zn and Sn
comprised 80-90% of the metallic content of the liners, but the remaining 10-20% contained a very wide
range of metallic components (Figure 3). A further 50% of the liner comprised non-metallic elements,
mostly carbon and sulphur. In comparison, the discs showed only minor variations in composition, being
comprised of >95% Fe, 2-3% Si, and no other metal comprising as much as 1% (Figure 4). Based upon
environmental data, Hulskotte et al. (2014) estimated that the total wear derived from the pads and discs
in a 30:70 ratio. While these data are likely to be representative of Europe, the composition of brake pads
used in other parts of the world may differ substantially. However, in a study of tunnels in the United
States, Lough et al. (2005) found elevated concentrations of Cu, Zn, Sb and Ba which they associated with
brake wear emissions, which is similar to findings in Europe. The presence of Cu is being phased out in
California due to concerns over aquatic toxicity.
Although Fe is the major component of brake wear particles, this element has many other sources in the
environment and except at roadside is not a reliable tracer of brake dust. On the other hand, some of the
less abundant components of brake wear, although present at much lower concentrations, have fewer
other significant sources and have been used either individually or in combination as brake wear tracers.
Those components are typically Cu, Ba and Sb, and are summarised in Table 1. Thus, for example, Gietl et
al. (2010) demonstrated that Fe, Cu, Ba and Sb had similar particle size distributions in roadside air and in a
nearby park, despite much reduced concentrations in the park (Figure 5), and recommended Ba as a
suitable atmospheric tracer. Cu could also be used as emissions inventories show that brake wear is a
dominant source of this element (AQEG, 2019). In order to use the tracer to estimate the concentration of
brake wear particles, its concentration in the emitted particles as well as in the atmosphere needs to be
known. Given the diversity in brake pad composition referred to above, chemical analysis of brake pads is
unlikely to represent the fleet average, and would not allow for any chemical fractionation during the
abrasion process. The approach of Gietl et al. (2010) was to estimate brake wear particle emissions using
emission factors from EMEP/CORINAIR and determine a ratio of elemental concentration to estimated total
8concentration, which may be a source of error if the emission factors are incorrect. Receptor modelling
studies using multivariate statistical methods such as Positive Matrix Factorization can identify emission
sources from their chemical profiles, but are typically unable to separate a brake wear factor, but report
brake wear within generic non-exhaust traffic, road dust or even road traffic factors. There has been far
less interest in the organic compound emissions from brakes, but Placha et al. (2017) identified more than
100 compounds, mostly oxidation products, but including the BTEX and PAH groups of compounds,
although the temperature used in the experiments (200oC) exceeded that in normal on-road braking.
Brake wear particles cover a wide range of sizes, and not all become airborne, with some remaining on the
vehicle and others falling on the road surface. According to Budai and Clement (2018), around 70% of
brake wear particles deposited to the road surface and not washed off the road are subsequently
resuspended after a rain event. Sanders et al. (2003) reported that 50% by mass becomes airborne, while
Klein et al. (2013) estimated 49% of particles to be in the PM10 size range, and hence liable to become
airborne with a significant atmospheric lifetime (minutes to days, dependent upon size). Studies with brake
dynamometers have shown 80-89% (Garg et al., 2000) and 80-91% of airborne particle mass to be within
the PM10 (Sanders et al., 2003) size range. The ratio of fine to coarse particles as reflected in the PM2.5:PM10
ratio appears to be quite variable. Klein et al. (2013) report 15% of emissions to be in the PM2.5 range,
while Garg et al. (2000) indicate 58-68% of airborne particles to be within this range. The results of Iijima et
al. (2008) imply 67% of PM10 to be in the fine particle range. Nielsen et al. (2003) measured emission
factors for a number of vehicle types finding no more than 3% of suspended particles larger than PM10, and
41% of PM10 as PM2.5. Such variability between studies can arise for a number of reasons including
different braking conditions, brake liner characteristics, and ventilation conditions during the sampling.
Brake wear particle size spectra
In dynamometer tests, Garg et al. (2000) found highly varied particle mass size spectra between the
different brake lining types that they tested. Sanders et al. (2003) suggest that this result may have been
influenced by particle losses in the sampling system. Sanders et al. (2003) found particle mass size spectra
with modes around 3 - 4 µm despite the use of different braking scenarios. Iijima et al. (2008) identified
9brake dust spectra with a mass concentration mode at 3 – 6 µm. Pun et al. (2006) provide brake pad wear
mass size spectra with a corrected modal diameter of 3.1 µm and assume a nominal density of 3 g cm-3 for
brake wear particles. On the other hand, Nosko et al. (2017) report brake wear particles to have an
effective density far lower than the bulk density of the constituent material and concluded that the
particles are porous.
Various brake pad and disc materials were tested by Wahlstrom et al. (2009; 2010) in a laboratory rig, who
found a mode in the mass distribution around 3 µm. Wahlin et al. (2006) found that particles created by
brake abrasion had aerodynamic diameters in the inhalable size range around 2.8 µm, and that this particle
diameter was a common mass median for a long list of heavy metals apportioned to the brakes source:
chromium, iron, copper, zinc, zirconium, molybdenum, tin, antimony, barium and lead. In a PMF study of
particle size spectra at a roadside site, Harrison et al. (2011) identified a source of airborne particles which
had a mode at 3 µm diameter and was associated with traffic influenced wind directions and heavy duty
vehicle numbers which they concluded was caused by brake wear. Similarly, analysing metals data from the
same site (Marylebone Road, London), Harrison et al. (2012) report a mass modal diameter of 3 µm for
barium, used as a tracer of brake wear, seen in Figure 6.
Sanders et al. (2003) in dynamometer and test track studies found brake wear to have a mode in the mass
spectra at 3-4 µm for all brake types, although there was considerable difference in total wear rates with
low metallic pads emitting 3-4 times the material of semi-metallic and non-asbestos organic (NAO) linings,
although with a consistent presence of iron, copper and barium. Lough et al. (2005) measured mass size
spectra of brake associated metals (Cu, Ba, Fe, Sb) with modes at 3-6 µm diameter. A dominant mass mode
of iron, copper, barium and antimony found at Marylebone Road was between 1.2 and 7.2 µm
aerodynamic diameter (Gietl et al., 2010). Iijima et al. (2009) identified a bimodal structure to the antimony
mass spectra with a mode at 3.6-5.2 µm being due to brake dust. The consequence of brake wear
particulate emissions having a mode in the mass size spectrum at a diameter close to 2.5 µm is that dividing
particulate mass into PM2.5 and coarse (PM2.5-10) fractions results in significant quantities of brake wear
10particulate matter being recorded in both fractions. Minor differences in experimental conditions can
therefore result in substantial differences in the PM2.5:PM2.5-10 ratio as seen above (Garg et al., 2000; Iijima
et al., 2008; Klein et al., 2013).
When particle number concentration spectra are measured, as opposed to the particle mass size spectra as
reported above, maximum concentrations will be seen at smaller, possibly sub-micrometre diameters.
Roubicek et al. (2008) examined the wear of brake parts and identified the emission of nanoparticles, and
associated brake wear, with the emission of CO2 from the brake pad. Wahlstrom et al. (2009, 2010) tested
various brake pad and disc materials finding similar spectra for the emitted particles with modes in the
number distribution around 350 nm and 550 nm. It is likely that the sub-micrometre particles arise from
vaporisation-condensation of metals, rather than abrasion. Recent research shows a need for a critical
temperature (160-190oC ) to be reached to create a large emission of nanoparticles (Mathissen et al., 2018;
Gonet and Maher, 2019), and this temperature is not normally achieved during on-road vehicle useage
(Farwick zum Hagen, 2019a,b). Such particles can be as small as 1.3-10nm diameter (Nosko et al., 2017).
Mathissen et al (2011) did not observe ultrafine particles under normal braking. Under extreme full stop
braking condition with visible smoke formation behind the tyre, Mathissen et al. (2011) identified a
unimodal particle number size distribution near the disc brake, with a maximum at 11 nm. Such small
particles would, however, have little mass associated.
Lough et al. (2005) noted a sub-micron mode in atmospheric measurements of copper, iron, lead and
calcium, while a secondary mass mode of copper and antimony was observed in roadside tests at a
diameter of 0.2 – 0.4 µm by Gietl et al., (2010). Iijima et al. (2008) identified a number concentration mode
at 0.8 µm in brake dust spectra, but Iijima et al. (2009) suggest that a mode in the antimony size spectrum
at 0.5 – 0.7 µm may have been due to fly ash from waste incineration.
11Atmospheric concentrations
Few studies have been successful in measuring airborne concentrations of brake wear particles alone,
although a number of receptor modelling studies have included them in generic categories such as non-
exhaust particles without the ability to disaggregate. Although Gietl et al. (2010) did not report a brake
dust concentration, it may be estimated from the data in their paper as 1.6 +/- 1.2 µg m-3 on Marylebone
Road and 0.4 +/- 0.2 µg m-3 in nearby Regent’s Park. This is consistent with a concentration of 0.8 µg m-3
reported for Copenhagen from a tracer study (Wahlin et al., 2006) and a working group estimate of 1-3 µg
m-3 of total wear emissions reported by Denier van der Gon et al. (2013). Modelled concentrations of a
similar magnitude are reported by AQEG (2019) for major roads in London.
Emission factors for particulate matter
The United Kingdom National Atmospheric Emissions Inventory lists PM10 brake wear emission factors
derived from the EMEP/EEA Emissions Inventory Guidebook for urban and rural roads and motorways.
These appear as Table 2, taken from Wakeling et al. (2017). These are derived using speed dependence
shown in Figure 7. It is important to recognise that these use average speeds, and hence the higher
emission at lower speeds reflects the frequent braking in slow urban driving conditions. In the UK
inventory, PM2.5 emissions are calculated from the PM10 data using a PM2.5:PM10 ratio of 0.4, which appears
broadly in line with the data reviewed above. Wakeling et al. (2017) present projections of UK and German
emissions to 2030, demonstrating the expected increase in all non-exhaust sources included in the
inventories (brake, tyre and road abrasion) while exhaust emissions decline. At the current time, non-
exhaust emissions well exceed exhaust emissions in most developed countries. Although it has been
suggested that adoption of battery-electric vehicles may lead to increased non-exhaust emissions due to
greater vehicle weight (Timmers and Achten, 2016), recent work by Beddows and Harrison (2020) indicates
this not to be the case, suggesting little overall change (see Section 1.6).
121.2 Tyre Wear Particles
In comparison to brake wear, there has been much less research on tyre wear particle emissions.
Particulate emissions occur at the contact point between the vehicle wheel and the road surface as a result
of abrasion damage to either the tyre or the surface. As a consequence, fragments of road surface material
may be embedded in tyre wear particles, forming Tyre Road Surface Wear Particles (TRWP), elaborated
upon later. Differing degrees of road surface roughness may affect the wear rate of tyres by a factor of two
to three (Kennedy et al., 2002). Large emissions may occur when the road surface is unpaved, or when
studded tyres are in use (Gustafsson et al., 2009). Within most developed countries, unpaved roads carry
only small amounts of traffic, and the use of studded tyres may not be permitted (Nicholls et al., 2006), but
in many countries one or the other factor may be an important consideration. In the USA, where
resuspension is a significant contributor to airborne particulate matter in the arid south-western states,
extensive emission factors have been derived over several decades for both unpaved and paved roads
(EPA, 2011b). More recently, work has been carried out in Scandinavia (Johansson et al. 2012; Denby et al.
2013) to predict the emissions from roads subject to damage from studded tyres and the addition of grit to
aid traction during winter.
Chemical composition of tyres
Vehicle tyre treads are predominantly organic matter (Kennedy et al., 2002) with 40 to 60 % of mass
comprising a blend of rubbers, along with naphthenic and aromatic extender oils that are added to tyres to
improve stress resistance, pigments, vulcanising agents and accelerators such as zinc, to speed up
vulcanisation (Boulter, 2005). Zinc may comprise up to 1% by weight of tyre tread material (Pant and
Harrison, 2013), resulting in zinc being the dominant metallic element in tyre tread, with the zinc content
being largely independent of tyre type (Weckwerth, 2001). Total emissions of zinc from tyres were
calculated to be around four times the mass of zinc emissions from brake linings in Stockholm
(Hjortenkrans et al., 2007). From analysis of 21 tyre samples, Klockner et al. (2019) found a mean zinc
concentration of 8.7 +/- 2.0 mg g-1 (8700 +/- 2000 ppm), and regarded Zn as the best elemental marker for
tyre wear. Similarly, Kreider et al. (2010) report a Zn concentration of 9000 ppm in tyre tread. From
13measurements of zinc concentrations on a road wear simulator, Gehrig et al. (2010) estimated that PM10
emissions from tyre wear were 0.8 mg veh-1 km-1 for LDVs and 17 mg veh-1 km-1 for HDVs. Dong et al.
(2017) measured the isotopic composition of zinc in PM10 in London, concluding a significant contribution
arose from tyre wear. Environmental concerns have resulted in research to find ways of reducing zinc
oxide content in tyres (Heideman et al., 2006), although the presence of zinc oxide improves the dissipation
of heat due to the deformation of the tyre while the vehicle is in motion and may improve abrasion
resistance (Moezzi et al., 2012).
Benzothiazole is used as a vulcanising agent in rubber production and together with its derivatives is
widespread in the environment (Liao et al., 2018). Zhang et al. (2018) measured benzothiazole and its
derivatives in debris from 17 major brands of tyres from 8 countries. Benzothiazole and 2-
hydroxybenzothiazole were found to be the dominant species within this class in both tyres and road dust
samples. Lin et al. (2010) reviewed the use of compounds in complex organic mixtures as tracers including
those in tyre dust. N-cyclohexyl-2-benzothiazolamine (NCBA) and 2-(4-morpholinyl) benzothiazole
(24MoBT) were used as markers for tyre tread wear by Allen et al. (2006) and by Kumata et al. (2002).
However, Unice et al. (2013) suggest that these tracers are not specific to tyre tread polymer and their use
may result in an overestimation of tyre wear particles in the environment, and that a better method is to
pyrolyse samples and to analyse for rubber polymers by GC/MS against polybutadiene, polystyrene and
polyisoprene standards as described by Unice et al. (2012).
Four dihydroresin acids (pimar-8-en-18-oic acid; isopimar-8-en-18-oic acid; 13α(H)-abiet-8-en-18-oic acid;
13β(H)-abiet-8-en-18-oic acid), which are not natural products but are chemically hydrogenated before
being added during the tyre manufacturing process, were identified by Nolte et al. (2002) as possible
markers to distinguish tyre debris from natural materials. Kumata et al. (2011) used these as molecular
markers for tyre-wear emissions, and concluded that tyre debris made up 0.68% of PM10 at a roadside site.
Similarly, Panko et al. (2013) used chemical markers for rubber polymer (Unice et al., 2012) in air quality
14samples obtained from France, USA and Japan and found a mean concentration of tyre and road surface
wear particles of 0.16 µg m-3 within the PM10 fraction, making up 0.84% of the PM10.
According to Valle et al. (2007) the naphthenic and aromatic extender oils that are added to tyres to
improve stress resistance, and contribute to tyre tread grip, wear, and endurance qualities, contain PAHs,
and tyre tread can contain 17 to 357 mg of PAHs for each kilogramme of tyre tread. Sadiktsis et al. (2012)
examined the high molecular weight PAH content of a number of types of tyre, and found a factor of 22.6
between the highest and lowest total concentrations of PAH, although the relative abundances of the 5
dominant PAHs (benzo[ghi]perylene, coronene, indeno[1,2,3-cd]pyrene, benzo[e]pyrene, and
benzo[a]pyrene), which made up around 92.3% of the total extractable content, were similar between
different types of tyre. Four carcinogenic dibenzopyrene isomers were identified, which made up less than
2% of the analysed high molecular weight PAHs. Only low concentrations of PAHs were found in tyre wear
particulate matter by Kreider et al. (2010) who question the suitability of PAHs as markers for tyre debris,
and suggest that in addition PAHs are not easily extracted from tyre wear particulate matter. Larnesjo
(1999) considered PAH concentrations to be too variable to be used as a marker for tyre emissions. Kumata
et al. (2011) demonstrated that tyre wear particles accounted for only a very small proportion of pyrene
and benzo[a}pyrene in roadside and rooftop air. From January 2010, the European Union has restricted the
permissible PAH content of tyres in Europe by statute (Directive 2005/69/EC) (EU, 2005), with a specific
requirement that benzo[a]pyrene (BaP) does not exceed 1 mg kg-1, and that the sum of benzo[a]pyrene
(BaP), benzo[e]pyrene (BeP), benzo[a]anthracene, chrysene (CHR), benzo[b]fluoranthrene (BbFA),
benzo[j]fluoranthrene (BjFA), benzo[k]fluoranthrene (BkFA) and dibenzo[a,h]anthracene (DBAhA) does not
exceed 10 mg kg-1.
The noise regulations introduced in recent years may have influenced the tread pattern and formulation of
tyre rubber. The impact upon generation of tyre dust and differences between summer and winter tyres
do not appear to have been studied in detail. Grigoratos et al. (2018) compared the wear properties of a
15number of tyre brands and tread patterns. They report that the tyre tread mass loss showed no significant
relationship to PM10, PM2.5 or particle number emissions.
Experimental rigs
Several different types of experimental rig have been used to study wear at the tyre-road surface contact
point (Zhang et al., 2020a). A laboratory rig designed to examine the emissions from studded winter tyres
running on an asphalt surface was used by Gustafsson et al. (2009) to examine the emissions from summer
tyres. Wear from summer tyres was found to be negligible in comparison to that from the winter tyres. This
rig had a tyre on a wheel (on a horizontal axis) running on a 3.8 metre diameter surface which turns about a
vertical axis. This arrangement will result in a difference in the relative speed of the tyre to the surface
across the width of the tyre, and is equivalent to cornering by a vehicle on a road.
Laboratory tests using a small car tyre running on a concrete drum rotating on parallel axes are described
by Aatmeeyata et al. (2009) and Aatmeeyata and Sharma (2010). These authors measured the emissions of
organic and elemental carbon, PAHs and mass from the predominately large (>10 µm) tyre wear particles,
finding 0.02% of the total mass to be within the PM10 fraction (equivalent to 6.4 mg tyre-1 km-1). The
concrete drum was constructed in a similar manner to that used to make concrete pipes. Their attempts to
construct an asphalt drum in a similar manner were unsuccessful.
Kreider et al. (2010) obtained tyre wear particulate matter for examination and chemical analysis using a
drum with an internal diameter of 3.8 metres where the tyre ran on a parallel axis on the internal drum
surface made up of 12 sections of asphalt concrete surface.
Association of tyre wear and road surface wear particles
Single particle analysis can reveal the composition and morphology of tyre dust particles. Studies by
Kreider et al. (2010) using electron microscopy and Panko et al. (2013) have shown that tyre dust collected
from on-road studies contain tyre rubber internally mixed with other constituents such as road surface
16wear or other traffic-related sources, leading to the concept of Tyre Road Wear Particles (TRWP). Similarly,
particles characterised individually by an Aerosol Time-of-Flight Mass Spectrometer (ATOFMS) also showed
an association of crustal elements with particles derived from tyre dust (Dall’Osto et al., 2014).
Airborne emissions size fractions
Only a fraction of the total material lost in tyre and road surface wear will become airborne. Tyre wear
particles are relatively large - microscopic examination of tyre debris has shown (Adachi and Tainosho,
2004; Kreider et al., 2010) the presence of elongated particles in excess of 100 µm in size, with metal and
mineral particles (presumably from road and brake dust) embedded within them.
Kennedy et al. (2002) estimated that 80% of tyre wear debris is deposited on the carriageway surface, with
only 20% becoming airborne (as TSP). Pischinger and Rauterberg-Wulff (1999) analysed PM10 and PM2.5
samples collected at a highway tunnel for elemental carbon and low volatility organic carbon - to
distinguish between diesel exhaust and tyre debris emissions. They only found tyre wear particles in the
coarse mode (PM2.5 – 10), where the emission rate was 6.1 ± 1.1 mg veh-1 km-1, while ten Broeke et al. (2008)
found 5% of tyre wear to be in the PM10 fraction.
Tyre wear and road abrasion emission rates in the various size fractions measured for cars, and estimated
for other vehicle types, given by Nielsen et al. (2003) indicate a much greater contribution of larger particle
sizes than for brake wear, with no road abrasion products expected in the PM2.5 fraction. The UK National
Atmospheric Emissions Inventory uses a PM2.5:PM10 ratio for tyre wear particles of 0.7, although many
other countries use a lower ratio (AQEG, 2019).
Particle size spectra
Dominant modal diameters in the mass size spectrum of tyre emission particles have been found at 2 µm
(Sjodin et al., 2010) and at 2 – 5 µm (with an average size of 3.8 µm) by Raisenen et al. (2003). Kupiainen
(2007) observed a mass size spectrum with mode at 5 – 8 µm when operating a friction tyre on the rig used
17by Gustafsson et al. (2009). Raisenen et al. (2003) found that the mass size spectrum was not dependent
on asphalt or aggregate mineralogy. In tests on a rig where tyre and road surface rotated on parallel axes,
and in on-road tests (where it was estimated that 15% of particulate matter was due to tyre wear as
opposed to resuspension), Kreider et al. (2010) found monomodal particulate volume concentration
spectra with modes at 50 µm to 100 µm, and bimodal particle number concentrations with modes at 25 µm
and 5 µm in the on-road data. They do not report the fraction of particles below 10 µm or 2.5 µm, but the
volume size spectra show it to be very small. Park et al. (2018) report studies on a tyre wear simulator
where a mass modal diameter of around 2 µm was observed, which broadened under harsh friction
conditions. The same team (Kim and Lee, 2018) found tyre wear modal diameters of 3 and 4 µm in
unimodal distributions. This is similar to the mode in Zn concentrations attributed primarily to tyre wear
measured on Marylebone Road, London by Harrison et al. (2012) and seen in Figure 6:.
In measurements of particle number concentration in the 6 – 562 nm size range near the contact point on
the road surface of a car travelling on a test track, Mathissen et al. (2011) identified a mode in the number
concentration spectra at 30 – 60 nm (mobility diameter) during high acceleration, braking and extreme
cornering, but not during normal driving. When smoke was visible behind the tyre during full lock braking
the modal diameter increased to 60 – 70 nm. Near the tyre contact point there was generally no
relationship between particle number concentration and speed. Other workers reporting an ultrafine mode
in the tyre wear size spectrum include Kwak et al. (2014), Kim and Lee (2018), Foitzik et al. (2018) and Park
et al. (2017). Dahl et al. (2006), measuring ultrafine particle number emissions of studded and winter tyres
on a laboratory rig, found that particle number emissions in the 15 – 700 nm size range increased with
vehicle speed, while the smallest particles are volatile. It seems probable that the nanoparticle fraction
arises from a vaporisation/ condensation pathway of oils used in the tyre, as opposed to the larger particles
which arise from abrasion (Kwak et al., 2014). This is consistent with the observations of Park et al. (2017)
who found a threshold tyre tread temperature of 160oC for generation of this mode, with increased
nanoparticle generation as temperatures increased. Such a temperature is likely to be reached only during
extreme acceleration, braking, or very hard cornering.
18Effects on tyre emissions of vehicle usage and driving behaviour
In studies of tyre tracer components in the exhaust air from a road tunnel, Allen et al. (2006) found that
there was a reduction by a factor of 1.4 to 2 (from 0.17 – 0.35 mg veh-1 km-1 to 0.12 – 0.17 mg veh-1 km-1
dependent upon the tracer used) in tyre wear emissions after the Portland cement concrete road surface in
the tunnel had been replaced by an asphalt rubber surface. They attributed the improvement to a
reduction in the roughness of the new surface causing less wear to tyres.
In work with a test rig where the summer tyre was effectively performing a turn, Sjodin et al. (2010) found
PM10 increased as speed increased, and as tyre temperature increased. In on-road tests Kwak et al. (2013)
observed an increase in the particle mass concentration spectra at particle diameters of 4 µm and above
when the vehicle was cornering.
The predicted emission rates for tyre abrasion (Table 2 and Figure 7, calculated from the typical road
speeds of different highway types given in the EMEP/EEA Emissions Inventory Guidebook (EEA, 2013), show
a reduction when moving from urban, to rural, to motorway locations, but at a lesser rate than for brake
emissions. This is associated with less acceleration and braking causing lower tyre wear in free moving
traffic.
Contribution of tyre wear particles to airborne concentrations
A table reproduced from the review by Grigoratos and Martini (2014) appears as Table 3 and shows the
contribution of tyre wear particles to PM mass as a percentage. For an urban PM10 concentration of 20 µg
m-3, these imply an airborne concentration of 1-2 µg m-3 with some studies showing markedly less. From
samples collected in Europe, the United States and Japan, Panko et al. (2013) estimate airborne
concentrations within PM10 of only 0.05 – 0.70 µg m-3. Although they did not report a tyre wear particle
concentration, a value of 0.5 +/- 0.1 µg m-3 for Marylebone Road, London may be estimated from the data
presented by Harrison et al. (2012).
191.3 Road Surface Wear Particles
This is the least well studied of the three abrasion sources of particles, despite according to the emissions
inventory being comparable in magnitude to the tyre and brake wear sources (see Table 2). As noted
above, road surface materials are incorporated in TRWP, and the relative quantities of purely road surface
abrasion particles and TRWP, in which they are in a tyre rubber matrix, is unclear. The UK National
Atmospheric Emissions Inventory uses a PM2.5:PM10 ratio for road abrasion of 0.54 (AQEG, 2019), while the
Danish inventory assumes zero particle mass in the fine fraction (Nielsen et al., 2003).
Gehrig et al. (2010) used mobile load simulators, where tyres were run linearly along specially prepared
asphalt concrete and porous asphalt surfaces, and state that emissions of PM10 due to road surface
abrasion was low and that, provided that the surface was in good condition, was in the range of a few mg
veh-1 km-1, if quantifiable at all. They considered that high particulate emissions at the start of the tests may
have been due to the resuspension of contaminants on the surface, although given the surfaces were newly
prepared, this may have been caused by the wear of additional binder on the new surface.
Composition – road surface
A range of different road surface types have been used in tyre and surface wear testing. These include:
Portland cement (Aatmeeyata and Sharma, 2010; Allen et al., 2006), asphalt concrete and porous asphalt
(Gehrig et al., 2010). Porous asphalt has a porosity of about 20% by volume compared to that of 5% for
asphalt concrete, the greater porosity being achieved with a lower quantity of small aggregate and sand
filler (Gehrig et al., 2010).
Portland cement highway road surfaces are not widely used but calcium may be expected to be present in
any abrasion products from such a surface. On an asphalt road surface, it is only when studded tyres are in
use that damage to the aggregate by grinding may occur (Kennedy et al., 2002). The bitumen binder of an
asphalt road surface generally contains only small amounts of individual PAHs compared to the crude oil
from which it is manufactured (Kennedy et al., 2002), although recycled tyre rubber has been used in some
asphalt mixes (Allen et al., 2006).
20Since road surface materials are of variable composition, and most of the major elements present (Ca, Si,
Al, C) are present in crustal materials, including soil, which comprise the major part of road surface dusts,
and C is a major component of vehicle exhaust emissions, there are no unique chemical tracers of road
surface abrasion particles, and these are not easily distinguished from road dust, some of which may derive
from road surface abrasion. Consequently, there are no measurements of airborne concentrations which
can be unequivocally attributed to road surface abrasion particles, although Amato et al. (2014a) quantify
the percentage contribution of a road wear category of particles to “road dust”.
1.4 Particle Resuspension Emissions
Particulate material that is resting on the road surface can be resuspended by vehicles moving over the
surface. Three processes may be involved: high speed airflows as air is expelled from the space in front of
the tyre as the tyre closes on the road surface and returns behind the rear of the tyre; turbulent eddies due
to the movement of the body of the vehicle through the air; and the adhesion of material from the road
surface to the tyre and its subsequent detachment. The latter process may involve material in liquid
droplets when the road is wet, with additional material being washed out of recesses in the road surface.
Some authors (e.g. Dall’Osto et al., 2013) identify a traffic vortex as being a major contributor to
resuspended dust. However, it has been found in California (Moosmuller et al., 1998) that PM10 dust
entrainment from an unpaved (and unvegetated) road shoulder under dry conditions by vehicle body
turbulence was almost exclusively limited to large vehicles moving in excess of 80 km hr-1, resulting in an
emission rate of 8 g veh-1 km-1 from this type of vehicle. Particulate matter may also accumulate on the
road surface despite the presence of passing vehicles. After applying tracer grit to the road surface, Patra et
al. (2008) observed an accumulation of material close to the kerb which was only resuspended by larger
vehicles where the tyres track closer to the kerb. Etyemezian et al. (2003b) observed dust and debris
tending to concentrate near kerbs and along centre dividers and suggest that when a vehicle accidentally
travels outside a lane some of the accumulating dust may be shifted back onto the road. Pirjola et al.
21(2010) noted a substantial difference between resuspension due to summer and winter tyres (both studded
and non-studded), the latter causing greater resuspension.
Since 1968 the US Environmental Protection Agency has published a document “Compilation of Air
Pollutant Emission Factors” (AP-42), which includes a section (13.2.1) on the emission of resuspended dust
from paved roads (EPA, 2011a). This contains an empirical equation to estimate the particulate emission
factor (E) of resuspended loose material from a surface of a dry paved road which, in its most recent
formulation (EPA, 2011b), takes the form;
E = k . (sL)0.91 . (W)1.02
where k is a factor dependent upon the particle size range (and units) of interest, sL is the silt loading per
unit area of road, and W is the average weight of vehicles on the road. Silt is defined as material less than
75 µm physical diameter, and the loading can be measured by sweeping and vacuuming a unit area of the
road, although in practice standard default values have been identified for four categories of road, which
are inversely related to the average daily traffic flow of each category (Cowherd, 2009a). An emission factor
may be calculated for a number (N) of days by multiplying the above equation by (1-P/4N), where P is the
number of days when precipitation exceeded 0.254 mm during those N days (EPA, 2011b).
The difficulties of predicting emissions of resuspended material by vehicles using the AP-42 method have
been considered by Venkatram (2000) and Nicholson (2001). They note that silt loading cannot be a stable
explanatory variable, because it has to be continuously reduced by moving vehicles (Venkatram, 2000), and
that unless the input of material to the carriageway surface is directly related to traffic density, then the
amount of resuspended material cannot be proportional to the vehicle distances travelled (Nicholson,
2001). It is notable that the AP42 formulation makes no allowance for vehicle speed. However, Amato et
al. (2017) found such a dependence with resuspension increasing with velocity to the power 1.5.
22The consequences of the difficulties in specifying resuspension emissions are illustrated by Claiborn et al.
(1995) who, when making measurements of PM10 alongside a tracer (SF6), found that the measured PM10
emission factor was 6.7 g veh-1 km-1 for a two lane road with less than 10000 vehicles per day
(approximately 80% higher than predicted by AP-42) while for a major highway (4 + lanes and over 10000
vehicles per day) the emission factor was 1.0 g veh-1 km-1 (approximately 40% less than predicted by AP-42).
This is consistent with the observation of Amato et al. (2013) that road dust loadings reduce with daily
traffic volumes. However, the benefits of including road dust resuspension in air quality modelling was
demonstrated by Pay et al. (2011) who included the resuspension of road dust in an air quality model in
Spain, achieving an improvement in PM10 predictions while reducing biases and errors by 15% to 18%.
A further complication is that emissions generated by brake wear, tyre wear and road surface attrition can
deposit upon the road surface, to be subsequently resuspended. This gives a problem of classification, as
they have both primary (component wear) and secondary (resuspension) sources.
Carriageway silt
Road dust samples taken from 28 Chinese roads by Chen et al. (2012) had an average dust loading 3.82 g m-2,
and when resuspended in the laboratory organic carbon (OC) comprised 11.5% and 12.5%, and elemental
carbon (EC) 2.0% and 2.1% respectively of the PM10 and PM2.5 fractions, while calcium, aluminium, iron and
magnesium formed between 1.4% and 8% of both fractions. Amato et al. (2009a) found resuspendable PM10
concentrations on the surfaces of inner city streets in Barcelona of 3 to 23 mg m-2, with the main components
having mean values of 1363 µg Ca m−2, 816 µg OC m−2, 239 µg EC m−2, 13 µg Cu m−2, 12 µg Zn m−2,
1.9 µg Sb m−2 and 2.0 µg Pb m−2. It is concluded by Kristensson et al. (2004) that emissions due to resuspension
of brake and tyre wear particles are about 100 times less than the soil part of the resuspension.
McDonald et al. (2013) have reported chemical analyses of both the PM2.5 and PM2.5-10 fractions of paved
road dust, which was collected in bulk and aerosolised before collection of the relevant size fractions. The
main constituents were crustal elements and organic carbon. The overall composition was similar to that
23of local soil, but with an increased proportion of organic matter and trace metals. Chemical signatures bore
more relation to region than site type.
Measurements of resuspension have been made by laying tracer material on the road surface and
measuring its removal (Nicholson et al., 1989; Patra et al., 2008). Road gritting salt was applied to a
carriageway in Central London to act as a tracer, and was rapidly moved along the road in the direction of
traffic flow (Patra et al., 2008). Coarse particles were resuspended more rapidly than fine ones, with build-
up near the kerb and the reservoir of fine particles apparently being controlled by grinding. Resuspension
accounted for 40% of the material removed from a road segment, and 70% of the material removed in
total.
The quantity of silt on the road surface may depend upon the local environment. Amato et al. (2012b)
observed that construction dust, urban unpaved parking areas and low-vegetated gardens are likely to be
responsible for an extra supply of mineral dust on urban roads in Spain. Winter maintenance can result in
additional material being added to the road surface. Zhu et al. (2009) found road dust emission rates were
five times higher in winter. Gertler et al. (2006) measured road surface emission factors by masts on either
side of the road over several days including a snow storm, and found that pre-storm application of NaCl
solution resulted in a 30% increase in both PM2.5 and PM10 when the solution dried, with further increases
(particularly in PM10) when an abrasive was added to the road surface to improve traction. An additional
increase in PM2.5 and PM10 was noted following wet brushing to remove the abrasive.
Increasing the texture depth of the road surface may reduce emissions caused by an applied airflow (China
and James, 2012). Langston et al. (2008) hypothesise the existence of a “differential silt mobilisation” and
that on busier roads, a greater proportion of the silt is located within recesses on the road surface, and is
therefore more difficult to suspend by traffic. They suggest that the standard method of sampling silt by
vacuum cleaner results in an aerodynamic shear one to three orders of magnitude greater than that
generated by traffic, resulting in higher estimations of silt loading on a road surface when localised
24sampling is carried out for an AP-42 assessment, than when a moving vehicle raises particulate matter.
Jonsson et al. (2008) describe an alternative (washing) system for sampling particulate matter on a road
surface.
Resuspension particle size spectra
The particle mass size spectra behind a tyre on a moving vehicle were found to have a mode at 3 – 5 µm
regardless of whether a standard (summer) or studded tyre was used (Hussein et al., 2008). Lee et al.
(2013) measured the particulate matter behind the tyre of a moving vehicle and found a number mode at
800 nm with concentration that did not vary with vehicle speed, while the mass mode at 2 – 3 µm saw a
slight increase in concentration with vehicle speed. A larger mass mode in the 6 – 10 µm diameter range
was found by Lough et al. (2005) for the geological elements magnesium and calcium. Harrison et al. (2011)
in a PMF study of particle spectra identified a factor with a mode at diameter >10 µm which occurred at
traffic influenced wind directions and during the morning rush hour when HDV flow was greatest. Using Si
as a tracer, Harrison et al. (2012) identified the contribution of resuspension emissions on Marylebone
Road, London, finding a mass modal diameter of around 5 µm, coarser than the brake or tyre wear,
extending to sizes beyond 10 µm, as seen in Figure 6.
Resuspension – measured by moving vehicles
Several systems of measuring resuspension by and from a moving vehicle have been reported. These
include the “TRACKER” and “SCAMPER” systems in the south western United States (Etyemezian et al.,
2003a; Fitz et al., 2005), the “SNIFFER” system in Finland (Pirjola et al., 2004), the “ΔDust” system in Korea
(Han and Jung, 2012) and a car - with an instrumented trailer with the exhaust of the towing vehicle ducted
to the rear - in Germany (Mathissen et al., 2012). Cowherd (2009a and b) has reported in a review
supporting the use of mobile monitoring technologies as an alternative to the use of standardised emission
factors for paved roads in predicting resuspension.
25Etyemezian et al. (2003b) found that the “emission potential” – a measure of the “dirtiness” of the road (a
linear function of the cubic root of the difference in PM10 behind the tyre to that in front of the vehicle,
divided by the vehicle speed) is lower on higher speed roads, and suggest that traffic volume has less
importance than traffic speed. Emission factors were less dependent on typical road speed, and high speed
roads contribute more to the overall PM10 than low speed roads. Etyemezian et al. (2003b) suggest that
while the residence time of dust on active travel lanes may only be in the order of a few hours, the debris
found near kerbs may form a reservoir of material for resuspension. The emission factor may vary
significantly depending on where the vehicle tyres are in a specific lane, but over a long route, movement
of the vehicle across traffic lanes may give a more representative measurement of resuspended PM 10 than
sampling small areas of road surface by vacuuming (Etyemezian et al., 2005).
Han and Jung (2012) used an instrumented vehicle to measure silt loading on representative paved roads
on seasonal, daily and three-hour time scales, and in relation to rainfall. The emission rates of mobile
(“SCAMPER” and “TRACKER”) systems and the AP 42 silt loading assessment were compared with emissions
measured by masts on either side of a test road on which silt had been laid, and found good agreement
with earlier data from Langston et al. (2008). The emission rates calculated by AP 42 were slightly less than
those obtained with the mobile systems. When “TRACKER” and AP 42 results were compared on a public
road it was found that the “TRACKER” calculated emission rate was much lower than that calculated by AP
42 which Langston et al. (2008) attributed to the “differential silt mobilisation” described above. Since AP
42 is an empirical formulation which has been updated more recently, this difference may need re-
evaluation.
Mathissen et al. (2012) measured particulate matter behind a light duty vehicle (where exhaust gases had
been ducted away) and found an emission factor for PM10 on paved roads of 26 mg veh-1 km-1, which they
noted as being large compared to the permissible exhaust emission factor of 4.5 mg veh-1 km-1 for EURO-5
vehicles. Emission factors were enhanced when the vehicle was braking or accelerating, with the lowest
emissions occurring on high speed motorways, and high emissions being associated with hot spots.
26In response to a consultation on the reformulation of the AP-42 equation for the emission factor of
resuspended material, it was acknowledged (EPA, 2011a) that the use of mobile monitoring to estimate silt
loading or the emission factor provides an advance in characterising system-wide emissions and the
variation between different roads, and provides significant improvements in the estimation of road dust
emissions by vehicle traffic.
Effects of road type, driving and weather conditions
Static assessments of resuspension emission rates confirm the importance of road type, traffic and driving
and weather conditions. Passive measurements of resuspended dust made beside a freeway allowed
Amato et al. (2012b) to derived emission factors for PM10 that were between 12 and 47 mg veh-1 km-1, The
authors note that these are generally lower that those measured for urban roads. In their PMF study of
traffic generated PM10 using calcium as a tracer of resuspended road dust, Bukowiecki et al. (2010)
identified 38% (LDV: 1 mg veh-1 km-1; HDV: 262 mg veh-1 km-1) and 56% (LDV: 28 mg veh-1 km-1; HDV: 160
mg veh-1 km-1) of PM10 to be resuspended road dust at street canyon and interurban freeway sites
respectively, which compares with 38.1 +/- 9.7% of the roadside coarse particle increment at Marylebone
Road (Harrison et al., 2012). They noted that road dust resuspension showed no linear relationship with
traffic counts, probably as a result of variability in the availability of road dust for resuspension. Ning et al.
(2008) found good agreement between emission factors obtained in roadside, chassis dynamometer and
tunnel studies for brake associated metals (Cu and Ba) but poor agreement for metals associated with both
traffic and non-traffic sources (Fe, Ca and Mg) which varied considerably between locations. Escrig et al.
(2011) found relatively high resuspension rates at 10 – 20 g veh-1 km-1 on a lightly trafficked road in an
industrial area and noted no change in resuspension over time after street cleaning. Zhu et al. (2009) found
that the emission rate reduced with average speed on the road, due to material being removed from the
road at a rate which increases exponentially with vehicle speed.
27You can also read