A combined cases simulation of environmental impacts of vehicle traffic noise and exhaust

Page created by Felix Gregory
 
CONTINUE READING
A combined cases simulation of environmental impacts of vehicle traffic noise and exhaust
A combined cases simulation of environmental impacts of
vehicle traffic noise and exhaust
Zhang Jiping1, Xu Mingzhu1, Wang Zheming1, Chen Fei2, Sun Jiarong1
1
  Zhejiang Research and Design Institute of Environmental Protection,
109 Tian Mu Shan Road, Hangzhou 310007, Zhejiang, China
2
  Zhejiang Communications Investment Group CO., LTD., Hangzhou 310000
Zhejiang, China

                                     ABSTRACT
The prediction, assessment, and control of the environmental impacts of an
ordinary motor traffic road are generally focused on a single factor, such as traffic
noise only, or vehicle exhaust separately. In contrast to the usual researches, we
use two case motor traffic roads information from the same terrain maps, as
inputs to proprietary software, to predict vehicle noise and exhaust. A combined
simulation is conducted for the environmental impacts of (1) traffic noise, using the
Cadna A software, combined with (2) vehicle exhaust, using Cadna A-APL. The
results are used in at least three applications to find the dominant impacts between
noise and the air pollution. Firstly, the quantified findings can be used for overall
management of the environmental impact of motor road traffic. Secondly, while an
accurate site measurement of the vehicle exhaust is difficult due to the influences of
meteorological conditions, a simulation has fewer such limitations. Thirdly, the
influences of sound barriers and buildings with sound-insulating function on the
exhaust diffusions can also be illustrated with Cadna-APL; sometimes, they are
important to prioritize the impact control policy between motor traffic road noise
and exhaust.

Keywords: Vehicle exhaust, traffic noise, Environmental impact assessment simulation,
Case study
I-INCE Classification of Subject Number: 60

1. INTRODUCTION

        Cadna A, an outdoor environmental noise calculation software developed by
DataKustic, Germany, has powerful graphic functions and high computational
efficiency. It is compatible with standards such as the ISO 9613, RLS-90, and Schall 03,
and it is recommended by the Environmental Engineering Assessment Center of the
China Environmental Protection Administration. Cadna A is suitable for the simulation
of a three-dimensional sound field, since it has high calculation accuracy with practical
parameter selection. It is well-recognized professionally in this field. The software has
also passed the inspections by the relevant agencies of the German Ministry of
_______________________________
1
  jpzhang_daniel92@163.com
2
  chenfei0129@163.com
Environmental Protection. It has been applied in the transportation sector in Germany
and many other countries, with good reviews.
        The atmospheric calculation module[1] of the Cadna A-APL software extends the
calculation, assessment, and protection objectives of noise prediction to atmospheric
pollution factors. It is compatible with the European Union Guidelines 1999/30/EC and
2000/69/EC. The simulation model is based on the AUSTAL2000 model developed by
the German Ministry of Environmental Protection. The main features include: it can
calculate the air pollution factors of road traffic; it can use the terrain model established
by noise prediction calculation to draw maps; and it can input annual and multi-year
meteorological statistical parameters to calculate the time emission process of pollutants
from point sources, line sources, and surface sources.
        Generally, the prediction, assessment, and control of traffic impacts are all
focused on noise factor or vehicle exhaust emission factor. In this research, we used
data from two motor vehicle roads in the same terrain map as inputs to the proprietary
software, to predict vehicle noise and exhaust emissions. In addition, the Cadna A
model was used to determine different types of impacts on different types of roads, and
to provide knowledge for environmental impact management of road traffic. In general,
environmental monitoring is restricted by complex meteorological conditions and non-
accurate field monitoring results. The simulation method can overcome these limitations,
and it can demonstrate the influence of acoustic facilities such as a noise barrier on the
flow of vehicle exhaust emissions.

2. KEY POINTS OF SELECTION AND ASSESSMENT FOR CASE ROADS

        An expressway (Case E) and an urban arterial road (Case U) were selected for
this research. Engineering parameters such as traffic volume and average speed are
shown in Table 1. The layout of the road dimensions is shown in Figure 1. For E, the
diffusion of vehicle exhaust emissions under the wind field parallel and perpendicular to
the roads, and with and without sound barrier, was assessed together with noise
attenuation. The assessment was similar for U, except that the presence of buildings on
the roadside was considered as an assessment factor. For the noise impact prediction
and its results can refer to Reference [2].

                             Table 1 - Simulation schedules*
          Case No.                 Expressway (E)                Urban Arterial road (U)
    Engineering prototype     Ordinary trans-provincial
                                                                       Ring road
         parameters                 expressway
      Number of lanes                       6                              8
        Design ages                 Year 2008~2030                  Year 2006~2021
     Design speed, km/h                    120                            80
           Annual             38374pcu/d、25081v/h
                                                          Day time:1654 v/h (90%P+10%(H+M))
           average               (67%P+24%M+9%H),
                                                          Night time: 584 v/h (80%P+10%(M+H))
       traffic volume          Ratio of day & night=85%
                                                             80/(2×16)motor vehicle lanes
        Road width, m                     35
                                                                +42 non-motorized parts
     Subgrade height, m                    4                              0
    Background noise level
                                     49.0/43.4                         49.2/42.5
       Lday/Lnight dBA
        Cross section               Figure 1- E                       Figure 1- U
   * P: Automobiles;
     M: Middle vehicles;
     H: Heavy trunks.
E

              80.0 m = 5.0 m (sidewalk) + 6.0 m (non-motorized vehicle lane) + 8.0 m (green belt) + 16.0 m (motor
     U        vehicle lane) + 10.0 m (central reservation) + 16.0 m (motor vehicle lane) + 8.0 m (green belt) + 6.0 m
                                             (non-motor vehicle lane) + 5.0 (sidewalk)

                                   Fig. 1 - Cross section of the road layouts

2.1 Assessment Metrics and Criteria

       The Grade II criteria of the Chinese Ambient Air Quality Standard (GB 3095-
2012) was utilized in this research. The assessment metrics and criteria are shown in
Table 2.
                      Table 2 - Environmental air quality standards
                                            Annual average                   Daily average             Hourly average
Assessment metric      Unit g/km
                                             concentration                   concentration             concentration
       NOx              μ   g/m³                  50                              100                       250
       Pm10             μ   g/m³                  70                              150                        -
       NO2              μ   g/m³                  40                               80                       200
       SO2              μ   g/m³                  60                              150                       500

2.2 Source strength determination

        The engineering parameters and terrain information were input into the software
to calculate the exhaust emissions strength of the vehicles on the researched road. See
Table 3.

                                    Table 3 - Sources emission estimating
                                    Expressway Example                           Urban Arterial Road Example
Assessment
               Unit     Average vehicle          Average vehicle        Average hourly vehicle     Average hourly vehicle
  metric
                        flow at daytime         flow at nighttime        flowrate at daytime        flowrate at nighttime
  NOx          g/km         1349.7                    475.9                   416.7×2                     147.2×2
  Pm10         g/km          72.5                      25.6                              Excluded from
  NO2          g/km          67.5                      23.8                               word count of
  SO2          g/km          1.64                      0.58                                this paper.

2.3 Calculation Scheme

           See Table 4.

                                        Table 4 - Simulation schedules
                                              See Reference 1 for the studied road
                        (Note: Based on annual average, conservative consideration of busier traffic values)
Assessment       West wind 3m/s         West wind 6m/s      West wind 3m/s          West wind 3m/s      West wind 6m/s
  factor        + South wind 3m/s      + South wind 6m/s   + South wind 3m/s       + south wind 3m/s   + South wind 6m/s
                  + Noise barrier        + Noise barrier     + Noise barrier          + buildings        + Noise barrier
                   + No barrier           + No barrier        + No barrier           + no buildings       + No barrier
    NOx                 E               Excluded from               U                      E            Excluded from
    Pm10                E                word count                 U              Excluded from         word count
    NO2                 E                      of                   U                word count                of
    SO2                 E                 this paper.               U               of this paper.        this paper.
3. SIMULATION OF NOISE AND EXHAUST EMISSIONS WITH AND
WITHOUT NOISE INSULATION

       The E simulation results are shown in Table 5, and the U simulation results in
Table 6. The atmospheric concentration and noise range of the color bars from Table 5
and 6 are shown in Table 7.

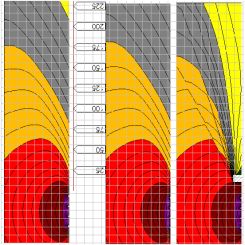
             Table 7 - Numerical values of the color bars from Table 5 & 6
                       Contour belt     Noise             Air contour line
                                          >   35.0   dB
                                          >   40.0   dB
                         Legend:          >   45.0   dB
                                          >   50.0   dB
                                          >   55.0   dB
                        Color bar         >   60.0   dB
                                          >   65.0   dB
                         Value            >   70.0   dB
                         Range            >   75.0   dB
                                          >   80.0   dB
                                          >   85.0   dB

4.  COMBINED ASSESSMENT OF ENVIRONMENTAL IMPACTS OF
VEHICLE TRAFFIC NOISE AND EXHAUST EMISSIONS

4.1 Combined assessment of the roadside air and sound quality under 3m/s of wind
field parallel + perpendicular to the direction of the E expressway

        See Table 5:
        (1) NOx
        ① When the wind field is parallel to the road, NOx emissions meet the roadside
air quality standards. Also, when the wind field is perpendicular to the road, NOx
emissions meet the roadside air quality standard. However, because of the south wind, it
was not possible to measure the NOx concentration on the south side of the road.
        ② The presence of a barrier resulted in a higher NOx concentration at the
roadside, but the gas diffuses well at a distance. When there is no barrier, the gas
diffusion contributes to lower concentration at the roadside, but the concentration is
relatively high at a distance.
        ③ The distance at which the sound reached the standard limit to describe the noise
impact was 348 m/385 m (Lday/Lnight background 43.4 dBA). The noise impact range is
greater than the air impact’ s, which is consistent with the general perception.
        ④ Compared with the above average noise assessment, more attention should
be paid to the impact of maximum concentration on the air quality assessment. Due to
the limitations of the article length, details are not described in this paper.
        (2) PM10, NO2, SO2
        The trends for PM10 and NO2 are the same as the above NOx, but their
concentrations are lower. In special, the concentration of SO2 is very low, there is only a
very low concentration on the roadside, and it is not detected at a distance.

4.2 Combined assessment of the roadside air and sound quality under 3m/s of wind
field parallel + perpendicular to the direction of the U urban arterial road

       See Table 6:
       (1) NOx
       ① When the wind field is parallel to the road, NOx emissions meet the roadside
air quality standards. Also, when the wind field is perpendicular to the road, NOx
emissions meet the roadside air quality standard. However, because of the south wind, it
was not possible to measure the NOx concentration on the south side of the road.
        ② The presence of a building nearby the road leads to a higher NOx
concentration at the roadside, but the gas diffuses well at a distance. When there is no
building, the gas diffusion contributes to lower concentration at the roadside, but the
concentration is relatively high at a distance.
        ③ The distance at which the sound reached the standard limit to describe the
noise impact was 222 m/254 m (Lday/Lnight background 42.5 dBA). The noise impact
range is greater than the air impact’ s, which is consistent with the general perception.
However, when there are buildings on the roadside, the noise impact distance or range is
reduced to 30 m, which is within the first row of the buildings. The noise blockage
effect of buildings is significant.
        ④ Compared with the above average noise assessment, more attention should
be paid to the impact of maximum concentration on the air quality assessment. Due to
the limitation of the article length, details are not described in this paper.
        (2) PM10, NO2, SO2
        The trends for PM10 and NO2 are the same as the above NOx, but their
concentrations are lower. In special, the concentration of SO2 is very low, there is only a
very low concentration on the roadside, and it is not detected at a distance.

5. CONCLUSIONS AND DISCUSSION

        The atmospheric calculation module-APL together with Cadna A software
provided a combined assessment of the environmental air and noise impacts on the case
roads. It demonstrates the function of impact prediction. In addition to that, it can be
applied to the research and application of environmental impact assessment and
planning due to its three-dimensional and dynamic simulation effect.

6. ACKNOWLEDGEMENTS

       The authors acknowledge gratefully the support as a research program titled An
applied basic research integration innovation for the urban and village living sound
environment protection in Zhejiang (No.YX040419001) from Zhejiang Research and
Design Institute of Environmental Protection in China. This paper just reflects the
academically opinions of the authors but should not be considered as any official
statements of the positions of their employers.

7. REFERENCES

       1. Calculation of Air Pollutants, Manual for CadnaA-Option APL, 2nd Aug,
       (2010).

       2. J. Zhang, M. Buret, S. Wu, et al., Buffer distances for surface roads and
       elevated highways correlated with pre-existing ambient noise, the 43th
       International Congress and Exposition on Noise Control Engineering, November
       16-19, 2014 in Melbourne, Proceedings of Internoise-2014, D8b Session of
       Motor vehicle noise - policy and regulation: paper IDNo.812, (2014).
Table 5 - In both conditions of wind directions parallel + perpendicular to the H expressway, the roadside air quality of a case expressway is assessed with an exhaust diffusion map combined with the traffic noise map
                              Presence of a noise barrier (3.5 m high) on the side of the highway                         No sound barrier on the side of the highway
              Assess-   Vertical contour line of road cross-         Plane contour line of air quality at   Vertical contour line of road cross-      Plane contour line of air
Wind           ment     section noise (determined by nighttime       1.5 m hight                            section noise (determined by              quality at 1.5 m hight                                  Trend Assessment
              Metric    average traffic flow, 10 m × 10 m grid, 1    (determined by average traffic         nighttime average traffic flow, 10 m × (determined by average
                        dBA contour interval)                        flow during daytime)                   10 m grid, 1 dBA contour interval)        traffic flow during daytime)
                                                                                                                                                                                                 NOx:
                                                                                                                                                                                                 1.When the wind field is parallel to the road,
                                                                                                                                                                                              NOx emissions meet the roadside air quality
                                                                                                                                                                                              standards.
  3m/s West

                                                                                     0.0                                                                           0.0
                                                                                                                                                                                                 2. The presence of a barrier resulted in a higher
                                                                                                                                                                                              vehicle exhaust gas concentration at the roadside,
               NOx                                                                         0.2                                                                       1.5
                                                                                                                                                                                              but the gas diffuses well at a distance. When there
                                                                                            3.7                                                                          3.6
                                                                                                                                                                                11.4
                                                                                                                                                                                              is no barrier, the gas diffusion contributes to lower
                                                                                                   11.6
                                                                                                                                                                                              concentration at the roadside, but the
                                                                                                                                                                                              concentration is relatively high at a distance.
                                                                                                                                                                                                 3. The distance at which the sound reached the
                                                                                                                                                                                              standard limit to describe the noise impact was
                                                                                                                                                                                              348 m/385 m (Lday/Lnight background 43.4 dBA).
                                                                                                                                                                                              The noise impact range is greater than the air
                                                                                                                                                                                              impact’ s, which is consistent with the general
                                                                                                                                                                                              perception.
                                                                                                                                                                                                 4. Compared with the average noise
                                                                                                                                                                                              assessment, more attention should be paid to the
  3m/s West

                                                                                    0.0                                                                                  0.0
                                                                                                                                                                                              impact of maximum concentration on the air
               PM10                                                                                                                                                                           quality assessment. Due to the limitations of the
                                                                                      0.0
                                                                                           0.1
                                                                                                                                                                           0.0
                                                                                                                                                                               0.2
                                                                                                                                                                                              article length, details are not described in this
                                                                                                  0.5                                                                                  0.9    paper.

                                                                                                                                                                                               PM10:
                                                                                                                                                                                               The trend of PM10 is the same as the above
                                                                                                                                                                                              NOx, but its concentration is lower.
  3m/s West

                                                                                     0.0                                                                                 0.0                    The trend of NO2 is the same as the above NOx,
               NO2                                                                                                                                                                            but its concentrations is lower.
                                                                                          0.0                                                                              0.1
                                                                                           0.2                                                                                  0.3
                                                                                                   0.4                                                                                 0.9
  3m/s West

                                                                                     0.0                                                                                  0.0
                                                                                                                                                                                                  The concentration of SO2 is very low, there is
                                                                                                                                                                                              only a very low concentration on the roadside, and
               SO2                                                                        0.0                                                                                  0.0            it is not detected at a distance.
                                                                                            0.0                                                                                 0.0
                                                                                                   0.0                                                                                  0.0
Presence of a noise barrier (3.5 m high) on the side of the highway                                No sound barrier on the side of the highway
                Assess-   Vertical contour line of road cross-         Plane contour line of air quality at          Vertical contour line of road cross-      Plane contour line of air
Wind             ment     section noise (determined by nighttime       1.5 m hight                                   section noise (determined by              quality at 1.5 m hight                                     Trend Assessment
                Metric    average traffic flow, 10 m × 10 m grid, 1    (determined by average traffic                nighttime average traffic flow, 10 m × (determined by average
                          dBA contour interval)                        flow during daytime)                          10 m grid, 1 dBA contour interval)        traffic flow during daytime)
                                                                                                                                                                                                             NOx:1. When the wind field is perpendicular to
                                                                                                                                                                                                          the road, NOx emissions meet the roadside air
                                                                                                                                                                                                          quality standard.
                                                                                                                                                                                                             2. Because of the south wind, the concentration
 3m/s South

                                                                                                  0.0
                                                                                                                                                                              8.0
                                                                                                                                                                                                          on the south side of the road was not measured.
                                                                                                                                                                                                             3. The presence of a barrier resulted in a higher
                 NOx                                                                                                                                                               7.5                    vehicle exhaust gas concentration at the roadside,
                                                                                                    0.2
                                                                                                                                                                                    12.8
                                                                                                        3.7
                                                                                                              11.6
                                                                                                                                                                                          27.0            but the gas diffuses well at a distance. When there
                                                                                                                                                                                                          is no barrier, the gas diffusion contributes to lower
                                                                                                                                                                                                          concentration at the roadside, but the
                                                                                                                                                                                                          concentration is relatively high at a distance.
                                                                                                                                                                                                             4. The distance at which the sound reached the
                                                                                                                                                                                                          standard limit to describe the noise impact was
                                                                                                                                                                                                          348 m/385 m (Lday/Lnight background 43.4 dBA).
                                                                                                                                                                                                          The noise impact range is greater than the air
                                                                                                                                                                                                          impact’ s, which is consistent with general
                                                                                                                                                                                                          perception.
 3m/s South

                                                                                       0.0                                                                                              0.4
                                                                                                                                                                                                             5. Compared with the average noise
                 PM10                                                                                                                                                                                     assessment, more attention should be paid to the
                                                                                            0.0                                                                                           0.3
                                                                                              0.1                                                                                             0.6
                                                                                                                                                                                                          impact of maximum concentration to assess the
                                                                                                    0.5                                                                                             1.3   air quality. Due to the limitation of the article
                                                                                                                                                                                                          length, details are not described in this paper.

                                                                                                                                                                                                            PM10:The trend of PM10 is the same as the
                                                                                                                                                                                                          above NOx, but its concentration is lower.
   3m/s South

                                                                                                                                                                                    0.6
                                                                                            0.3

                                                                                                                                                                                                            The trend of NO2 is the same as the above NOx,
                 NO2                                                                          0.5
                                                                                                                                                                                        0.5
                                                                                                                                                                                                          but its concentration is lower.
                                                                                                                                                                                          0.8
                                                                                                  0.6
                                                                                                                                                                                                1.5
                                                                                                        1.3
   3m/s South

                                                                                                                                                                            0.0
                                                                                      0.0
                                                                                                                                                                                                              The concentration of SO2 is very low, there is
                  SO2                                                                   0.0
                                                                                                                                                                              0.0                         only a very low concentration on the roadside, and
                                                                                            0.0
                                                                                                                                                                                  0.0
                                                                                                                                                                                        0.0               it is not detected at a distance.
                                                                                                  0.0
Table 6 - In the both conditions of wind directions parallel + perpendicular to the U road, roadside air quality of a case urban arterial road is assessed with the exhaust diffusion map combined with the traffic noise map
                                  Presence of building on the road side along the main road in the urban
                                                                                                                 No building on the road side along the main road in the urban center                     Trend Assessment
                                                    center (the building height is 3.5 m)
                     Assess-                                                                                                                                                                  1. When the wind field is parallel to the road,
  Wind                ment     Vertical contour line of road cross-                                            Vertical contour line of road cross-    Plane contour line of air quality
                                                                           Plane contour line of air quality                                                                               NOx emissions meet the roadside air quality
                     Metric    section noise (determined by nighttime                                          section noise (determined by            at 1.5 m (determined by
                                                                           at 1.5 m (determined by average                                                                                 standards.
                               average traffic flow, 10 m × 10 m grid,                                         nighttime average traffic flow, 10 m    average traffic flow during
                                                                           traffic flow during daytime)                                                                                       2. The presence of a building nearby the road
                               1 dBA contour interval)                                                         × 10 m grid, 1 dBA contour interval)    daytime)                            leads to a higher pollutant concentration at the
                                                                                                                                                                                           roadside, but the gas diffuses well at a distance.
                                                                                                                                                                                           When there is no building, the gas diffusion
                                                                                                                                                                                           contributes to lower concentration at the
                                                                                                                                                                                           roadside, but the concentration is relatively high
                                                                                                                                                                                           at a distance.
                                                                                      0.0                                                                        0.0                          3. The distance at which the sound reached
                                                                                                                                                                                           the standard limit to describe the noise impact
    3m/s West

                                                                                                                                                                                           222 m/254 m (Lday/Lnight background 42.5
                       NOx                                                                 0.3                                                                     1.1
                                                                                                                                                                                           dBA). The noise impact range is greater than
                                                                                                                                                                                           the air impact’ s, , which is consistent with the
                                                                                      23.3                                                                       23.8                      general perception. However, when there are
                                                                                                                                                                                           buildings on the roadside, the noise impact
                                                                                                                                                                                           range is reduced to 30 m, which is within the
                                                                                                                                                                                           first row of buildings.
                                                                                                                                                                                              4. Compared to the average noise assessment,
                                                                                                                                                                                           more attention should be paid to the impact of
                                                                                                                                                                                           maximum concentration to assess the air
                                                                                                                                                                                           quality. Due to the limitation of the article
                                                                                                                                                                                           length, details are not described in this paper.
                                                                                                                                                                                              1. When the wind field is perpendicular to the
                                                                                                                                                                                           road, NOx emissions meet the roadside air
                                                                                                                                                                                           quality standard.
                                                                                                                                                                                              2. Because of the south wind, the
                                                                                     3.7                                                                         6.5                       concentration on the south side of the road is
                                                                                                                                                                                           not detected.
     3m/s South

                       NOx                                                                                                                                                                    3. To compare the effect of buildings, the
                                                                                      6.3                                                                         12.1                     presence of a building makes the vehicles
                                                                                                                                                                                           exhaust higher concentration of gas at the
                                                                                     34.8                                                                        27.2
                                                                                                                                                                                           roadside, but the gas diffuses well at a distance;
                                                                                                                                                                                           when there is no building, it is favorable for gas
                                                                                                                                                                                           diffusion, but the concentration is relatively
                                                                                                                                                                                           high at a distance
                                                                                                                                                                                              4. The distance at which the sound reached
                                                                                                                                                                                           the standard limit to describe the noise impact is
                                                                                                                                                                                           222 m/254 m (Lday/Lnight background 42.5
                                                  >   35.0   dB                                                                 >   35.0   dB
                                                  >   40.0   dB                                                                 >   40.0   dB
                                                                                                                                                                                           dBA). The noise impact range is greater than
                                                  >   45.0   dB                                                                 >   45.0   dB                                              the air impact’ s, which is consistent with
                                                  >   50.0   dB                                                                 >   50.0   dB                                              general perception. However, when there are
                                                  >   55.0   dB                                                                 >   55.0   dB                                              buildings on the roadside, the noise impact
                                                  >   60.0   dB                                                                 >   60.0   dB                                              range is reduced to 30 m, which is within the
                  Legend                          >   65.0   dB                                                                 >   65.0   dB
                                                                                                                                                                                           first row of buildings.
                                                  >   70.0   dB                                                                 >   70.0   dB
                                                  >   75.0   dB                                                                 >   75.0   dB                                                 5. Compared to the average noise assessment,
                                                  >   80.0   dB                                                                 >   80.0   dB                                              more attention should be paid to the impact of
                                                  >   85.0   dB                                                                 >   85.0   dB                                              maximum concentration on the air quality
                                                                                                                                                                                           assessment. Due to the limitation of the article
                                                                                                                                                                                           length, details are not described in this paper.
You can also read