The Visual Experience of Fine Art Under Low Illuminance
←
→
Page content transcription
If your browser does not render page correctly, please read the page content below
The Visual Experience of Fine Art
                          Under Low Illuminance

                           Jeffrey J. Mundinger, Penn State University
                             Kevin W. Houser, Oregon State University

Author Contributions
Concept:     KH            Data Collection: JM
Methodology: KH, JM        Original Draft:   JM
Apparatus:   JM            Review & Editing: KH, JM

Study Artwork
The heart of the experiment are the paintings upon
which we paint our light. Artist James Whitbeck (top)
adheres strictly to the traditional methods of 1600’s
Dutch baroque painter Johannes Vermeer. Artist Jim
Mundinger (bottom) created saturated acrylic and
watercolor paintings according to experimental
specification. Together they set the field of color for
participants to carefully consider.
Background

• Museum conservation guidelines
  restrict illuminance for sensitive
  artwork to levels that can cause color to
  be perceived as less saturated, a
  phenomenon known as the Hunt Effect.
  [IES 2017, Hunt 1952].

• For a dramatic though imperfect
  demonstration of the Hunt Effect,
  decrease your screen brightness while
  viewing the chromaticity plot at right.
  While an accurate replication of the
  Hunt Effect requires visual adaptation,
  the demonstration illustrates the
  desaturation of colors with decreasing
  illuminance.                                 Binocular Match Gamuts at Various Luminance Levels [Hunt 1952]
                                               Binocular matches are reproduced above for the first 6 adapting luminance levels (LA) and the 5 test colors (violet, blue, green,
                                               yellow and magenta) that were replicated across both observers. Results of each match are averaged across the two observers to
• The chromaticity plot at right illustrates   simplify the plot. Grayscale pentagons represent the gamuts bounded by the averaged matches made at each included LA. Each
  that Hunt Effect desaturation is             series of matches begins with LA = 100 cd/ft2 (white gamut line) and ends with LA = 0.007 cd/ft2 (black gamut line). The white
  similar to reducing gamut.                   markers in each series denotes the match made at the LA = 0.75 cd/ft2, which was also the luminance of the matching field. The red X
                                               represents the chromaticity of standard illuminant B, which provided the LA for both the matching and test color fields [Hunt 1952].
                                               Line and marker colors represent but are not meant to accurately portray the test colors. The spectrum locus, blackbody locus, and
                                               purple line are marked with black lines. Reference wavelengths are denoted by grey makers along the spectrum locus.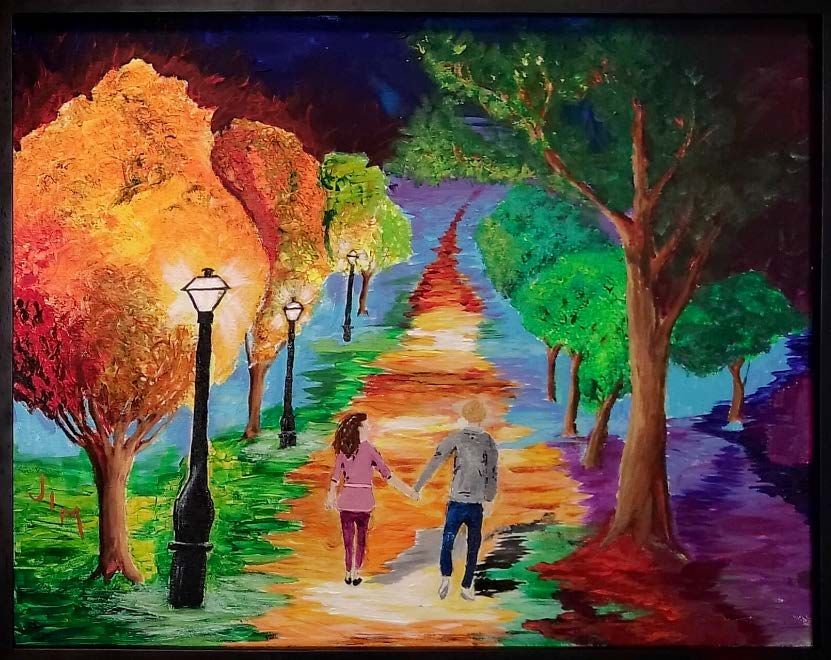
Project Objectives                                                                                              Experimental Chamber
                                                                                                                          The experiment was set in a mock art gallery. The LEDCube-11
                                                                                                                          near the top of the image is shown illuminating the gamut-
• Previous IES TM-30 research has                                                                                         illuminance study paintings.    A Konica-Minolta CL-500A
  identified red saturating gamuts that                                                                                   spectrophotometer is mounted between the paintings.
  consistently increase perceived
  saturation and personal preference.
  [Esposito 2016, Royer 2018, Bao and Wei 2019]

• The shape and size of experimental
  gamuts were constrained such that
  their TM-30 gamut scores were used
  as unique identifiers (Rg∗ ), over a range
  of 96 ≤ Rg∗ ≤ 124.

• The primary objective was evaluating
  the red saturating gamut’s ability to
  compensate for the Hunt Effect in an
  art gallery setting.
                                                  Experimental Gamut Family
                                                  The experimental red saturating gamut family is illustrated by a
• Spectral optimization and live spectral         simplified TM-30 Color Vector Graphic (CVG). The CVG includes 11
  feedback controlled gamut shape,                gamuts within the family across a range of 105 <   Rg∗ < 125. Similar
                                                  results can be produced by LED arrays with as      few as five color
  chromaticity, and illuminance to more
                                                  channels.
  than an order of magnitude below the
  just noticeable difference.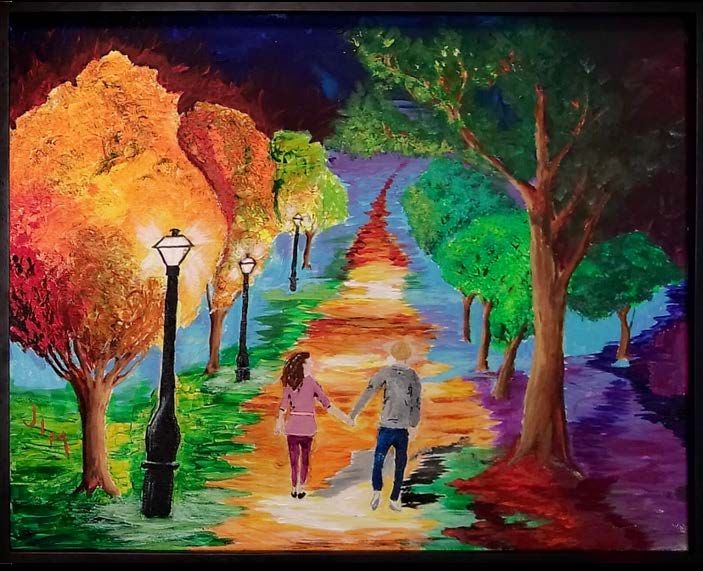
Experimental Methods                           Gamut-Tint Study                    Gamut-Illuminance Study

• A pair of studies was conducted in
  series. Elements common to both
  studies are presented along the center
  line that divides the distinct elements.

• The Gamut-Tint Study investigated the
  interaction between Rg∗ and tint (Duv)
  at a conservation light level of 50 lux.

• The Gamut-Illuminance study
  investigated the Hunt Effect via the
  interaction between Rg∗ and average
  painting illuminance (Log Lux).            -0.0211 < Duv < 0.0036    96 < Rg∗ < 124        25 lux < Log Lux < 100 lux

• Paintings were evaluated in pairs
  under the various lighting conditions
                                                 3000 K, 50 lux                                 3000 K, -0.0075 Duv
  along 6-point semantic scales
  corresponding to preference,
  saturation, and naturalness.                                          Preference
                                                     31 naïve                                      36 naïve
                                                                        Saturation
                                                    participants                                  participants
                                                                        Naturalness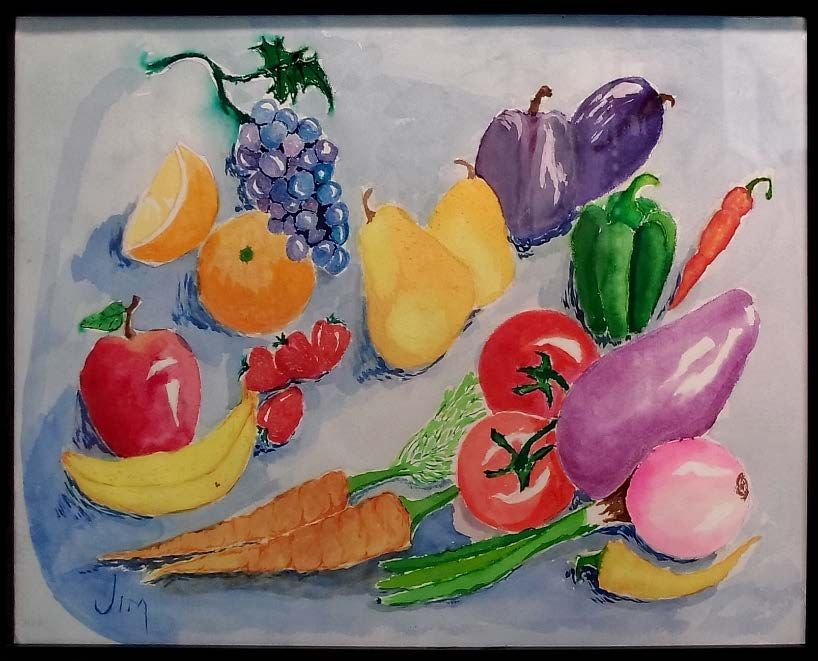
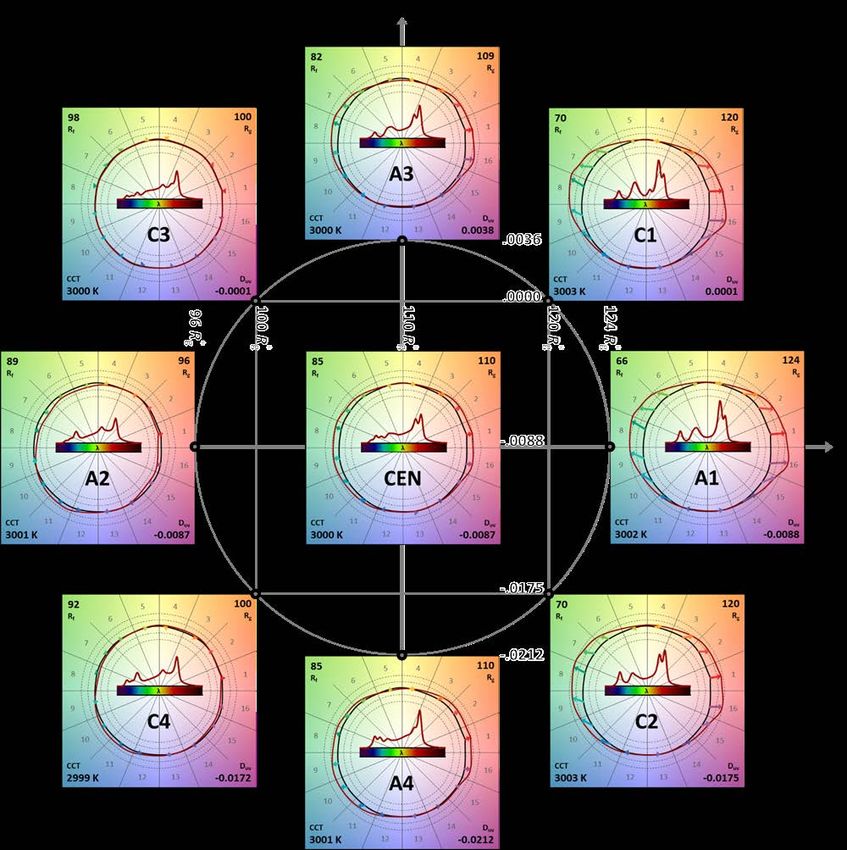
Gamut-Tint                               Experimental Search Space
                                                                                                        Gamut-Illuminance
  Study                                  Lighting conditions are presented as                                Study
                                         TM-30-15 CVGs with associated SPDs
                                         superimposed     in   the    center.
                                         Chromaticity and TM-30 Rf and Rg are
                                         provided on each CVG. The geometric
                                         RSM relationship is shown behind the
                                         CVGs with target Rg∗ and Duv values
                                         provided for reference.

                      • Rg∗ , Duv and Log Lux were systematically varied according to response surface methodology (RSM),
       Experimental
                       designed to map 2nd order terms and interactions
         Methods      • Each participant evaluated a pair of paintings under nine independently presented lighting conditions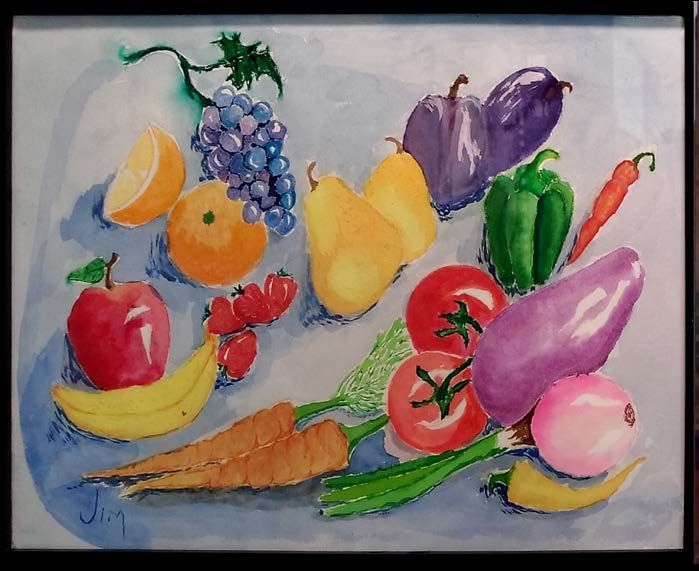
Hypotheses
                               A. Participants will have preferred levels for Duv and R∗g

                                                                                            Gamut-Tint Study
• The studies shared core
  a priori hypotheses.
                               B. Perceived saturation increases with R∗g not with Duv
• Hypotheses highlighted in
  green are supported by
  results presented on the     C. The paintings won’t be judged differently
  following slides; those in
  red are not supported.

                                                                                            Gamut-Illuminance Study
                               A. Participants will prefer the maximum Log Lux

                                       and have a preferred level for R∗g

                               B. Perceived saturation increases with R∗g and Log Lux

                               C. The paintings won’t be judged differently
Results – Saturation

                                                                                                                                                Gamut-Tint Study
                                                                                Single Factor Plots – Saturation
• Results for saturation aligned with                                           Single factor regression plots are provided for significant
                                                                                predictors. Regression models are represented by dashed green
  a priori expectations for all variables.
                                                                                lines. Mean response levels for each experimental scene are
                                                                                marked with by blue shapes. Error bars represent ±1 standard
                                                                                error. Adjusted R2 values are provided in plot corners.
• Increasing Log Lux increased
  perceived saturation, suggesting the
  Hunt Effect was clearly seen by
  participants with the experimental
  range of 25 lux ≤ Log Lux ≤ 100 lux.       R∗g as a Predictor of Saturation

• Increasing Rg∗ also increased

                                                                                                                                                Gamut-Illuminance Study
  perceived saturation.                      R∗g as a Predictor of Saturation              Log Lux as a Predictor of Saturation

• The omitted single factor plot is not
  provided because Duv was not a
  significant predictor of saturation.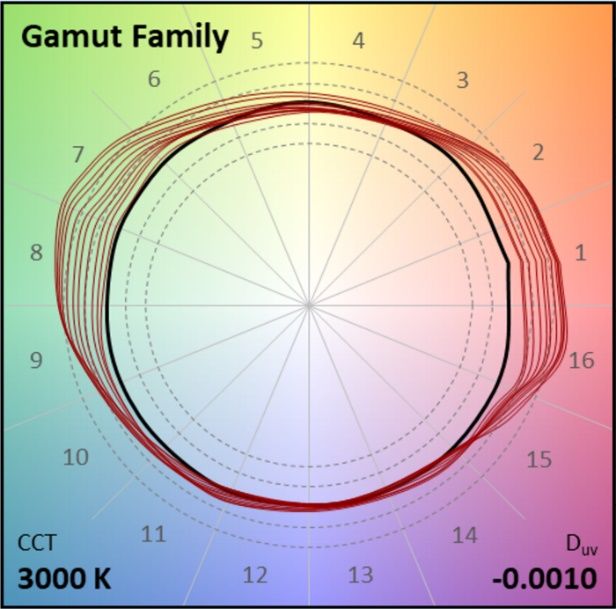
Results – Preference

                                                                                                                                                                           Gamut-Tint Study
• Increasing Rg∗ reliably increased                                                                               Response Surface for Preference
  personal preference in all models                                                                               The response surface maps an interaction between
  across both studies.                                                                                            Rg∗ (x-axis) and Duv (y-axis) for preference (z-axis).
                                                                                                                  Lowest preference coincides with low Rg∗ and high Duv.
                                                                                                                  Highest preference coincides with high Rg∗ and
• Both studies found no evidence of                                                                               moderately negative Duv.
  decreased preference for Rg∗ > 115,
  contrary to previous studies.
 [Esposito 2016, Royer 2018, Bao and Wei 2019]

• The gamut-tint studied identified a

                                                                                                                                                                           Gamut-Illuminance Study
  valid response surface that maps an
  interaction between R∗g and Duv
  predicting the preferred level for Duv
  varies with Rg∗ :                              Single Factor Plot – R∗g as a Predictor of Preference

      • Duv = -0.013 at Rg∗ = 100                A single factor regression plots is provided for R∗g . Log Lux
                                                 was also significant. The regression model is represented by a
      • Duv = -0.005 at Rg∗ = 120                dashed green line.        Mean response levels for each
                                                 experimental scene are marked with by blue shapes. Error
                                                 bars represent ±1 standard error. Adjusted R2 values are
                                                 provided in plot corners.
Results – Paintings                 Gamut-Tint Study                         Gamut-Illuminance Study

• No significant differences between
  paintings were seen for either
  R∗g or Duv in the gamut-tint study

• Significant differences between the
  paintings were seen throughout the
  gamut-illuminance study for both
  R∗g and Log Lux.
                                                                          Single Factor Plots – Log Lux as a Predictor of Preference
• It may not be possible to specify a                                     Separate single factor regression plots are provided for Log Lux for both

  particular level of Rg∗ that is broadly
                                                                          paintings. The regression models are represented by dashed green lines.

  effective for all artwork at a
                                                     Landscape Painting                                  Baroque Painting
  particular light level.

• Style (baroque realism versus
  modern abstract) and color palette
  (moderately saturated natural color
  versus high saturation abstract color)
  may lead to distinct perceptual
  outcomes. The results of these and
  other studies are generalizable only to
  the types of paintings presented.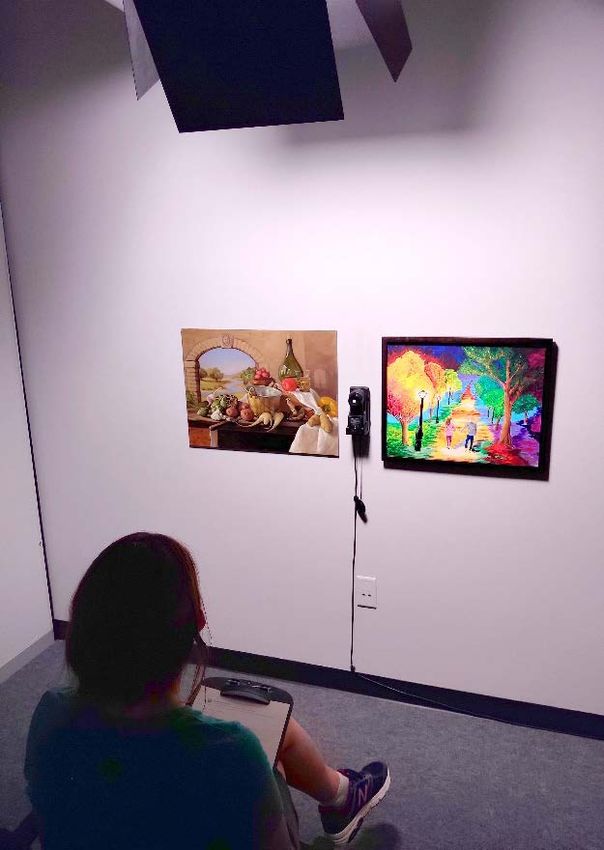
Future Work

• The red saturating gamut family
  reliably increased both personal
  preference and perceived saturation
  for all three paintings and across a
  range of Duv and Log Lux.

• LED sources capable of providing a
  range of high performance gamuts are
  already available. Such sources only
  require one broad-band emitter along
  with three emitters corresponding to                                                                                               Realistic LED Array
  the prime color regions (450 nm, 530                                                                                               The presented SPDs were extracted from Luxeon C datasheets.
  nm, 610 nm). [Thornton 1999]                                                                                                       This five-channel array is similar to several commercially
                                                                                                                                     available systems and produced the gamut family shown at right.

• Making a red saturating gamut family
  available on those sources would
  provide lighting designers with a
                                              References
  powerful new tool for fine-tuning the
                                              [IES] Illuminating Engineering Society. 2017. RP-30-17 Recommended Practice for Museum Lighting. New York (NY): Illuminating Engineering Society. 141 p.
  visual environment, with cross-over         Hunt R. 1952. Light and dark adaptation and the perception of color. Journal of the Optical Society of America. 42(3)190-199.
  applications in fine dining, hospitality,   Esposito T. 2016. Modeling color rendering and color discrimination with average fidelity, average gamut, and gamut shape. PhD Thesis, Penn State University, PA. 190 p.
  theatre and more.                           Royer M, Wilkerson A, Wei M. 2018. Human perceptions of colour rendition at different chromaticities. Lighting Research & Technology. 50(7)965-944.

                                              Bao W, Wei M. 2019. Change of gamut size for producing preferred color appearance from 20 to 15000 lux. Leukos. 17(1)1-22.

                                              Thornton WA. 1999. Suggested optimum primaries and gamut in color imaging. Color Research and Application. 25(2)148-150.
You can also read