The Wealth of Generations, With Special Attention to the Millennials
←
→
Page content transcription
If your browser does not render page correctly, please read the page content below

MAY 2020

The Wealth of
Generations, With
Special Attention to
the Millennials
______________________________________________________

William G. Gale
Hilary Gelfond
Jason Fichtner
Benjamin H. Harris

 This report is available online at: https://www.brookings.edu

 The Brookings Economic Studies program analyzes current
 and emerging economic issues facing the United States and the
 world, focusing on ideas to achieve broad-based economic
 growth, a strong labor market, sound fiscal and monetary
 policy, and economic opportunity and social mobility. The
 research aims to increase understanding of how the economy
 works and what can be done to make it work better. 1
ACKNOWLEDGEMENTS

This paper is an updated version of a paper prepared for the “Conference on Measuring and
Understanding the Distribution and Intra/Inter-Generational Mobility of Income and Wealth,”
March 5-6, 2020 and published as Working Paper 27123 with the National Bureau of Economic
Research. The authors thank Alec Camhi, Grace Enda, Claire Haldeman, Victoria Johnson,
Aaron Krupkin and Lucie Parker for expert assistance; Karen Dynan, Douglas Holtz-Eakin,
Alicia Munnell, and conference participants for helpful comments; and John Sabelhaus for
sharing data. Part of the work on this project was funded by the US 2050 project, supported by
the Peter G. Peterson Foundation and the Ford Foundation. The statements made and views
expressed are solely the responsibility of the authors. The authors did not receive financial
support from any firm or person for this article or from any firm or person with a financial or
political interest in this article. The authors are not currently officers, directors, or board
members of any organization with a financial or political interest in this article.

1. Introduction
 The patterns and determinants of household wealth accumulation have long been of interest to

economists, with seminal contributions dating back at least to Modigliani and Brumberg (1954),

Friedman (1957), and Ando and Modigliani (1963). Recent work by Piketty (2014) and Saez and Zucman

(2019) has sparked a new generation of research interest in this topic.

 Wealth accumulation is of interest for several reasons. At the household level, wealth provides a

source of future consumption, as well as insurance against adverse economic shocks. At the aggregate

level, wealth finances domestic and foreign investment, affects current consumption spending, and

influences the efficacy of monetary and fiscal interventions. More broadly, as discussed further below, the

sheer magnitude of changes in aggregate household wealth relative to GDP in recent decades merits

attention.

 Documenting and determining the causes of changes in the level and distribution of household wealth

and its components across generations and over time is an extraordinarily ambitious goal. This paper

takes several initial steps in that general direction, building on Gale and Pence (2006), Gale, Gelfond, and
Fichtner (2019) and Gale and Harris (2020) and using data from the 1989 to 2016 waves of the Federal

Reserve Board’s Survey of Consumer Finances (SCF). We obtain several key results.

 First, while the Great Recession in 2007–2009 reduced wealth in all age groups, the broader long-

term trend has been that the wealth of older age groups has increased, while the wealth of successive

cross-sections of younger age groups has fallen. A significant share of these changes, in both directions,

can be explained by the evolution of household demographic and economic characteristics. Second, we

show that the millennial generation—people who were born between 1981 and 1996 and hence were

between the ages of 20 and 35 in 2016—had less median and mean wealth in 2016 than any similarly aged

cohort between 1989 and 2007.

 Predicting future wealth accumulation patterns is difficult, but we note that the millennials have

certain advantages over previous generations in terms of wealth accumulation. They are the most

educated generation in history and generally have higher earnings than their predecessors. Because of the

evolution of the pension system toward defined contribution (DC) plans, millennials may well work longer

than any previous generation, giving them additional years to save. And millennials may well end up

inheriting more than any prior generation.

 Millennials also face numerous disadvantages. Their careers had a rocky start because of the financial

crisis and Great Recession in 2007-2009. They will be employed in contingent workforce jobs (which are

more uncertain and have weaker benefits than traditional jobs) to a greater extent than previous

generations. They are marrying, buying homes, and having children later. Longer lifespans mean that they

have to accumulate more wealth, all else equal, to maintain pre-retirement living standards in retirement.

Because their parents are living longer than previous generations did, millennials will also receive

inheritances later in life. They will face increased burdens from any eventual resolution of the

government’s long-term fiscal shortfalls in general, and the financial imbalances in Social Security and

Medicare in particular. They face an economic future with projections of lower rates of return and

economic growth than in the past.

 Third, we highlight the role that minorities will play in determining wealth prospects for millennials.

Minorities constitute a substantially larger share of the millennial population than they do in any previous

generation. Using cross-section and pooled regressions, we show that minority status is negatively

 2
associated with net worth, controlling for other household characteristics. The difference in wealth

between Black and white households appears to be growing over time, controlling for other factors.

 One overarching caveat to all of the results and analysis is that the paper applies to the period before

the COVID-19 pandemic, an enormous shock that will clearly have significant impacts on wealth

accumulation patterns for a wide range of birth cohorts. The paper is thus best interpreted as addressing

generational wealth patterns through 2016 and providing a pre-COVID benchmark against which future

studies can be compared.

 The rest of the paper is organized as follows. Section II describes the SCF data. Section III analyzes

wealth accumulation over time for a wide range of birth cohorts. Section IV discusses the status of the

millennials as of 2016 and the advantages and disadvantages they face relative to prior generations.

Section V addresses issues related to minorities and wealth accumulation. Section VI concludes.

2. Survey of Consumer Finances

 The SCF is a triennial household survey that is generally considered to provide the most

reliable and complete survey-based measures of household wealth (or net worth, terms we use

interchangeably below).1 The surveys covering the period 1989 to 2016 follow a generally

consistent methodology. Raw sample sizes vary from about 3,100 to about 6,200 in surveys

during that period. The survey includes information on household demographic characteristics,

income, assets, debts, and other characteristics.

 To capture how assets and debts are held broadly in the population, about two-thirds of

the unweighted sample are drawn from a stratified, nationally representative random sample.

The remainder of the sample is randomly selected from statistical records derived from tax

returns, using a stratification technique that oversamples households likely to have substantial

...
1. The SCF is conducted by the non-partisan and objective research organization NORC at the University of Chicago on behalf of the Federal
 Reserve Board and with the cooperation of the Department of Treasury.

 3
wealth. This sample design allows for more efficient and less biased estimates of wealth than are

generally feasible through simpler designs. In particular, oversampling the wealthy is an

important component of the survey, because wealth is so highly concentrated. All of the data

presented in this paper represent weighted statistics, using the sample weights provided by the

SCF, which correct for selection probabilities and nonresponse.

 The SCF uses a multiple imputation procedure to fill in missing data. Five implicates

form an approximate distribution of the missing data, creating a sample that is five times larger

than the actual sample. For descriptive statistics, we use all five implicates by dividing the

sample weights by five. In our regressions, we use the first implicate only.

3. Wealth Across Generations
A. Framework

 We analyze the influence of changes in demographic characteristics on wealth

accumulation across cohorts by utilizing basic median and ordinary least squares regressions, in

the absence and presence of demographic variables. We run median (least-absolute-deviation or

LAD) regressions and ordinary least squares regressions, pooling data from the 1989 and 2016

SCFs. We break the data into four age-category subsets, one for 25–34-year-olds, one for 35–44-

year-olds, one for 45–54-year-olds, and one for 55–64-year-olds. For each household i in each

age category k, we specify wealth as a function of a constant and a survey year indicator

variable:

(1) 1 = 1 + 1 (year = 2016) + 1

 In this model, the coefficient 1 captures the change in median or mean wealth between

the 1989 and 2016 samples of each age category. In a second basic regression specification, we

 4
add a vector of demographic indicators, denoted by X. This demographic specification is

described in detail below.

(2) 2 = 2 + 2 (year = 2016) + 2 + 2

 If demographic changes explain most of the difference in wealth between 1989 and 2016

for age category k, 2 should be close to zero, and the coefficients for the variables in the

demographic vector should be statistically significant. For example, if 1 = $100,000 and 2=

$20,000 (and both are estimated precisely), we would say that demographics variables explained

80 percent of the rise in wealth accumulation. This approach could be expanded to account for

the range of possible outcomes that exists to statistical imprecision but in this paper, we take a

“first cut” at looking at how demographic factors matter. Notably, the specifications above

assume that the relationship between wealth and demographic characteristics is the same in both

years (other than a shift in the intercept).2

B. Specification of Demographic Characteristics

 The survey respondent and the household head are not necessarily the same person in the

SCF. The SCF designates the household head to be the male in a mixed-gender relationship and

the older partner in a same-gender relationship, while the respondent is (supposed to be) the

person most familiar with the family’s finances. As a result, demographic characteristics do not

always map neatly onto households, our unit of observation.3

 We employ data on race, marital status, sex, educational attainment, and income

...
2. Gale and Pence (2006) implement a similar approach, as well as a Blinder-Oaxaca decomposition (Blinder 1973; Oaxaca 1973) and
 counterfactual distributions based on DiNardo, Fortin, and Lemieux (1996) and Machado and Mata (2005). These different approaches
 generated similar conclusions.

3. Lindamood, Hanna, and Bi (2007).

 5
category.4 Race applies to the respondent and is reported as indicator variables for non-Hispanic

white, Black, Hispanic, or other (including those of Asian and Native descent). Marital status

reflects whether the household consists of a single financially independent adult or two

interdependent adults. Two financially interdependent unmarried people living together are

considered a married couple. We control for the sex of the household head. We control for the

educational attainment of the household head using indicators for less than a high school

diploma, high school diploma, some college, bachelor’s degree, and graduate degree. We control

for household income using indicators for income categories, with cut-offs at $20,000, $50,000,

$100,000, and $200,000.

C. Specification of the Dependent Variable

 The SCF covers all household assets and liabilities, with two notable exceptions. First,

the survey excludes households in the Forbes 400, who would be easily identifiable in the data.

Second, because the SCF defines net worth (assets minus debt) as resources that a household

may access and control immediately, the survey does not report defined benefit (DB) pension

wealth—the present value of future income (minus future contributions) that households expect

to receive from DB pension plans. To present a more complete analysis of household wealth, we

add to the SCF definition of net worth a measure of the present value of DB wealth, following

Sabelhaus and Volz (2019). Our resulting wealth definition, like the SCF’s, does not include

future Social Security or Medicare benefits (or taxes), which often comprise a significant share

...
4. In the dataset, these variables correspond to categorical variables “RACE”, “MARRIAGE”, “HHSEX”, an “EDCL” categorical variable
 adjusted with information from “EDUC” to provide more granularity with less than high school and graduate school specifications, and a
 household income category variable generated from “INCOME,” all as defined in
 https://www.federalreserve.gov/publications/files/scf17.pdf. See also
 https://www.federalreserve.gov/econres/files/Networth%20Flowchart.pdf.

 6
of households’ resources in retirement.5

 We employ two different wealth specifications, one that uses the level of wealth, and one

that uses the inverse hyperbolic sine transformation of wealth. The results derived from the level-

of-wealth analysis describe absolute changes in wealth over the period, while the results from the

inverse hyperbolic sine specification describe proportional changes in wealth over the period.

We use this transformation, instead of the more traditional logarithmic transformation, because it

approximates the logarithm while remaining defined for the non-positive values common in

wealth data.

 More formally, if is a scaling parameter and w is a measure of wealth, the inverse
 1
hyperbolic sine of wealth can be written as −1 sinh−1( ) = −1 ln[ + ( 2 2 + 1)2 ]. This

symmetric function is linear around the origin but approximates the logarithm for larger values
 1
of wealth. To see this, note that if w is large, ln [ + ( 2 2 + 1)2 ] ≈ ln 2 + ln , which is

simply a vertical displacement of the logarithm. Following previous research, we set =

0.0001.6 When multiplied by this scaling parameter, coefficients and standard errors from an

inverse hyperbolic sine specification, like logarithmic coefficients and standard errors, can be

interpreted as the percentage change in wealth implied by a change in a particular demographic

characteristic, assuming that wealth values are sufficiently large.7

D. Results

...
5. Social Security provides about 90 percent or more of the income for one-third of retirees and 50 percent or more of the income for two-
 thirds of retirees (Social Security Administration 2019).

6. Burbidge, Magee, and Robb (1988) find the optimal value of to be 0.0000872 (within rounding distance of our choice). Pence (2002)
 finds that 0.0001 is the optimal value of , a value also used by Kennickell and Sundén (1997). See Gale and Pence (2006) for author’s
 prior work conforming to this methodology.

7. See Pence (2006) for further explanation of the logarithmic approximation, and Burbidge, Magee, and Robb (1988) for more information
 about the inverse hyperbolic sine transformation itself.

 7
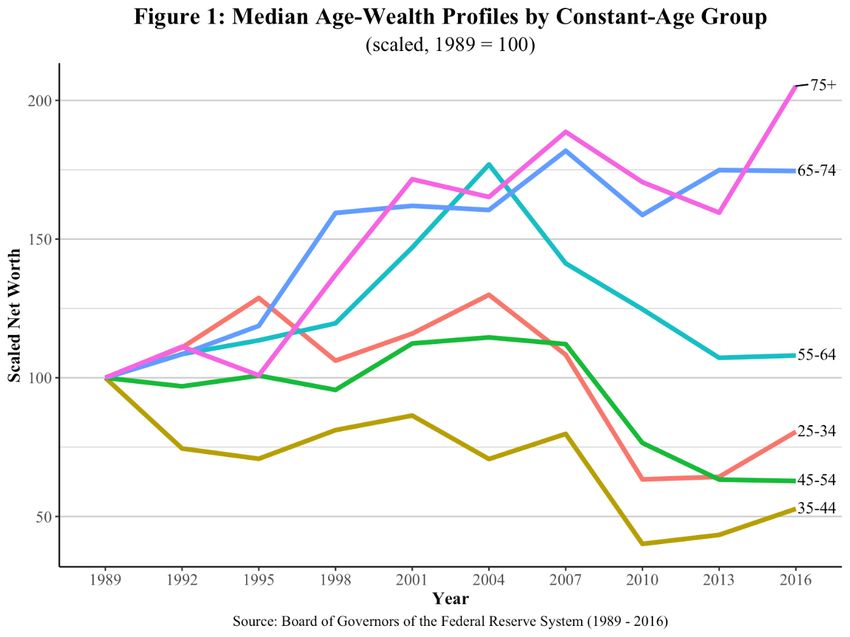
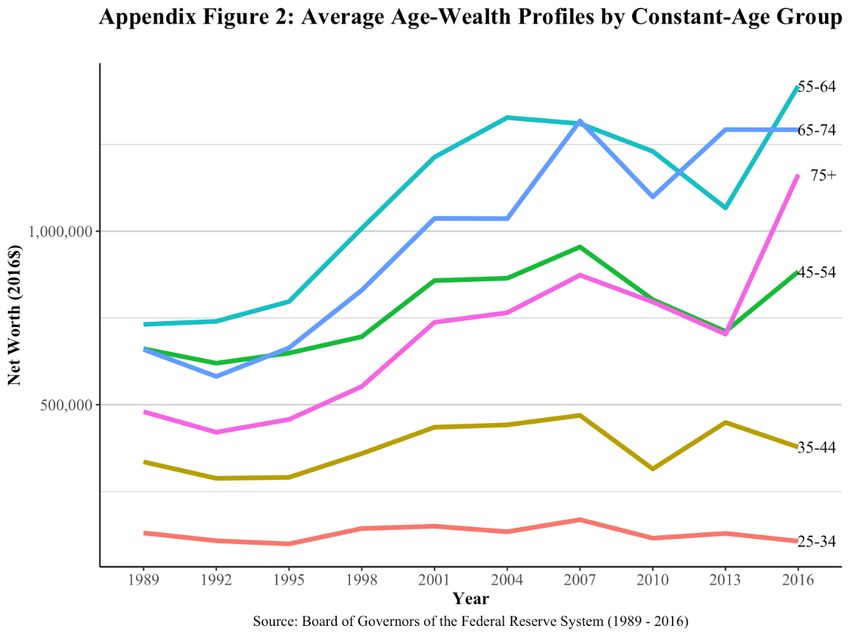
Figure 1 shows median age-wealth profiles for constant-age groups across birth cohorts.

The data are scaled so that each generation’s 1989 value is set to 100. The graph demonstrates

two points. First, the Great Recession in 2007–2009 significantly reduced household wealth in

all age groups. Second, younger age groups have been doing worse than older age groups. For

example, in 2016, all groups aged 55 and older had more median wealth than their 1989

counterparts. Households aged 25–34 in 2016—roughly the millennial generation—held about

12 percent less wealth than did households who were the same age in 1989.

 Figure 2 shows scaled mean age-wealth profiles. Due to the growth of income and wealth

at the top of the distribution, the mean increases exceed the median increases, but they follow the

same general pattern, with wealth rising more slowly for younger age groups than for older age

groups. Appendix figures 1 and 2 report median and mean net worth levels by age and year.

 Table 1 reports results from median regressions. The first specification follows equation

(1), explaining the level of household wealth as a function only of only a constant and an

indicator for whether the observation occurred in 2016. The 2016 indicator shows that median

wealth was substantially lower in 2016 than in 1989 for households aged 35–44 and 45–54—by

about $77,000 and $97,000, respectively. Median wealth for 25–34-year-olds and 55–64-year-

olds was not significantly different in the two sample years.8

 The effects shown in Table 1 could be due to changes in the general economic

environment and/or to changes in specific household characteristics. To isolate the impact of

these two groups of determinants, the second specification includes several household-level

demographic variables, following equation (2). We then (implicitly) assign the residual impact

...
8. Because we are analyzing changes among age groups within years, our sample sizes are fairly limited, ranging from 452 to 1,446 people per
 age group per year. Notably, 2016 sample sizes for each age group are about 2 to 3 times the size of the sample sizes of the same age groups
 in 1989. This will manifest in standard errors and significance levels, which are reported in our results.

 8
to the general economic environment.

 The results show that changes in household characteristics reduced wealth for households

aged 25–54 in 2016 relative to 1989 but raised wealth for households aged 55–64 over the same

period. For example, for households aged 35–44, the coefficient on the 2016 indicator was about

-$54,000, compared to about -$97,000 in the first specification. This implies that changes in

household characteristics explain about 45 percent of the decline in wealth for this age group

over time.

 Likewise, for households aged 35–44, the 2016 effect reduced wealth by $77,000 when

demographic variables were excluded but by only $15,000 when demographic variables were

included. Thus, more than 80 percent of the decline in wealth for that group can be explained by

demographic factors.

 In contrast, for households aged 55–64, the coefficient on the 2016 indicator is about

-$29,000, which is lower (algebraically) than the coefficient in the first equation—which is about

$15,000 but not significantly different from zero.

 The coefficients on the demographic variables (not shown) are consistent with much prior

work. Households that are Black or Hispanic have lower wealth than other households, even

after controlling for observables. Households where the head has more formal education and/or

higher income accumulate more wealth. To some extent, married households have more wealth

and female-headed households often have lower wealth.

 Table 2 repeats the exercise using mean (ordinary least squares) regressions. The first

specification shows that average wealth rises substantially in the 45–54 and 55–64 age groups.

Coupled with the changes in median wealth shown in Table 1, these figures suggest a substantial

widening of the distribution of wealth in those age groups over time.

 9
The second specification shows, again, that changes in household demographic variables

served to raise wealth substantially in the 55–64 age group. More than two-thirds of the increase

in wealth in that age group documented in the first specification can be explained by changes in

demographic characteristics in the second specification. Including demographic variables

reduced the 2016-year effect on wealth from $678,944 to $228,623 in the age cohort approaching

retirement.

 The impact of the individual demographic variables is qualitatively similar to those found

in the median regressions in Table 1—minorities and female-headed households have less

wealth, households where the head is married or has more formal education, or where income is

higher, tend to have higher wealth. (Appendix Tables 1 and 2 provide regression results using the

hyperbolic sine of wealth as the dependent variable and generate broadly similar conclusions.)

4. Millennials
 The millennial generation includes individuals born between 1981 and 1996.9 Between

the Great Recession and the COVID pandemic (the latter of which is not covered in the data

presented here), millennials have already experienced two major economic disruptions during

their adulthood. Substantial economic inequality has been an enduring fixture of millennials’

adulthood. While every generation faces its own unique opportunities and challenges, many

people feel that the obstacles facing the millennial generation are especially acute.10

A. Current Status

 Focusing first on their current status (that is, as of 2016), today’s young adults have

...
9. Dimock (2018). Various definitions of the millennial generation include those born between the early 1980s and the early 2000s. The
 Census Bureau (unofficially) defines Millennials as the cohort born between 1982 and 2000 (U.S. Census Bureau 2015).

10. Pew Research Center (2012).

 10
accumulated less wealth than most previous generations at the same age. Figure 3 shows

tabulations from each wave of the SCF from 1989 to 2016. In the 2016 survey year, millennials

were between the ages of 20 and 35. We examine net worth accumulation among 20-35 year-

olds in each of the SCF years (with all wealth data reported in 2016 dollars). Because wealth

accumulation patterns may not be particularly informative for people who are still in college, we

also examine wealth patterns among 25-35 year-olds in each year.

 The figure shows that, using either age-group comparison, median wealth among

millennials in 2016 was lower than among similarly aged cohorts in any year from 1989 to 2007.

As noted above, the Great Recession in 2007-9 significantly reduced household wealth, which

has been slowly recovering since then. Median wealth among millennials was about 25 percent

lower in 2016 than among similarly aged households in 2007. The percentage declines in mean

wealth are even larger.11

 Focusing on retirement wealth, Figure 4 shows that, relative to similarly aged people,

millennials have about the same coverage rate for defined benefit pensions (DB) and defined

contribution plans from 2004 on, but lower DC coverage than the 1995-2001 cohort and sharply

lower DB coverage relative to that in the late 1980s. Median DC balances among account

holders has fallen since 2007.12

 All of the results above likely overstate the relative wealth position of millennials

because of the interaction of three factors. First, the SCF does not survey dependent members of

...
11. Dettling, Hsu, and Llanes (2018) provide further detail on wealth accumulation trends between 2007 and 2016. Considering components of
 wealth, Millennials had more debt than similarly aged people in 1989 but have about the same level as the 2001 cohort. The latter result
 may be surprising, given the well-publicized growth of student loans, but Millennials have less credit card and other debt than prior
 generations (Looney and Yannelis 2018).

12. Dettling and Hsu (2014) examine retirement saving trends for people aged 18-31 in the successive SCFs. They find that Millennials in 2013
 were just as likely to have a defined contribution retirement account as similarly aged people in 2001. Millennials had higher median
 balances, conditional on ownership (by about $2,000), but they had lower participation in defined benefit plans.

 11
households, including millennials who live with their parents. Second, the share of millennials

living with their parents is higher than the share of similarly aged people in prior generations.

Among 25-34 year-olds, 16 percent lived with their parents in 2016, compared to 11 percent in

1990 and 10 percent in 2000.13 Third, some formal evidence (as well as casual observations)

suggests that young adults who are living at their parents’ home are doing less well economically

than other young adults. Among those aged 25-34 and living at home in 2016, 26 percent were

neither employed nor attending school.14 Less educated people are less likely to live

independently and those with higher wages are more likely to do so.

 Between 1989 and 2016, the distribution of wealth widened significantly. For example,

for 25-35 year-olds, average net worth in the bottom 25 percent of the distribution fell from

about -$1,200 in 1989 to -$5,000 in 2007 and to -$20,000 in 2016. Over the same period, average

wealth in the top 10 percent of the distribution skyrocketed, rising from $1.9 million in 1989 to

$3.3 million in 2007 to $4.8 million in 2016. These patterns are consistent with the heterogeneity

in preparation for retirement seen for other generations and noted above.

B. Future Status

 The millennials also face a distinctive set of issues and circumstances that will affect their

ability to save for retirement, including both advantages and disadvantages compared to prior

generations. The disruption to health, careers, and the economy due to the COVID-19 pandemic

looms large in this regard but is not discussed further below as the relative effects on different

generations is extremely hard to assess at this point.

...
13. Fry (2017). In our analysis of SCF data, we use 20-35 year-olds in 2016 to represent millennials (or 25-35 year-olds, given that wealth
 accumulation of households where the head is less than 25 year-olds may be difficult to model). Many other analyses, focusing on different
 issues or time frames, use a more standard age classification of 25-34 years old.

14. Fry (2017), and St. Clair (2016).

 12
1. Advantages

 a. Education

 Millennials start out with the advantage of having the greatest amount of formal

education of any generation in history. Over 60 percent of adult millennials have attended at least

some college, compared to 46 percent of the Baby Boomer generation when they were the same

age.15 Rising educational attainment among women drives this difference.16 As a result of

increased educational attainment and other factors, median wages for employed women are

generally higher for millennials than for earlier generations, controlling for age. Among men,

the wages of employed millennials typically do not surpass wages of older generations until

millennial workers reach their mid-30s.17

 Having more education will make it easier to save for retirement. First, the higher wages

that come with higher education will give households more opportunities to save. Second, people

with more education tend to save more of their income, controlling for income.18 Third, people

with higher education levels tend to have later retirement ages since they tend to have less

physically demanding jobs, are healthier, and receive fringe benefits in addition to wages that

may incentivize them to stay in the labor force.19 The overarching societal trend towards white-

collar work may further increase average retirement ages for similar reasons. Good health status

is also highly correlated with decisions to work longer. 20 Working longer, of course, makes it

...
15. Council of Economic Advisers (2014).

16. Johnson et al. (2017).

17. Persheski (2019).

18. Dynan, Skinner, and Zeldes (2004).

19. Burtless (2013).

20. Munnell (2015).

 13
easier to finance adequate retirement saving.

 On the other hand, higher education and income may make adequate saving more

difficult to achieve in some ways. For example, Social Security benefits are progressive,

replacing a smaller amount of average lifetime earnings as average lifetime earnings rise. And

those who are better educated, and in better health, tend to live longer, meaning that they have a

longer retirement period to finance, holding retirement age constant.

 b. Longer careers due to change in type of retirement plan

 Since the 1980s, the share of people participating in defined benefit (DB) plans has

decreased while participation in defined contribution plans (DC) has increased (Figure 4). At the

same time, the overall share of the workforce participating in any plan has remained relatively

constant.21

 This trend is expected to continue, implying that today’s younger workers will have

higher DC coverage than previous generations and lower DB coverage. This will likely lead to

later retirement for millennials relative to previous generations, which would make it easier to

accumulate funds necessary to finance retirement. Evidence suggests that DB plans often

encourage comparatively early retirement through built-in incentives that maximize pension

wealth at relatively early retirement ages.22 Since the 1980s the average retirement age has risen

after decades of decline, consistent with the decline of DB plans and rise of DC plans.

 As with better education, however, the shift to DC is not an unambiguous gain for

retirement saving adequacy. Greater DC coverage and less DB coverage shifts much of the

planning burden and investment risk from the employer to the employee, as discussed further

...
21. Gale and John (2017).

22. Kotlikoff and Wise (1984); Stock and Wise (1990).

 14
below.

 c. Health insurance

 Millennials have higher rates of health insurance than prior generations, due largely to the

Affordable Care Act. Among 19-25 year-olds in 2014, about 79 percent had coverage under a

health insurance policy, 13.2 percentage points higher than earlier generations at that age.23

2. Disadvantages

 Despite having some advantages relative to previous generations, the millennials face a

variety of obstacles and concerns that increase their chances—in absolute terms and relative to

previous generations—of saving too little.

 a. Early-career labor market

 The early-career labor market experienced by many of the millennials has been

dominated by the Great Recession and the tepid pace of recovery for several years after. The

growth path of GDP has never recovered to the full-employment trend that existed before the

Great Recession.24 The weak job market and low overall labor force participation that existed at

the beginning of their careers has probably adversely affected millennials’ career earnings paths.

Research shows that entering the labor force during an economic downturn depresses long-run

earnings.25 Evidence from the Great Depression further reveals that those who experience poor

macroeconomic trends while they are young are less likely to take on significant financial risk,

invest in the stock market, or own bonds.26

 b. The rise of contingent jobs

...
23. Council of Economic Advisers (2014).

24. Congressional Budget Office (2018).

25. Welch (1979); Kahn (2010).

26. Malmendier and Nagel (2011).

 15
The evolution of the labor force towards contingent jobs will also complicate retirement

saving for millennials.27 In traditional employer-employee relationships, workers earn a salary or

wage and receive fringe benefits, potentially including employer contributions to retirement

plans. Contingent workers, on the other hand, work on an ad hoc basis and are paid based on the

service or good they provide. They may or may not work full-time. Examples include Uber

drivers, consultants, and contractors. Using a broad definition, there could be almost 20 million

contingent workers in the United States.28 Among full-time workers, these individuals have

median weekly earnings about 30 percent lower than traditional workers and face a variety of

barriers to retirement saving. Conventional retirement savings mechanisms, such as payroll

deductions and employer matching contributions, are not readily available. As a result, they are

half as likely to have access to a work-provided retirement plan.29 While non-employer based

retirement options such as IRAs are available to this group, only a small percentage participate.30

Although a recent survey suggests that contingent work is not rising as fast as some had thought,

it is nevertheless the case that millennials face higher probabilities of doing contingent work than

previous generations.31

 c. The added risks and responsibility of defined contribution plans

 As noted above, participants in DC plans tend to work longer than participants in DB

plans; other things equal, longer working careers should improve the adequacy of retirement

saving. But other structural features of DC plans may lead to lower retirement incomes. First, to

...
27. Gale, Holmes, and John (2018); Harris and Krueger (2015); Katz and Krueger (2016).

28. Gale, Holmes, and John (2018).

29. Gale, Holmes, and John (2018).

30. Government Accountability Office (2015).

31. US Bureau of Labor Statistics (2018).

 16
establish a DC plan, employees must make significantly more decisions regarding contribution

levels, asset allocations, and asset drawdown. This freedom may actually serve to undermine

retirement security if retirees make poor financial decisions.32 Automatic mechanisms that

govern enrollment, escalation of contributions, investment allocation, and rollovers can mitigate

these problems. Second, workers bear all the investment risk in most DC plans, which can

undermine retirement security if savers’ retirement portfolios underperform.

 d. Delayed life decisions

 Compared to previous generations, millennials are more likely to delay homeownership,

marriage, and childbearing. Young adults currently have the lowest homeownership rate of any

similarly aged generation since at least 1989 (Figure 5). The average age of first marriage has

increased from age 21 for women (24 for men) in 1975 to age 27 (29) in 2016 (Figure 6).33 The

age at which parents have their first child has increased over time as well, from 22 in 1975 to 26

in 2014.34 The changes in these behavioral patterns are so large that there is debate over whether

to label “emerging adulthood” as a new stage of life between childhood and adulthood.35 These

trends, in turn, may delay the onset of retirement saving if people feel the need to “get settled” by

purchasing a house and raising children before beginning to think about saving for retirement.

 e. Increasing lifespan

 Just as delayed life choices may postpone substantial retirement saving, increasing

lifespans make it harder to maintain standards of living in retirement, other things equal. Over

the past five decades, the average life expectancy at birth has increased from 67 to 76 for males

...
32. Poterba (2014).

33. United States Census Bureau (2017).

34. Matthews and Hamilton (2016); United States Census Bureau (2017).

35. Vespa (2017).

 17
and from 73 to 81 for females. These increases are not borne equally, however. Those at the top

of the income distribution have received almost all of the increase, while life expectancy for

those at the bottom has remained constant or has possibly even declined slightly.36 If households

live longer and plan to maintain their pre-retirement standard of living in retirement, they will

either need to work longer or save more.

 f. Long-term federal fiscal imbalances

 The federal government faces a long-term debt problem that will create pressure to cut

spending and raise taxes. Even before the COVID-19 pandemic, the federal government faced a

long-term fiscal shortfall that will require spending cuts or tax increases at some point.37 Low

interest rates, discussed below, will make this problem less severe, but the COVID-19

pandemic, and the associated policies and economic downturn, made the long-term fiscal

situation significantly worse.38

 The longer policymakers wait to institute fiscal adjustments, the larger the adjustments

will have to be in each given year, and the greater sacrifices millennials will have to make.

Changes to Social Security, Medicare, and taxes will be particularly relevant to addressing the

long-term fiscal imbalance. If such fiscal adjustments are made over the next few decades, it

seems highly likely that millennials, who will then be in their prime earning years, will bear a

significant amount of the burden.

 g. Low rates of return

 Real interest rates fell steadily from the mid-1990s, though they have risen slightly in the

...
36. National Academy of Sciences (2015).

37. Auerbach, Gale, and Krupkin (2018), and Gale (2019).

38. To be clear, we are not criticizing the size of the relief and stimulus packages. They were a necessary response to COVID-19.

 18
last few years. Many reasons have been put forward for the decline, and most of them suggest

the low rates will persist somewhat.39 One explanation, popularized by former Treasury Secretary

Larry Summers, involves a lack of aggregate demand due to the Great Recession and secular

stagnation post-recession.40 Other explanations include a worldwide savings glut and a flight to

safety.41

 To the extent that such trends continue or do not reverse, and display themselves in lower

overall asset returns, it will prove harder for millennials to accumulate sufficient retirement

wealth.42 With a given pattern of retirement contributions over time, a lower rate of return will

result in a smaller accumulation of balances during the accumulation phase of retirement saving.

With a given balance at the point of retirement, lower interest rates will result in smaller feasible

payouts—for example, through an annuity—during the withdrawal phase of retirement saving.

 h. Slower wage growth

 Earnings trajectories—or “age-earnings profiles”—have been flattening over time. A

college-educated worker turning 25 in 1940 could expect annual earnings to be 4.0 times as high

by their 55th birthday compared to their earnings in 1940. For college-educated workers turning

age 25 in 1980, this ratio had fallen to just 2.6. For workers with a high school diploma only, the

same ratio fell from 3.6 for the 1940 cohort to 1.5 for the 1980 cohort.43 This decline in wage

growth over time will reduce future income for millennials and make it harder for them to

accumulate wealth over the life cycle.

...
39. Elmendorf and Sheiner (2016).

40. Summers (2016).

41. Bernanke (2007, 2015).

42. Fichtner and Seligman (2017); Mitchell, Clark, and Maurer (2018).

43. Kong, Ravikumar, and Vandenbroucke (2018).

 19
5. Wealth Accumulation and Racial and Ethnic Minorities
A. Findings

 Millennials are more racially and ethnically diverse than prior generations: for example,

44 percent of millennials identify as a minority (a race or ethnicity other than non-Hispanic

white), compared to 25 percent of people aged 21 to 36 in 1985.44 As a result of this increased

diversity, the United States will be a “majority-minority” country by 2050, where minority is

defined as any race other than non-Hispanic white.45 The projected growth of the minority

population will present new challenges and opportunities for wealth accumulation. A substantial

literature suggests that minorities are at a disadvantage with regard to wealth accumulation

compared to their non-minority counterparts.46

 We provide further evidence on these issues below. We estimate regressions of the form

 (3) 3 = 3 + 3 X + 3 R + 3

 Where 3 is a measure of wealth, X is a vector of characteristics for each household i—

including education, marital status, sex (for singles), income and age categories—and R is a

series of racial/ethnic indicators (Black, Hispanic, and non-white other, with white as the omitted

category).47 Using the same methodology elaborated upon above, we employ cross-section data

from each of the ten survey years of the SCF (triennially from 1989 to 2016) and estimate least

squares (LS) and median (Least Absolute Deviation, or LAD) regressions, each with robust

estimation techniques. Thompson and Suarez (2015) examine similar issues and provide wealth

...
44. Fry, Igielnik, and Patten (2018).

45. United States Census Bureau (2018).

46. See Rhee (2013), and Hasler, Lusardi, and Oggero (2018).

47. Regressions using a variable called “normal income” instead of income yielded similar results.

 20
decompositions using the 1989-2013 SCFs.48

 In the text, we present regressions using the level of wealth as the dependent variable. We

emphasize that the coefficient on race shows differences in wealth accumulation after controlling

for various factors but should not be interpreted as an estimate of the impact of racial

discrimination.

 The LS regressions in Table 3 show that Black households tend to have lower net worth

than white households, controlling for other factors.49 In the 2016 SCF, controlling for other

factors, Black households had on average $124,000 less net worth than white households. This

difference may have increased over time. The Black-white differences in wealth in the 1989,

1992, and 1995 cross-sections are smaller than the 2016 difference, with p-values ranging from

.035 to .105.

 This finding should be qualified carefully. Certainly, reductions in Black-white

differences over time in educational attainment and in wages should serve to reduce Black-white

wealth differences. Our results address a different point. We show that—controlling for any

changes in education, wages, and other household characteristics—the difference in wealth

between Black and white people may well have increased over time. Additional results presented

below support this conclusion.

 Households where the head is of Hispanic origin do not generally have statistically

significantly different net worth from whites, controlling for other factors. Other non-white

individuals, on average, had significantly lower net worth than whites in three of the SCF years

...
48. Other studies of racial wealth gaps include Altonji and Doraszelski (2005), Barsky et al. (2002), Masterson et al. (2009), Pew (2011),
 Scholz and Levine (2003), and Shapiro, Meschede, and Osoro (2013).

49. This finding is consistent with Emmons and Ricketts (2017), who show that differences in observable variables cannot fully explain
 minorities’ wealth accumulation relative to whites.

 21
(2004, 2010, and 2016). This difference appears to have increased over time, with the

coefficients on the 1989, 1992, 1995 regressions significantly smaller (in absolute value) than the

coefficient in the 2016 regression.

 In all of these regressions, however, the relevant sample sizes are fairly small, so precise

estimation is difficult. To help address the concern with sample size, we also pool the data across

survey years, adding a control for the survey year, with results shown in Table 4.

 As in the cross-section results, Black households have lower net worth, controlling for

other factors. The coefficients are larger in absolute value in the 2010-2016 specification than in

the 1989-2007 specification, confirming the finding above about widening Black-white wealth

differences, controlling for other factors.

 Households where the head is of Hispanic origin do not have a significantly different net

worth in any of the specifications. Those who do not identify as white, Black, or Hispanic have

significantly lower net worth than whites in each specification and the difference has grown over

time.

 In cross-section LAD results reported in Table 5, the typical Black household had

$43,262 less in wealth than the typical white household, controlling for other factors. The

difference in wealth has increased over time, again conditional on observable factors.

 The LAD regressions also show that the typical household with a head of Hispanic origin

has less net worth than white households in several of the survey years, particularly in 2013 and

2016. The results suggest that wealth differences between whites and Hispanics may be

increasing over time. Results are mixed for other non-white individuals, but the sample size for

this group is relatively small, so precise estimation is difficult.

 Table 6 reports LAD regressions using data pooled across survey years. The results are

 22
qualitatively similar to earlier findings. Black households have less wealth than white households

and the difference has grown over time, although it is smaller in the LAD regressions than in LS

regressions.

B. Discussion

 Our finding that differences in wealth between whites and minorities appears to have

increased over time is consistent with a substantial body of literature.50 The increase in the gap, at

least over the past decade, appears to be due to the decline in housing wealth during the Great

Recession, which impacted low-wealth households more than high-wealth households.51

 The implications of the results for the millennial generation are concerning. Chetty et al.

(2018) find that Black households have lower income, on average, than white households.

Moreover, given parental income, they find that Black children have lower rates of upward

mobility and higher rates of downward mobility than white children. Rates of upward mobility

for Hispanics are lower than for whites but higher than for Black households. Their results

suggest that closing the income gap over time between whites and minorities will be difficult.

Building off those results, our findings imply that minorities that have less wealth than whites,

even after controlling for income (and education, age, and marital status). Therefore, our results

suggest that, even if the income gap between groups were eventually reduced or eliminated, that

would not in itself be sufficient to ensure the adequacy of saving for minority households—there

would still be a retirement saving gap between whites and minorities.

...
50. See, for example, Taylor et al. (2011), Kochhar and Fry (2014), McKernan et al. (2014), Shapiro, Meschede, and Osoro (2014), Thompson
 and Suarez (2015), and Wolff (2018). Munnell, Hou, and Sanzenbacher (2018b) show that differences in the proportion of households
 saving adequately for retirement (a different measure than the “Wealth gap” measures used in the studies cited above) fell for Black
 households relative to white household from 2007 to 2016, but rose for Hispanics relative to whites. Hispanics were particularly hard hit by
 declines in housing prices in the Great Recession.

51. McKernan et al. (2014); Shapiro, Meschede, and Osoro (2014); Wolff (2018).

 23
It is unclear, however, to what extent the wealth accumulation patterns of minorities in

the past provides a reliable guide to their wealth accumulation patterns in the future. As the

economy evolves, one can expect the economic experience of minorities to change. For example,

relative to minorities in the past, minorities in the future may well live in neighborhoods with

different characteristics, go to different types of schools, and have different experiences with

mentors, discrimination, marriage, childbearing and so on. This could, in principle, help

minorities accumulate more wealth relative to whites than in the past. However, the results above

show that over the past 30 years, the gap has widened, after controlling for observable

characteristics.

6. Conclusion
 We document and explain changing wealth levels across the life cycle, with special

attention to the millennial generation. We show that all generations lost wealth during the Great

Recession of 2007-2009, and that the longer-term trends show that older age groups have

generated wealth levels over time, but younger age groups have generated lower wealth levels

over time. We show that a significant share of these changes can be attributed to the evolution of

household demographic and economic characteristics. Millennials, in particular, have less wealth

than any similarly aged generation since 2007. Although they possess a few major advantages

over previous generations, millennials also face a number of “headwinds” that will reduce wealth

accumulation.

 More generally, our results suggest that wealth accumulation paths may be becoming

more delayed over the life cycle.52 Younger generations are attaining more education, which

...
52. See Gale and Harris (2020).

 24
takes time, are entering the labor force with more student debt, and are marrying and buying

homes at later ages. But not all trends suggest that wealth accumulation should be occurring later

in life. For example, Americans are increasingly choosing to have children later in life.

 Two factors that could have important effects on millennials’ outcomes—but are subject

to substantial uncertainty and are not addressed above—are intergenerational transfers and

immigration. The baby boomer generation is entering retirement with record amounts of wealth,

much of which will be bequeathed.53 But the value of iintergenerational transfers is highly

concentrated among high-income and very high-income households and is therefore unlikely to

substantially impact millennial wealth at the median or even among the bottom 80 percent of

households.54

 Immigration presents further opportunities and challenges. Immigration is a complex

issue. While most immigrants have significantly lower wealth, controlling for household and life

cycle characteristics, than the native-born population, they also exhibit higher rates of innovation

and entrepreneurship—which can boost wealth accumulation over time.55 The future path of

immigration, however, is unclear.

 Putting together all of these factors is beyond the scope of this paper. However, Johnson

et al. (2017) projects future retirement income for older millennials and Generation Xers and

finds that median income at age 70 for members of these groups will be higher than that of prior

generations, though a smaller share of individuals will have enough to maintain their pre-

retirement standard of living. These results, as the authors describe, are uncertain, given that

...
53. Gale et al. (2019).

54. Gale and Scholz (1994), and Feiveson and Sabelhaus (2018).

55. See Cobb-Clark and Hildebrand (2006), and Akresh (2011) on the nativity wealth gap. See Hunt and Gauthier-Loiselle (2010) on
 immigrants’ propensity to innovate.

 25
today’s young adults still have decades of work until their retirement.

 Future research could address changing wealth patterns by race, sex, and educational

attainment, immigration, and other characteristics. Another issue is the impact of delayed wealth

accumulation on aggregate wealth inequality. If wealth accumulation is indeed occurring later in

life, this trend (all else equal) could increase cross-sectional wealth inequality, without

necessarily increasing inequality across the life cycle. A related area of research concerns how a

wide range of policy interventions—everything from student loans to estate tax reform—affect

wealth accumulation.

 26
Table 1
Pooled (Least Absolute Deviations), 1989-2016
 (1) (2) (3) (4)
 25-34 35-44 45-54 55-64

Constant 28,344*** 165,024*** 267,826*** 303,986***
 (4,933) (17,388) (27,166) (31,336)
Year 2016 -3,504 -77,124*** -96,826*** 14,777
 (5,971) (19,188) (31,389) (39,818)

Observations 1,250 1,712 1,848 2,015
Robust standard errors in parentheses
*** p
Table 3. Net Worth Regressions (Least Squares)
 (1) (2) (3) (4) (5) (6) (7) (8) (9) (10)
 1989 1992 1995 1998 2001 2004 2007 2010 2013 2016

 Black -42,109* -40,433*** -56,846*** -66,146*** -96,659*** -97,979*** -78,393*** -141,470*** -83,542*** -124,142***
 (23,206) (13,804) (18,309) (19,132) (31,543) (27,485) (29,495) (26,428) (23,857) (37,193)
 p-value 0.061 0.035 0.105 0.166 0.573 0.572 0.335 0.704 0.358 N.A.

 Hispanic -6,333 23,809 -34,760 29,801 -5,895 -25,377 70,958* -58,587** 1,298 42,575
 (26,919) (24,879) (28,864) (26,233) (38,400) (40,387) (42,880) (29,682) (28,004) (37,425)
 p-value 0.289 0.676 0.102 0.780 0.366 0.217 0.618 0.034 0.377 N.A.

 Non-white other 48,796 21,532 -20,803 -66,383 -160,583 -229,736*** -147,826 -279,171*** -69,021 -255,881**
 (89,674) (49,493) (50,361) (91,136) (134,387) (86,197) (115,956) (87,955) (88,076) (105,779)

 p-value 0.028 0.018 0.045 0.175 0.577 0.848 0.491 0.866 0.175 N.A.

 N 3,143 3,906 4,299 4,305 4,442 4,519 4,417 6,482 6,015 6,248
 R-squared 0.114 0.084 0.088 0.094 0.131 0.102 0.104 0.099 0.093 0.071

 Source: Board of Governors of the Federal Reserve (2017).

 Coefficients reported in 2016 dollars.

 Control variables: Education level category (Less than high school diploma, high school diploma, some college, bachelor’s degree, graduate degree); Marital status; Sex
 of single heads of household; Income category ($0-19,999, $20,000-49,999, $50,000-99,999, $100,000-199,999, $200,000+); Age category (0-24, 25-34, 35-44, 45-54,
 65-74, 75+).

 Robust standard errors in parentheses
 *** p
Table 4. Pooled Net Worth Regressions (Least Squares)
 (1) (2) (3)
 1989-2016 1989-2007 2010-2016
Black -90,972*** -71,877*** -117,903***
 (8,626) (9,386) (17,292)
p-value N.A. 0.012 N.A.

Hispanic -7,845 3,575 -7,399
 (11,002) (13,499) (18,635)
p-value N.A. 0.303 N.A.

Non-white other -112,807*** -70,197** -199,954***
 (29,078) (33,546) (54,600)
p-value, N.A. 0.045 N.A.

N 47,776 29,031 18,745
R-squared 0.091 0.102 0.082
Source: Board of Governors of the Federal Reserve (2017).
Coefficients reported in 2016 dollars.
Control variables: Same as in Tables 3 and 5, plus year effects.

Robust standard errors in parentheses
*** p
Table 5. Net Worth Regressions (Least Absolute Deviations)
 (1) (2) (3) (4) (5) (6) (7) (8) (9) (10)
 1989 1992 1995 1998 2001 2004 2007 2010 2013 2016

 Black -29,966*** -20,971*** -21,259*** -19,532*** -22,585*** -31,104*** -23,935*** -21,602*** -36,176*** -43,262***

 (4,534) (3,181) (3,719) (3,123) (3,890) (6,478) (5,844) (4,480) (2,927) (3,019)

 p-value 0.019
Table 6. Pooled Net Worth Regressions (Least Absolute Deviations)
 (1) (2) (3)
 1989-2016 1989-2007 2010-2016

 Black -26,419*** -23,339*** -33,809***
 (1,171) (1,394) (1,714)
 p-value N.A.
Figure 3. Median Net Worth Among Young Households
 (1989-2016)
 $35,000

 $30,000

 $25,000
Net Worth ($2016)

 $20,000

 $15,000

 $10,000

 $5,000

 $0
 1989 1992 1995 1998 2001 2004 2007 2010 2013 2016
 25-35 years old 20-35 years old

Source: Board of Governors of the Federal Reserve System (2017).

 Figure 4. DB and DC Plan Ownership Among 25 to 35
 Cohort (1989-2016)
 50 16,000

 Value of DC Assets ($2016)
 45 14,000
 Percent (%) with Plan

 40
 12,000
 35
 30 10,000
 25 8,000
 20 6,000
 15
 4,000
 10
 5 2,000
 - -
 1989 1992 1995 1998 2001 2004 2007 2010 2013 2016

 DB DC Median Value of DC Plan Assets

 Source: Board of Governors of the Federal Reserve System (2017).
 Retirement account assets include the value of IRAs, Keoghs, thrift-type accounts,
 and future and current account-type pensions.
Figure 5. Share of Young Households Owning a Home
 (1989-2016)
 60
 Percent (%) of Households

 50

 40

 30

 20

 10

 0
 1989 1992 1995 1998 2001 2004 2007 2010 2013 2016

 25-35 years old 20-35 years old

Source: Board of Governors of the Federal Reserve System (2017).

 Figure 6. Median Age at First Marriage (1970-2016)
 35

 30

 25

 20
 Age

 15

 10

 5

 0
 1970 1975 1980 1985 1990 1995 2000 2005 2010 2015

 Source: U.S. Census Bureau (2017).
REFERENCES
Akresh, Ilana R. 2011. “Wealth Accumulation among U.S. Immigrants: A Study of Assimilation and Differentials.” Social Science
Research 40(5): 1390 – 1401.

Altonji, Joseph and Ulrich Doraszelski. 2005. “The Role of Permanent Income and Demographics in Black/White Differences in
Wealth.” Journal of Human Resources. 40(1): 1-30. Winter 2005.

Ando, Albert and Franco Modigliani. 1963. “The Life Cycle Hypothesis of Saving: Aggregate Implications and Tests.” The American
Economic Review 53(1): 55-84.

Auerbach, Alan, William Gale, and Aaron Krupkin. 2018. “The Federal Budget Outlook: We Are Not Winning.” Tax Notes. 617-628.
July 30.

Barsky, Robert, John Bound, Kerwin Charles, and Joseph Lupton. 2002. “Accounting for the Black-White Wealth Gap.” Journal of
the American Statistical Association. 97:459, 663-673.

Bernanke, Ben. 2007. “Global Imbalances: Recent Developments and Prospects.” Speech at the Bundesbank Lecture. September 11.

Bernanke, Ben. 2015. “Why are interest rates so low, part 3: The Global Savings Glut.” Ben Bernanke Blog, the Brookings Institution:
April 1.

Blinder, Alan S. 1973. “Wage Discrimination: Reduced Form and Structural Estimates.” Journal of Human Resources 8(4): 436–55.

Board of Governors of the Federal Reserve System. 2017. “Survey of Consumer Finances 2016.” Board of Governors of the Federal
Reserve System: Washington, DC.

Burbidge, John B., Lonnie Magee, and A. Leslie Robb. 1988. “Alternative Transformations to Handle Extreme Values of the
Dependent Variable.” Journal of the American Statistical Association. 83(401): 123-27.

Burtless, Gary. 2013. “Can Educational Attainment Explain the Rise in Labor Force Participation at Older Ages?” Center for
Retirement Research at Boston College: Chestnut Hill, MA.

Chetty, Raj, Nathaniel Hendren, Maggie R. Jones, and Sonya R. Porter. 2018. "Race and Economic Opportunity in the United States:
An Intergenerational Perspective.” NBER Working Paper No. 24441.

Cobb-Clark, Deborah A., and Vincent A. Hildebrand. 2006. “Wealth and Asset Holdings of U.S. Born and Foreign Born Households:
Evidence from SIPP Data.” Review of Income and Wealth 52(1): 17 – 42.

Congressional Budget Office. 2018. “The Budget and Economic Outlook: 2018 to 2028.” Congressional Budget Office: Washington,
DC.

Council of Economic Advisers. 2014. “15 Economic Facts about Millennials.” The White House: Washington, DC.

Dettling, Lisa and Joanne Hsu. 2014. “The State of Young Adults’ Balance Sheets: Evidence from the Survey of Consumer Finances.”
Federal Reserve Bank of St. Louis Review, Fourth Quarter, 2014. (96) 4:305-330.

Dettling, Lisa, Joanne Hsu, and Elizabeth Llanes. 2018. “A Wealthless Recovery? Asset Ownership and the Uneven Recovery from
the Great Recession.” FEDS Notes. Board of Governors of the Federal Reserve System: Washington, DC.

Dimock, Michael. 2018. “Defining Generations: Where Millennials End and Post-Millennials Begin.” Pew Research Center:
Washington, DC.

DiNardo, John, Nicole M. Fortin, and Thomas Lemieux. 1996. “Labor Market Institutions and the Distribution of Wages, 1973–
1992: A Semiparametric Approach.” Econometrica 64(5): 1001–44.

Dynan, Karen, Jonathan Skinner, and Stephen Zeldes. 2004. “Do the Rich Save More?” Journal of Political Economy. 112(2): 397-
444.
You can also read