Theoretical discrimination index of postural instability in amyotrophic lateral sclerosis - Nature
←
→
Page content transcription
If your browser does not render page correctly, please read the page content below
www.nature.com/scientificreports
OPEN Theoretical discrimination
index of postural instability
in amyotrophic lateral sclerosis
Rodolphe Vallée1,2, Alexandre Vallée3, Jean‑Noël Vallée1,2,4*, Malek Abidi1,
Annabelle Couillandre1,5, Nicolas Termoz1,5, Pierre‑François Pradat6,7,8,9 &
Giovanni de Marco1,5
To assess the usefulness of a theoretical postural instability discrimination index (PIth) in amyotrophic
lateral sclerosis (ALS). Prospective regression analyzes were performed to identify the biomechanical
determinants of postural instability unrelated to lower limb motor deficits from gait initiation
factors. PIth was constructed using a logit function of biomechanical determinants. Discriminatory
performance and performance differences were tested. Backward displacement of the pression center
(APAamplitude) and active vertical braking of the mass center (Braking-index) were the biomechanical
determinants of postural instability. PIth = − 0.13 × APAamplitude − 0.12 × Braking-index + 5.67, (P < 0.0001,
RSquare = 0.6119). OR (APAamplitude) and OR (Braking-index) were 0.878 and 0.887, respectively,
i.e., for a decrease of 10 mm in APAamplitude or 10% in Braking-index, the postural instability risk was
11.391 or 11.274 times higher, respectively. PIth had the highest discriminatory performance (AUC
0.953) with a decision threshold value ≥ 0.587, a sensitivity of 90.91%, and a specificity of 83.87%,
significantly increasing the sensitivity by 11.11%. PIth, as objective clinical integrator of gait initiation
biomechanical processes significantly involved in dynamic postural control, was a reliable and
performing discrimination index of postural instability with a significant increased sensitivity, and may
be useful for a personalized approach to postural instability in ALS.
Abbreviations
ALS Amyotrophic lateral sclerosis
APA Anticipatory postural adjustment
PIth Theoretical postural instability discrimination index
CoM Center of mass
CoP Center of pressure
Amyotrophic lateral sclerosis (ALS) is a progressive multisystem neurodegenerative disease that inexorably
progresses and primarily affects the pyramidal motor system involving the motor cortex, cranial nerve motor
nuclei and spinal cord motor neurons with additional evidence of non-motor functional i nvolvements1–4. ALS
may cause cognitive-behavioral, extrapyramidal and sensory disturbances by progressive extension of degenera-
tion to the corresponding brain structures. There is accumulating c linical5, neuroimaging6–8 and postmortem
neuro-pathological9 evidence of extrapyramidal involvement in patients with A LS9,10.
In addition to motor weakness and spasticity, extrapyramidal involvement in ALS may contribute to postural
ortality5,10. Postural instabil-
system impairments with risks of falls and fractures affecting quality-of-life and m
ity can be an early functional sign preceding motor weakness, especially in patients with upper motor neuron
1
Interdisciplinary Laboratory in Neurosciences, Physiology and Psychology: Physical Activity, Health and
Learning (LINP2), UPL, Paris Nanterre University, Nanterre, France. 2Laboratory of Mathematics and
Applications (LMA) CNRS, UMR7348, DACTIM‑MIS, Poitiers University, Poitiers, France. 3Clinical Research and
Innovation Department, Foch Hospital, Suresnes, France. 4Neuroradiology Department, Amiens University
Hospital, Picardie Jules Verne University, 80 000 Amiens, France. 5COMUE Paris Lumières University, Paris,
France. 6Neurology Department, Reference Center for Amyotrophic Lateral Sclerosis, APHP, Pitié-Salpêtrière
University Hospital, Paris, France. 7Biomedical Imaging Laboratory, CNRS, INSERM, Sorbonne University, Paris,
France. 8Computational Neuroimaging Group, Trinity College Dublin, Dublin, Ireland. 9Northern Ireland Centre
for Stratified Medicine, Biomedical Sciences Research Institute Ulster University, C-TRIC, Altnagelvin Hospital,
Londonderry, UK. *email: valleejn@gmail.com
Scientific Reports | (2022) 12:2430 | https://doi.org/10.1038/s41598-022-06471-6 1
Vol.:(0123456789)www.nature.com/scientificreports/
predominance, as reported by our team5,11 and o thers10,12,13. Extrapyramidal stiffness is correlated with postural
and balance disorders in ALS patients5. However, the conjunction of motor neuron features as well as potential
extrapyramidal, cerebellar14 and v estibular15 disorders in ALS does not allow an accurate clinical evaluation of
postural instability and gait impairment, which requires quantitative assessment approaches.
Postural stability is the dynamic postural response to applied or volitional perturbations16, and is an essential
component in assessing the effectiveness of interventions to improve balance17,18. Gait initiation is an interesting
pattern to investigate dynamic postural instability related to different neurological disorders such as ALS. It is
the motor transition from standing position to walking. It includes an anticipatory postural adjustment (APA)
phase preceding the swing foot-off, followed by the step execution p hase19,20. APAs result in a backward shift in
the center of pressure (CoP)19 toward the swing leg side, which allows the propelling of the center of mass (CoM)
toward the stance leg side prior to the swing heel-off21,22. APAs create the conditions which act to propel the CoM
forward contributing to body forward progression to reach the intended gait speed at the first step e nd19,23, and
the optimal conditions needed to maintain the stability of the whole body during step execution24–26.
Postural instability is usually assessed clinically using the pull test, which is a common approach in Parkin-
son’s disease27. However, the inter-examiner reliability of pull test may be considered suboptimal relying on
some degree of subjective interpretation by examiners, which may provide an inadequate assessment of postural
instability27.
Clustering is a multivariate technique of grouping individuals sharing similar values across several variables in
which the data is usually not scattered evenly through n-dimensional space but instead forms clusters. Identifying
these clusters may make sense of this clumped data and may provide a deeper understanding of data. Thus, cluster
analysis of subjects across gait initiation and postural instability variables may be regarded as an alternative or
complementary approach to the pull test, to the extent to which methods collecting data may assign the same
score to the same postural instability variable.
The aim of the study was to identify the biomechanical determinants of postural instability unrelated to lower
limb motor deficits from gait initiation factors in ALS. Then with a view to increase discriminatory performance,
according to a personalized approach to postural instability, the purpose was to create a theoretical postural
instability discrimination index (PIth) using multivariable regression models from the identified biomechanical
determinants, evaluate its usefulness and added discriminatory performance value. Finally, to assess the inter-
method reliability between the pull test and clustering of subjects, across the gait initiation and postural instability
variables, in order to highlight clusters of data in relation to postural instability.
Methods
The design of this experimental prospective study was previously d escribed11. 45 subjects were recruited in the
study, 31 patients fulfilling the El Escorial criteria for probable or definite ALS with no motor deficit in the lower
limbs, and 14 age- and gender-matched healthy controls. Of the 31 ALS patients, 14 had postural instability
and 17 had none, based on the clinical pull t est28. The demographic characteristics of the ALS patients are sum-
marized in Table 1. In 5 patients, postural instability and falls were the initial symptoms, 3 of them showing a
neurogenic pattern in the lumbar region at EMG but with no detectable lower limb weakness. The study subjects
(ALS patients and controls) were classified into 2 groups with (14), and without (31) postural instability, based
on the pull test.
The study was approved by the local ethics committee approval Ile-de-France CPI Paris VI, Institut National
pour la Santé et la Recherche Médicale (INSERM): approval number RBM C12-13. All participants gave their
informed written consent in conformity with the Declaration of Helsinki.
Clinical pull test. The pull test execution was standardized and performed by the same experienced neu-
rologist (PFP). The patient was standing with eyes open and feet comfortably apart. The examiner stood behind
the patient and applied a brisk and forceful pull on the patient’s shoulders, while respecting the safety conditions
for the patient, while the examiner stood ready to catch the patient to prevent its fall. The patient had to prevent
himself from falling, if necessary, by taking a step backward after being pulled.
The postural instability scores ranged from 0 to 4 (0: normal recovery; 1: retropulsion, unaided recovery; 2:
no postural response (no recovery), fall if not caught by the examiner; 3: very unstable, tendency to lose balance
spontaneously; 4: unable to stand without assistance).
Score of 1 or more was classified into the postural instability group, and 0, in the group without postural
instability.
Kinematic and kinetic recordings of gait initiation. The gait initiation test was performed in natural
gait conditions using a force plate (0.9 × 1.8 m, AMTI, Advanced Mechanical Technology Inc. Watertown, MA,
USA). Twenty consecutive trials were recorded for each s ubject11. From the biomechanical data records of gait
initiation, accelerations, velocities, displacements of the CoM, and displacements of the foot CoP were com-
puted during the first two s teps19. By convention, accelerations, velocities, and displacements were considered
positive when directed forward, upward, and toward the swing leg side.
Data analysis. The gait initiation biomechanical variables in the APA and execution phases were analyzed.
PAduration (s) was the time between the backward movement start of the CoP and the swing foot-off. EPduration (s)
A
was the time between the swing foot-off and the stance foot-off. A PAamplitude (mm) was the maximal anteropos-
terior backward displacement of the CoP. L (mm) was the anteroposterior step length between the CoP position
at the swing foot-off time and the stance foot-off time. V m (m s−1) was the maximal anteroposterior progression
velocity of the CoM at the end of the first s tep19, V1 (m s−1) and V2 (m s−1), the vertical downward V-shaped speed
Scientific Reports | (2022) 12:2430 | https://doi.org/10.1038/s41598-022-06471-6 2
Vol:.(1234567890)www.nature.com/scientificreports/
Healthy controls ALS with postural instability ALS without postural instability
(n = 14) (n = 14) (n = 17) p value
Age (years) 63.0 (57.0–66.0) 59 (57–62) 58.0 (50.0–64.0) 0.55
Gender (female/male) 5/9 3/11 6/11 0.40
Height (cm) 170 (168–175) 170 (161–176) 171(165–178) 0.51
Weight (kg) 74.5 (66.0–83.7) 67.2 (64.2–85.7) 72.0 (56.0–80.0) 0.79
Disease onset (type)
Postural instability 3 2 0.47
Upper limb weakness N/A 6 10 0.38
Bulbar symptoms 5 5 0.71
ALSFRS-r (max 48) N/A 37.5(35.2–41.0) 4 1.0 (38.0–43.0) 0.09
ALSFRS-R1 bulbar (max 12) 1 1.0 (10.2–12.0) 1 2.0 (07.0–12.0) 0.55
ALSFRS-R2 upper Limb (max 12) 10.0 (07.0–11.0) 08.0 (05.0–11.0) 0.53
ALSFRS-R3 low Limb (max 12) 07.0 (05.2–07.7) 11.0 (09.0–12.0) 0.70
ALSFRS-R4 respiration (max 12) 12.0 (12.0–12.0) 12.0 (12.0–12.0) 0.64
Disease duration (months) N/A 23.5(14.7–37.2) 17.0 (12.0–27.0) 0.20
Disease progression rate (months) N/A 0.44 (0.19–0.78) 0.42 (0.32–0.05) 0.92
Cognitive assessment
California verbal learning test II CVLT II
Immediate recall 07.0 (05.0–08.0) 07.0 (06.0–09.0) 0.79
total trial recall (1–5) 53.5 (51.2–58.7) 57.0 (51.0–63.0) 0.87
Short delay free recall 13.0 (11.2–13.7) 12.0 (11.0–14.0) 0.48
Short delay cued recall N/A 01.5 (01.0–12.0) 02.0 (01.0–04.0) 0.37
Long delay free recall 14.0 (13.0–14.7) 14.0 (13.0–15.0) 0.88
Long delay cued recall 01.5 (01.0–12.7) 01.0 (00.0–02.0) 0.68
Total recognition discrimination 16.0 (16.0–16.0) 16.0 (15.0–16.0) 0.41
Stroop test
Reading 99.0 (87.0–103.0) 98.0 (87.0–109.0) 0.82
Naming N/A 72.0 (63.0–077.0) 70.0 (59.2–74.75) 0.90
Double task 38.0 (31.0–042.0) 37.5 (34.0–43.7) 0.56
Verbal fluency test
Phonemic 22.0 (17.2–27.0) 20.0 (17.0–31.0) 0.85
N/A
Semantic 31.0 (26.0–32.0) 35.0 (22.0–42.0) 0.60
Wisconsin card sorting test
Categories achieved 06.0 (04.0–06.0) 06.0 (05.5–06.0) 0.35
N/A 09.5 (07.0–11.7) 07.0 (05.0–10.5) 0.10
Perseverative errors
03.5 (01.2–06.7) 03.0 (01.0–04.0) 0.21
Digit span
Forward 08.0 (07.0–09.0) 09.0 (07.0–12.0) 0.08
N/A
Backwards 04.5 (04.0–07.0) 06.0 (04.0–08.0) 0.38
Table 1. The demographic and clinical profile of study participants. Values presented as median (range) for
functional scores followed by the minimum and the maximum values. ALSFRS-r: The revised ALS functional
rating scale. N/A: not applicable. Disease progression = (48 − ALSFRS-R scale/disease duration) (Ref. Ferron
et al.11).
of the CoM with the minimal negative falling speed and the reduced falling speed at foot-contact time with the
ground, respectively, during step execution. The Braking-index ×100 (%) characterizes the active braking of the
CoM vertical fall and reflects the dynamic postural control during step execution. A Braking-index below 25%
was considered abnormal.
Statistical analysis. The variables tested were the continuous biomechanical variables of gait initiation
and the postural instability categorical variable dichotomized into with and without postural instability catego-
ries. Mean values and frequencies were expressed with their standard deviations (± SDs) and percentages (%),
respectively.
Differences in values of biomechanical parameters between the subject groups with and without postural
instability were assessed using the non-parametric U Mann–Whitney test for quantitative variables.
Univariate and multivariate multiple regression analyses were performed to evaluate the biomechanical
parameters effects of APA phase on motor performances of step execution.
Scientific Reports | (2022) 12:2430 | https://doi.org/10.1038/s41598-022-06471-6 3
Vol.:(0123456789)www.nature.com/scientificreports/
Postural instability
Without With
Biomechanical parameters Mean Std Dev Mean Std Dev Relative differences (%)* P value**
APAduration (s) 0.566848832 0.061281525 0.641542953 0.086230476 − 13.18 0.0163
EPduration (s) 0.537647635 0.055751953 0.537955033 0.086750354 − 0.05717 0.9772
(APA + EP)duration (s) 1.1044964672 0.0841442296 1.1794979861 0.1300469655 − 06.79 0.1156
APAamplitude (mm) 47.03460265 13.719062151 25.36872678 12.51979091 46.06 0.0003
Vm (m/s) 1.07374776 0.328735433 0.635699222 0.202091494 40.79 0.0004
L (m) 608.3422665 108.137478 448.4566466 96.84432282 26.28 0.0004
V1 (m/s) − 0.15120231 0.0427494097 − 0.100879025 0.0321864512 33.28 0.0015
V2 (m/s) − 0.086672738 0.043742405 − 0.09327473 0.0283038221 − 07.617 0.6678
Braking index (%) 41.384235781 26.021641604 6.7557709681 6.8640314088 83.67 0.0001
PIth − 5.416201044 3.8196657635 1.5574518342 1.9792025093 128,76 0.0001
Table 2. Mean values (± SDs) of biomechanical parameters between the groups with and without postural
instability. *In percentage of biomechanical parameter values without postural instability: ((without – with) /
without) × 100. **U Mann–Whitney test.
Multivariate logistic regression analyses with mixed stepwise selection were performed to identify potential
gait initiation factors that were independently associated with postural instability. The maximum threshold of
the p value was 0.25 for an effect to be able to enter the model during a forward step, and the minimum threshold
was 0.10 for an effect to be removed from the model during a backward step.
Receiver operating characteristic (ROC) analysis was performed for individual gait initiation classifiers
regarding their discriminatory ability for postural instability. For each classifier, the ability of the logistic regres-
sion models to allow discrimination was quantified by the area under the ROC curve (AUC). The maximum
Youden index, J = maxc [Se(c) + Sp(c) − 1], was chosen to determine the optimal decision thresholds (c) for the
discrimination.
PIth was constructed using a multivariable logit function of the biomechanical classifiers of postural instabil-
ity and modeled as follows:
PIth = b0 + b1 X1 + b2 X2 + · · · + bi Xi ,
Xi were the gait initiation classifiers as effects of the model, i, the number of classifiers, bi, the parameters esti-
mated using the maximum likelihood estimation, and P Ith, the maximum likelihood estimate ranging from (−)
infinite to (+) infinite.
Odds ratios with confidence intervals were calculated for the postural instability responses.
For given values of gait initiation parameters, the odds of postural instability were:
Odds postural instability = e(b0 + b1X1 + b2X2 +···+ biXi) = eb0 eb1X1 eb2X2 . . . ebiXi ,
The unit odds ratio for the classifier X
i, the co-variables being determined, was therefore,
OR(Xi ) = eb0 eb1X1 eb2X2 . . . ebi(Xi +1) )/eb0 eb1X1 eb2X2 . . . ebiXi = eb0 eb1X1 eb2X2 . . . ebiXi ebi /eb0 eb1X1 eb2X2 . . . ebiXi = ebi .
Lack-of-fit tests were performed to address whether there was enough information using the selected variables
in the fitted model for postural instability discrimination. The significance of the model effects, as a whole, for the
statistical adjustment of postural instability discrimination was assessed using the likelihood-ratio Chi-square
tests (whole model tests). The usefulness of models was measured by RSquare for logistic regression. The sig-
nificance of the contribution of each effect to the adjustment of the model for postural instability discrimination
was assessed using the effect likelihood ratio tests.
Next, ROC analysis was performed for the P Ith classifier using the logistic regression multivariate effect
likelihood ratio test29 to assess the discriminatory performance (AUC) for postural instability. Differences in
discriminatory performance of classifiers were tested, for significance purposes, by comparing the AUC values
using bivariable Chi2 tests.
K-Means clustering was used to cluster the subjects together that share similar values across the gait initiation
and postural instability variables. The number of clusters, K, was specified a priori. The optimal number of clus-
ters providing the best fit was selected using the highest cubic classification criterion (CCC). The inter-method
reliability between pull test and K-means clustering was assessed using the Kappa statistic.
SAS 9.1 (SAS Institute Inc., Cary, NC) was used for statistical analysis (2-sided and P value < 0.05).
Results
Gait initiation biomechanical parameters. Mean values (± SDs) of biomechanical parameters are
shown in Table 2.
Subjects with postural instability, the values of biomechanical parameters APAamplitude, Vm, L, V1 and Braking-
index were significantly lower (P = 0.0003, 0.0004, 0.0004, 0.0015, and 0.0001, respectively), and A PAduration,
Scientific Reports | (2022) 12:2430 | https://doi.org/10.1038/s41598-022-06471-6 4
Vol:.(1234567890)www.nature.com/scientificreports/
Biomechanical predictors AUC P value Thresholds Sensitivity 1-Specificity
APAamplitude (mm) 0.87097 < 0.0001 ≤ 31.6734 0.8182 (83.87%) 0.1613
Braking index (%) 0.89443 < 0.0001 ≤ 8.04636 0.8182 (83.87%) 0.1613
PIth (%) * 0.95308 < 0.0001 ≥ 0.58689 0.9091 (83.87%) 0.1613
Table 3. Biomechanical classifiers of postural instability. *Theoretical prediction index classifier of postural
instability.
1.00
0.90
0.80
0.70
True Positive rate
0.60
Sensitivity
0.50
0.40
0.30
0.20
0.10
0.00
0.00 0.20 0.40 0.60 0.80 1.00
1-Specificity
False Positive rate
Theoretical prediction index (AUC = 0.953)
Braking-index (AUC = 0.894)
APAamplitude (AUC = 0.871)
Figure 1. Discriminatory performances (AUCs obtained from ROC curves) of the biomechanical classifiers of
gait initiation and the theoretical discrimination index of postural instability ( PIth) classifier, and the differences
in discriminatory performance of classifiers.
significantly higher (P = 0.0163), compared to subjects with no postural instability (Table 2). The decrease in
PAamplitude was significantly associated with a decrease in step length (L) and CoM forward progression velocity
A
(Vm) (P = 0.0041 and < 0.0001, respectively).
Accuracy of individual biomechanical classifiers. The AUCs obtained from ROCs and optimal deci-
sion thresholds for APAamplitude and Braking-index classifiers are shown in Table 3; Fig. 1. The determinants
of postural instability were A
PAamplitude and Braking-index parameters (P < 0.0001, respectively). Their values
significantly decreased by 46.06% and 83.67% (P = 0.0003 and 0.0001), respectively, in subjects with postural
instability compared to those with no postural instability.
Their accuracies were not significantly different (AUC = 0.871, 0.894, respectively, P = 0.82) for postural insta-
bility discrimination. Their optimal decision threshold values for postural instability discrimination were ≤
31.6734 and ≤ 8.04636, respectively, with a sensitivity of 0.8182, and a specificity of 83.87%, respectively.
Multi‑fitted theoretical postural instability discrimination index. PIth was modeled by the equa-
tion:
PIth = −0.13 × APAamplitude − 0.12 × Braking - index + 5.67;
with P < 0.0001 and RSquare = 0.6119 for the whole-model effects, P = 0.9975 for the lack of fit Chi-square of the
whole-model, and P = 0.0200, 0.0235 and 0.0156 for the parameter estimates and intercept, respectively.
PIth value significantly increased by 128.76% (P < 0.0001) in subjects with postural instability compared to
those with no postural instability (Table 2). The contribution of each effect A
PAamplitude and Braking-index in the
adjustment of the model for postural instability discrimination was significant (P = 0.0016 and 0.0005, respec-
tively). The unit odds ratios OR (APAamplitude) and OR (Braking-index) for postural instability were 0.8779 (95%
CI 0.7593; 0.9591) and 0.8870 (95% CI 0.7745; 0.9611), respectively.
Accuracy of the theoretical discrimination index classifier and discriminatory performance dif‑
ferences of classifiers for postural instability. The optimal decision threshold value of PIth for postural
Scientific Reports | (2022) 12:2430 | https://doi.org/10.1038/s41598-022-06471-6 5
Vol.:(0123456789)www.nature.com/scientificreports/
Cluster means
Cluster Postural instability APAamplitude (mm) Braking index (%)
1 0 45.445855 16.5675477
2 1 24.736571 6.35800396
3 0 48.342983 61.8215083
Table 4. K-Means clustering method. K cluster = 3, CCC best = 4.82779, Step = 5 Eigenvalues 2.996682,
0.5347658, 0.4685522, 0
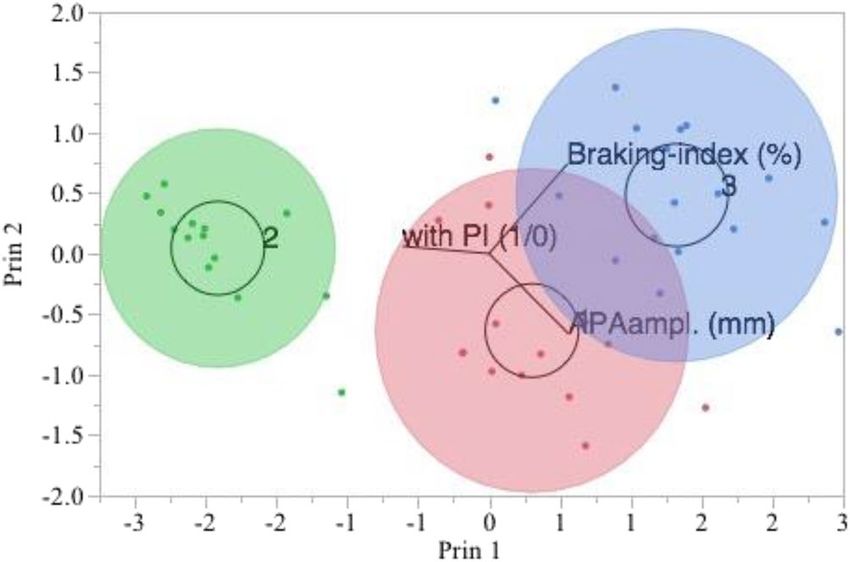
Figure 2. K-Means clustering method. Biplot for parameters of gait initiation and postural instability. Clusters
2, based on the parameters of gait initiation ( APAamplitue and Braking-index) and postural instability, stands out
from the others. This is supported by its parallel coordinate plot in Fig. 3(2), which differs from the plots for the
other clusters.
instability discrimination was ≥ 0.58689 (P < 0.0001), with a sensitivity of 90.91%, and a specificity of 83.87%,
calculated with the optimal decision threshold values of parameters A PAamplitude and Braking-index (Table 3).
PIth had the highest discriminatory performance with significantly higher accuracy than the classifiers
APAamplitude and braking-index (AUC = 0.953 versus 0.871 and 0.894; P < 0.001 and 0.02, respectively), thus sig-
nificantly increasing the sensitivity of discriminatory performance by 11.11%, i.e., from 81.82 to 90.91% (Table 3;
Fig. 1).
Pull test and K‑means cluster analysis. K-means clustering across the gait initiation and postural insta-
bility variables was implemented with 3 clusters providing the best fit with the optimal CCC value of 4.85. It
highlighted a subject cluster with postural instability and low values of A
PAamplitude and Braking-index param-
eters appearing to be be standing out from others (Table 4; Figs. 2, 3). Agreement between K-means clustering
and pull test was complete with Kappa coefficient of 1.
Discussion
Identifying and measuring the biomechanical determinants of postural instability from gait initiation factors can
provide clinicians with objective measures to assess the effectiveness of rehabilitation programs and better target
interventions, according to individual impairments. Determining the equations of logit functions of gait initia-
tion determinants, using multivariate logistic regression models was aimed in order to model the probabilities
of having postural instability. The stepwise variable selection procedure was used to interactively select a subset
of variables which provide a good fit for the model, given there is little theory in literature to guide the selection
of terms of a model for postural instability discrimination. The chosen direction of variable selection that enter
and leave the model was a mixed direction that alternates the forward and backward steps. It includes the most
significant term that satisfies the maximum p-value threshold and removes the least significant term satisfying
the minimum P value threshold. It continues removing terms until the remaining terms are significant and then
it changes to the forward direction.
To improve model discriminatory performance, the classifier combination strategy assumed conditional
independence of the classifiers for the purpose of designing a theoretical discrimination index. It was based
on the calculation of a combined ROC curve using the logistic regression multivariate effect likelihood ratio
tests to determine a combination rule for each ROC operating point, which improved model discriminatory
performance the most. The strategy was to reduce the variance caused by estimating unnecessary variables,
thus reducing the number of variables in the model without significantly losing information from the whole
Scientific Reports | (2022) 12:2430 | https://doi.org/10.1038/s41598-022-06471-6 6
Vol:.(1234567890)www.nature.com/scientificreports/
Figure 3. K-Means clustering method. Parallel coordinate plots for the display of the structure of the
observations in each cluster showing how the clusters differ. Cluster 2 tends to have comparatively low
APAamplitude and Braking-index values and postural instability
variables studied; in other words, without significantly reducing the variance in postural instability explained
by the whole variables studied.
Therefore, multi-fitted theoretical discrimination index of postural instability ( PIth) was designed as a theoreti-
cal integrator of the biomechanical determinants of postural instability, from gait initiation factors in the APA
and execution phases, to increase discriminatory performance of postural instability. It was conceived on the
basis of a nomogram of the postural instability established from the whole study population in the perspective
of personalized approach of postural instability in ALS.
Statistical convergence for this model was achieved. The whole model effect was significant for postural insta-
bility discrimination (P < 0.0001) and useful (RSquare = 0.6119), which supported the conclusion that the model
significantly reflected the gait initiation variables globally by fitting the variables APAamplitude and Braking-index.
In addition, the test of lack-of-fit Chi-square for the whole model showed a large P value (P = 0.617) and did not
conclude that there was a significant lack of fit for this model. This supported the conclusion that the selected
terms from the mixed stepwise selection provided enough information to the fitted model, and there was little
to be gained by introducing additional terms in the model, such as using polynomials or crossed terms. This
was corroborated with the significant contribution of each of the effects of APAamplitude and Braking-index to the
fit of the model (P = 0.0016 and 0.0005, respectively). This shows that the biomechanical parameters A PAamplitude
and Braking-index each contributed significantly and usefully to the improvement of the model’s performance
for postural instability discrimination.
The regressors for APAamplitude and Braking-index were negative, indicating that as the APAamplitude or braking-
index decreased, the probability of postural instability increased. Thus, for a 10 mm decrease in A PAamplitude or
a 10% decrease in Braking-index, the odds of postural instability were 11.4 and 11.3 times, respectively, higher
than the odds of no postural instability.
The area under ROC curve (AUC), referred to as an index of accuracy, is a measure of performance for a ROC
curve. It was used to quantify how accurately the classifiers APAamplitude, Braking-index and PIth can discriminate
between the state of two patients, referred to as "postural instability" and "no postural instability". It was the
probability that a subject with postural instability, randomly chosen, is ranked as more likely to have postural
instability than a subject without postural instability randomly chosen, based on nonparametric Mann–Whitney
U statistics used in calculating AUC.
The theoretical discrimination index of postural instability ( PIth) showed the highest discriminatory perfor-
mance (AUC= 0.953). It significantly increased the sensitivity, that is the probability that the classifier correctly
discriminates a postural instability condition that exists, while maintaining the specificity, which is the prob-
ability that the classifier correctly discriminates that a condition of postural instability does not exist. This was
consistent with the aim of our study. Indeed, a false negative discrimination may have different consequences
than false positive ones. Increasing sensitivity for postural instability discrimination has the advantage of initiat-
ing appropriate treatment and rehabilitation in a greater number of ALS patients who will have a condition of
postural instability. This will also lower the possibility of falls and fractures with the acceptable risk of initiating
treatment and rehabilitation in some patients who would not have needed it due to false positives. Moreover,
maintaining specificity has the advantage of not increasing the unacceptable risk of not starting a rehabilitation
program in some patients who will have a postural instability condition, due to false negatives. Not treating
Scientific Reports | (2022) 12:2430 | https://doi.org/10.1038/s41598-022-06471-6 7
Vol.:(0123456789)www.nature.com/scientificreports/
those patients who would have needed it would imply serious and costly consequences due to falls and fractures,
impacting the quality of life.
Throughout our study, the theoretical discrimination index ( PIth) reliability depended on the reliability of
the pull test and gait initiation biomechanical data. Variability in pull test performance can lead to inadequate
evaluation of postural instability27. Indeed, a s tudy27 on postural instability assessment in Parkinson’s disease
reported that specific aspects of pull test were incorrectly performed regarding the position in 27.3%, strength and
briskness of the pull in 84.9%, examiner’s response in 36.4%, and technique issues in 9.1%. This study r eported27
that 77.3% of patients with early Parkinson’s disease were pulled too lightly, underestimating the deficit with
possible bias in the score, especially between 0 and 1. Furthermore, the number of steps backward to differenci-
ate a normal recovery response from retropulsion was not being clearly defined, postural stability score was not
easily interpreted, especially to differentiate the scores 1 and 2 27.
In our study, neurological assessment including pull test execution was standardized and performed by the
same highly experienced neurologist examiner (PFP). For a successful execution of the pull test, the patients had
sufficient space to move backward and assume an upright position that enabled a rapid corrective repositioning.
Doing so, this avoided any attitude that could neutralize the pull before it was carried out, such as leaning forward
or excessively widening the position of the feet. Consequently, the pulling force had not subjectively anticipated
the postural instability degree. It was suitably adapted to the height and weight of the subjects to move the CoM
to the point of compromising postural stability and requiring corrective trunk movements with a maximum of
two steps backward for r ecovery27. Thus, the reliability between the pull test and K-means clustering of subjects
across gait initiation biomechanical variables and postural instability was complete. This represented the extent
to which the data collected in the study constituted correct and reliable representations of the variables measured.
During gait initiation, the anticipatory postural adjustments induce the CoP displacement backward rela-
tive to CoM, and toward the swing leg, which generates an imbalance which allows to initiate the CoM forward
movement from the static posture30,31. The CoM forward movement is oriented in the direction of the stance
leg32 to counterbalance prior to step e xecution24,33,34. Thus, the magnitude of imbalance plays an essential role
in the regulation of global gait initiation k inematic24,30,31, as it creates the anticipatory conditions to propel the
CoM forward19,23 while maintaining the stability during the step execution35–37. Our study showed that the CoP
backward displacement, A PAamplitude, was significantly associated with the motor performances in terms of step
length and CoM forward progression velocity, and with the occurrence of postural instability in ALS patients.
The shorter the magnitude of backward displacement of the CoP, the lower the step length and forward progres-
sion velocity, and the greater the risk of postural instability.
During step execution, the CoM is propelled forward to step forward, and out of the base of support23,38. The
base of support is reduced by the act of lifting the swinging foot from the ground. The gap between the CoM
and the CoP generates a disequilibrium which accelerates the CoM movement forward and downward39 in the
direction of the swing leg. The CoM vertical downward velocity is actively braked before the foot contact with
the ground33,40 by the increase in antigravity activity of the stance leg soleus m uscle30,31. This reduces the bodily
stress of the impact of the swing leg with the ground and maintains postural stability during the subsequent
double stance phase41. Our study showed the CoM active vertical braking, or Braking-index, was significantly
associated with the occurrence of postural instability in ALS patients. The greater the deterioration in active
vertical braking, the greater the postural instability risk.
Thus, theoretical discrimination index ( PIth) combines the CoP backward displacement ( APAamplitude) and
CoM active vertical braking (Braking-index), which were independent underlying biomechanical mechanisms
of gait initiation, significantly involved in dynamic postural control and the occurrence of postural instability
in ALS patients.
In our study, the gait initiation impairment in ALS patients did not stem from a decrease in muscle strength of
the lower limbs, as the manual muscle tests revealed no significant differences between subjects with and without
postural instability. However, patients with postural instability had increased muscle tone which can contribute
to slow the CoM forward propulsion and deteriorate the dynamic postural stability during gait i nitiation11. Some
studies showed in patients with progressive supranuclear p alsy41, or Parkinson d isease42 that increased muscle
tone with stance leg muscle stiffness can impairegait initiation, and be partly responsible of an unstable state.
A limitation of this study was that we excluded patients with motor deficit in the lower limb that is a major
cause of postural instability in ALS patients. We focused on other underlying mechanisms that are possibly of
extrapyramidal5,10, cerebellar14, and vestibular15 origin. Consequently our model is applicable only in patients with
a deficit limited in the upper limb and/or bulbar regions. Another limitation was that our model did not allow
to discriminate between an extrapyramidal or pyramidal origin of the instability, and that we lack longitudinal
data to validate whether our model can predict the occurrence and frequency of falls as well as the pull test.
Conclusion
The theoretical postural instability discrimination index, designed as an integrator of the gait initiation biome-
chanical processes, significantly involved in dynamic postural control, was reliable and effective with a significant
increased sensitivity in ALS patients. This, without reducing its specificity, which is key in view of the conse-
quences of instability in terms of falls and fractures with repercussions on the quality of life. The importance of
inter-method reliability between pull test and cluster analysis across the gait initiation and postural instability
variables, represented the extent to which methods of data collecting in the study constituted correct representa-
tions of the variables measured.
This work is of significant clinical interest by offering an objective and measurable clinical index of physi-
cal and pathophysiological processes of postural instability in ALS. This may also be a useful complementary
expertise in these patients for a personalized approach to postural instability.
Scientific Reports | (2022) 12:2430 | https://doi.org/10.1038/s41598-022-06471-6 8
Vol:.(1234567890)www.nature.com/scientificreports/
Received: 1 April 2021; Accepted: 31 January 2022
References
1. Turner, M. R. et al. Controversies and priorities in amyotrophic lateral sclerosis. Lancet Neurol. 12, 310–322 (2013).
2. Grossman, M. Amyotrophic lateral sclerosis—a multisystem neurodegenerative disorder. Nat. Rev. Neurol. 15, 5–6 (2019).
3. Hardiman, O. et al. Amyotrophic lateral sclerosis. Nat. Rev. Dis. Primers 3, 17071 (2017).
4. Calvo, A. et al. Parkinsonian traits in amyotrophic lateral sclerosis (ALS): A prospective population-based study. J. Neurol. 266,
1633–1642 (2019).
5. Pradat, P.-F. et al. Extrapyramidal stiffness in patients with amyotrophic lateral sclerosis. Mov. Disord. 24, 2143–2148 (2009).
6. Przedborski, S. et al. Nigrostriatal dopaminergic function in familial amyotrophic lateral sclerosis patients with and without cop-
per/zinc superoxide dismutase mutations. Neurology 47, 1546–1551 (1996).
7. Takahashi, H. et al. Evidence for a dopaminergic deficit in sporadic amyotrophic lateral sclerosis on positron emission scanning.
Lancet 342, 1016–1018 (1993).
8. Vogels, O. J., Oyen, W. J., van Engelen, B. G., Padberg, G. W. & Horstink, M. W. Decreased striatal dopamine-receptor binding in
sporadic ALS: Glutamate hyperactivity?. Neurology 52, 1275–1277 (1999).
9. Iwanaga, K. et al. Neuropathology of sporadic amyotrophic lateral sclerosis of long duration. J. Neurol. Sci. 146, 139–143 (1997).
10. Desai, J. & Swash, M. Extrapyramidal involvement in amyotrophic lateral sclerosis: Backward falls and retropulsion. J. Neurol.
Neurosurg. Psychiatry 67, 214–216 (1999).
11. Feron, M. et al. Extrapyramidal deficits in ALS: A combined biomechanical and neuroimaging study. J. Neurol. 265, 2125–2136
(2018).
12. Krieg, I., Dalin, D., Heimbach, B., Wiesmeier, I. K. & Maurer, C. Abnormal trunk control determines postural abnormalities in
Amyotrophic Lateral Sclerosis. NeuroRehabilitation 44, 599–608 (2019).
13. D’Ascenzo, C. et al. Parkinson-like features in ALS with predominant upper motor neuron involvement. Amyotroph. Lateral Scler.
13, 137–143 (2012).
14. Sanjak, M. et al. Vestibular deficits leading to disequilibrium and falls in ambulatory amyotrophic lateral sclerosis. Arch. Phys.
Med. Rehabil. 95, 1933–1939 (2014).
15. Prell, T. & Grosskreutz, J. The involvement of the cerebellum in amyotrophic lateral sclerosis. Amyotroph. Lateral Scler. Frontotem-
poral. Degener. 14, 507–515 (2013).
16. Prieto, T. E., Myklebust, J. B. & Myklebust, B. M. Characterization and modeling of postural steadiness in the elderly: A review.
IEEE Trans. Rehabil. Eng. 1, 26–34 (1993).
17. Horak, F. B. Clinical assessment of balance disorders. Gait Posture 6, 76–84 (1997).
18. Chaudhry, H. et al. Measures of postural stability. J. Rehabil. Res. Dev. 41, 713–720 (2004).
19. Brenière, Y., Cuong Do, M. & Bouisset, S. Are dynamic phenomena prior to stepping essential to walking?. J. Mot. Behav. 19, 62–76
(1987).
20. Brunt, D., Liu, S. M., Trimble, M., Bauer, J. & Short, M. Principles underlying the organization of movement initiation from quiet
stance. Gait Posture 10, 121–128 (1999).
21. Jian, Y., Winter, D., Ishac, M. & Gilchrist, L. Trajectory of the body COG and COP during initiation and termination of gait. Gait
Posture 1, 9–22 (1993).
22. Elble, R. J., Moody, C., Leffler, K. & Sinha, R. The initiation of normal walking. Mov. Disord. 9, 139–146 (1994).
23. Lepers, R. & Brenière, Y. The role of anticipatory postural adjustments and gravity in gait initiation. Exp. Brain Res. 107, 118–124
(1995).
24. Yiou, E., Caderby, T., Delafontaine, A., Fourcade, P. & Honeine, J.-L. Balance control during gait initiation: State-of-the-art and
research perspectives. World J. Orthop. 8, 815–828 (2017).
25. Yiou, E., Caderby, T. & Hussein, T. Adaptability of anticipatory postural adjustments associated with voluntary movement. World
J. Orthop. 3, 75–86 (2012).
26. Caderby, T. et al. Effects of changing body weight distribution on mediolateral stability control during gait initiation. Front. Hum.
Neurosci. 11, 127 (2017).
27. Munhoz, R. P. et al. Evaluation of the pull test technique in assessing postural instability in Parkinson’s disease. Neurology 62,
125–127 (2004).
28. Movement Disorder Society Task Force on Rating Scales for Parkinson’s Disease. The Unified Parkinson’s Disease Rating Scale
(UPDRS): Status and recommendations. Mov. Disord. 18, 738–750 (2003).
29. Haker, S. et al. Combining classifiers using their receiver operating characteristics and maximum likelihood estimation. Med.
Image Comput. Comput. Assist. Interv. 8, 506–514 (2005).
30. Honeine, J.-L., Schieppati, M., Gagey, O. & Do, M.-C. By counteracting gravity, triceps surae sets both kinematics and kinetics of
gait. Physiol. Rep. 2, e00229 (2014).
31. Delafontaine, A., Gagey, O., Colnaghi, S., Do, M.-C. & Honeine, J.-L. Rigid ankle foot orthosis deteriorates mediolateral balance
control and vertical braking during gait initiation. Front. Hum. Neurosci. 11, 214 (2017).
32. Mille, M.-L., Simoneau, M. & Rogers, M. W. Postural dependence of human locomotion during gait initiation. J. Neurophysiol.
112, 3095–3103 (2014).
33. Lyon, I. N. & Day, B. L. Control of frontal plane body motion in human stepping. Exp. Brain Res. 115, 345–356 (1997).
34. Honeine, J.-L., Schieppati, M., Crisafulli, O. & Do, M.-C. The neuro-mechanical processes that underlie goal-directed medio-lateral
APA during gait initiation. Front. Hum. Neurosci. 10, 445 (2016).
35. Hiraoka, K., Matuo, Y., Iwata, A., Onishi, T. & Abe, K. The effects of external cues on ankle control during gait initiation in Par-
kinson’s disease. Parkinson. Relat. Disord. 12, 97–102 (2006).
36. Aruin, A. S. Enhancing anticipatory postural adjustments: A novel approach to balance rehabilitation. J. Nov. Physiother. 6, 25
(2016).
37. Ueno, E., Yanagisawa, N. & Takami, M. Gait disorders in parkinsonism. A study with floor reaction forces and EMG. Adv. Neurol.
60, 414–418 (1993).
38. Breniere, Y., & Do, M. C. A biomechanical study of the gait initiation process. A biomechanical study of the gait initiation process.
Epub 1981.
39. Winter, D. A. A.b.c Anatomy, Biomechanics, Control of Balance During Standing and Wa Lking (Waterloo Biomechanics, 1995).
40. Lyon, I. N. & Day, B. L. Predictive control of body mass trajectory in a two-step sequence. Exp. Brain Res. 161, 193–200 (2005).
41. Welter, M.-L. et al. Control of vertical components of gait during initiation of walking in normal adults and patients with progres-
sive supranuclear palsy. Gait Posture 26, 393–399 (2007).
42. Chastan, N. et al. Gait and balance disorders in Parkinson’s disease: Impaired active braking of the fall of centre of gravity. Mov.
Disord. 24, 188–195 (2009).
Scientific Reports | (2022) 12:2430 | https://doi.org/10.1038/s41598-022-06471-6 9
Vol.:(0123456789)www.nature.com/scientificreports/
Acknowledgements
The authors are grateful for the generosity of all patients and healthy controls who participated in this research
study. We also acknowledge Nadine Le Forestier, Maria del Mar Amador, Timothee Lenglet, Gaelle Bruneteau,
François Salachas, Maryse Féron and Eya Mseddi for their assistance in data recording and monitoring the
patients and Athéna Lallouette for the methodologic assistance and english review.
Author contributions
Research project: R.V., P.F.P., G.M.: conception, M.A., A.C., N.T., P.F.P., G.M.: organization, M.A., A.C., N.T.,
P.F.P., G.M.: execution; statistical analysis: R.V.: design, R.V.: execution, A.V., J.N.V., G.M.: review and critique;
manuscript: R.V.: writing of the first draft, A.V., J.N.V., G.M., P.F.P.: review and critique.
Funding
This study was funded by a grant from the Association for Research on ALS (ARSLA) and the Institut
National pour la Santé et la Recherche Médicale (INSERM), and the program “Investissements d’avenir”
ANR-10-IAIHU-06.
Competing interests
The authors declare no competing interests.
Additional information
Correspondence and requests for materials should be addressed to J.-N.V.
Reprints and permissions information is available at www.nature.com/reprints.
Publisher’s note Springer Nature remains neutral with regard to jurisdictional claims in published maps and
institutional affiliations.
Open Access This article is licensed under a Creative Commons Attribution 4.0 International
License, which permits use, sharing, adaptation, distribution and reproduction in any medium or
format, as long as you give appropriate credit to the original author(s) and the source, provide a link to the
Creative Commons licence, and indicate if changes were made. The images or other third party material in this
article are included in the article’s Creative Commons licence, unless indicated otherwise in a credit line to the
material. If material is not included in the article’s Creative Commons licence and your intended use is not
permitted by statutory regulation or exceeds the permitted use, you will need to obtain permission directly from
the copyright holder. To view a copy of this licence, visit http://creativecommons.org/licenses/by/4.0/.
© The Author(s) 2022
Scientific Reports | (2022) 12:2430 | https://doi.org/10.1038/s41598-022-06471-6 10
Vol:.(1234567890)You can also read