TIME AN INTERIM REPORT INTO WAGE THEFT AND UNDERPAYMENT OF CASUAL ACADEMICS AT THE UNIVERSITY OF SYDNEY
←
→
Page content transcription
If your browser does not render page correctly, please read the page content below

A L I N G ST E A L I N G
T E A L I N G ST E
ME TIME TIME TIME TIM
                                           E
  AN INTERIM REPORT INTO WAGE THEFT AND UNDERPAYMENT
    OF CASUAL ACADEMICS AT THE UNIVERSITY OF SYDNEY
The University of Sydney occupies land belonging to the Gadigal People of
the Eora Nation. The USyd Casuals Network acknowledges the ongoing strug-
gle facing Aboriginal and Torres Strait Islander communities in the fight for
self-determination. The USyd Casuals Network recognises that our access to
the University of Sydney is a privilege afforded only by the continued coloni-
sation of First Nations People. We pay our deepest respects to the traditional
custodians of the land, as well as elders past, present, and emerging.

This report was produced by the University of Sydney (USyd) Casuals Network, October 2020.
For media enquiries and further information please contact:
contact@usydcasuals.network

The USyd Casuals Network is a group of casual academics and general staff at the
University of Sydney working together to improve conditions for casuals.

Follow the USYD Casuals Network on:
Website: http://usydcasuals.network
Twitter: @CasualsUsyd
Main Facebook Page: https://www.facebook.com/usydcasualsnetwork
Casual Humans of Higher Education Facebook Page:
https://www.facebook.com/casualhumans/

Authors and Acknowledgements
All co-authors are members of the University of Sydney Casuals Network and the National
Tertiary Education Union.

Main co-authors: Georgia Carr, Yaegan Doran, Nicholas Avery, Robert Boncardo, Hannah Gil-
lard, Joel Griggs, Lucinda Nicolls, Micaela Pattison
Editing: Toby Fitch
Report design: Izabella Nantsou
Imagery supplied by: USyd Casuals Network, Honi Soit, ‘Staff & Students Say NO CUTS’ Face-
book page, and Iconfu

Report Citation:
Carr, G., Doran, Y., Avery, N., Boncardo, R., Gillard, H., Griggs, J., Nicolls, L., Pattison, M. (2020).
Stealing Time: An Interim Report into Wage Theft and Underpayment of Casual Academics at
the University of Sydney. New South Wales: University of Sydney Casuals Network.
https://usydcasuals.network/s/Stealing-Time_Wage-Theft-Report_2020.pdf

We would like to thank Natalia Maystorovich Chulio, Dani Cotton and Marlena Lutz-Hughes for
their work on this report, as well as an anonymous casual university worker for their assistance
with our data management.

We would also like to thank the participants of this study for the time they spent filling in this
audit — the irony of asking you to spend unpaid time logging unpaid work is not lost on us.

TABLE OF CONTENTS
      Key Findings          5

      Executive Summary     6

      Introduction          8

      Methodology           10

      Demographics          12

      Results               14

      Data validation       30

      Summary and Demands   33

      References            35
KEY FINDINGS
For this report, 19 participants audited 28 contracts across 3 faculties and one cen-
tre.

84%
               of participants                 Their stolen wages totaled $47,897
               performed unpaid                over a six week period, or a mean
               work during the audit.          of $2521 per person.

               STOLEN WAGES
               The highest amount of stolen wages for one person
               was $11,469.

                       STOLEN TIME
                       Participants performed 753 hours of unpaid work
                       over a six week period. This is equivalent to each per-
                       son working one day (6.6 hours) unpaid every week.

                                   GENDER IMPACT
                                   On average, women had 2.5 times the amount
                                   of wages stolen compared to men ($3837 vs.
                                   $1541).

               On average, for every dollar casuals were paid, they were not paid 75
               cents. This is equivalent to 43% of work going unpaid, or someone in a 9-to-5
               job not being paid for work performed after 1:30pm. The participant with the
               highest rate of wage theft was not paid for more than two thirds (69%)
               of their work, equivalent to someone in a 9-to-5 job not being paid for work
               performed after 11:30am.

               On average, participants were given only 48 minutes per week to complete
               all administrative tasks, yet reported working six times more than this at a
               mean of 4.8 hours per week on administration, resulting in underpayment of
               $1595 per person across the six weeks.

                                                                                              5
Casual workers are the most precariously employed workers in

EXECUTIVE SUMMARY
                    universities. Yet universities rely on casual workers to perform core
                    duties. This is because they are a cheaper option than permanent
                    staff due to their being hired on short, piecemeal contracts. The
                    nature of these casual contracts, and the limitations of the Enter-
                    prise Agreement, allow universities to significantly underpay casual
                    workers for the work they do.

                    This interim report captures a snapshot of the wage theft that re-
                    sults from this underpayment at the University of Sydney. It reports
                    on a detailed tracking of hours worked by 19 casuals over the first
                    six weeks of semester 2, 2020, and compares this with the hours
                    that casuals are paid for under the Enterprise Agreement. This is
                    part of a larger audit of underpayment at the University that will
                    be reported at the end of Semester 2.

                    The audit found that 84% of participants performed unpaid work
                    during the first six weeks of semester. The mean underpayment
                    was $2521 per person, with one participant reporting $11,469 of
                    stolen wages. This amounts to significant wage theft at the Universi-
                    ty of Sydney. In terms of time, participants performed 753 hours
                    of unpaid work compared to 1230 hours of paid work — equiv-
                    alent to each person working close to one day a week (6.6 hours)
                    unpaid.

                    On average, for every dollar paid to casual workers in the au-
                    dit, they were not paid 75 cents. This is the equivalent of being
                    paid for only 57% of the work done. Women reported having
                    2.5 times more stolen wages than men (mean $3837 vs $1541).
                    This is partly accounted for by women in the audit holding more
                    contracts for longer hours, but it also occurs because women were
                    underpaid at a higher rate: for every dollar paid they were not
                    paid 98 cents, compared to 57 cents for men.

                    The mean underpayment for lecturing was $150 per person
                    per week, with only a single participant managing to complete
                    the work required of them within the hours set by the Enterprise
                    Agreement. The mean underpayment for tutoring was $142 per
                    person per week. The most egregious underpayment occurred
                    for administration. On average, participants were given only 48
                    minutes per week to complete all administrative tasks, yet report-
                    ed working six times more than this at a mean of 4.8 hours per
                    week on administration, resulting in administration underpayment
                    of $1595 per person across the six weeks.
                                                                                            6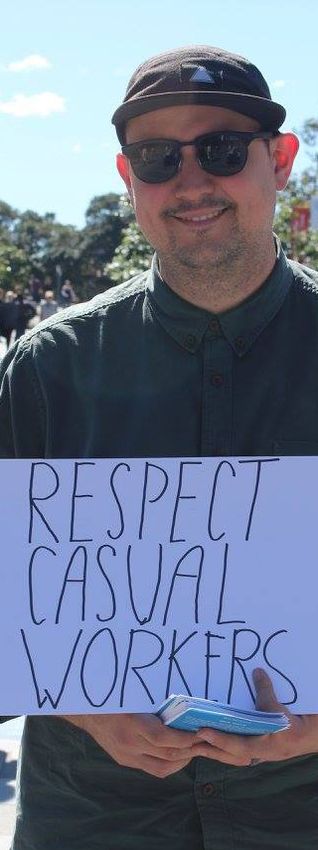
These results reflect systemic wage theft at the University of Sydney. Over the past three de-
cades, The University of Sydney has increasingly relied on casual labour to do its core work.
However as this report makes clear, this has only been possible because The University of Syd-
ney does not pay its casual workers for all of the work they do.

Importantly, this report corroborates what has been found in other research. Publications in
peer-reviewed journals, research from academic staff across numerous universities, and reports
from trade union experts all reach the same conclusion: wage theft is rife at Australian univer-
sities. This report is therefore not standalone. It sits within a body of research which consistently
finds that university staff are not paid for all the work they perform, with casuals the most ex-
ploited. The findings of this report should not be viewed as a self-contained problem for a small
handful of staff, but as more evidence of the sector-wide and systemic exploitation of precari-
ous university workers.

                                                                                                    7
Welcome to the USyd Casuals Network and the NTEU’s interim
               report on wage theft and underpayment of casualised staff at the
               University of Sydney.

               In the past three decades, the number of staff employed on a
               casual basis in Australia’s tertiary education sector has increased
               dramatically. Currently, up to 70% of staff at some universities are
               precariously employed (Hill, Smithers and Spina, 2020). As uni-
               versity workforces have become ever more precarious, casualised
INTRODUCTION
               staff and the NTEU have issued numerous warnings about their poor
               working conditions. In particular, they have noted that the wages
               they are paid typically fail to capture the amount of work they
               are required to do - either because they are not paid the rates
               that are mandated in their Enterprise Agreements, and/or because
               those rates do not realistically reflect the time it takes to perform
               contracted tasks. In vindication of casuals’ claims, in recent months
               no fewer than ten Australian universities have been forced to repay
               casualised staff previously unpaid wages (Duffy, 2020a). At the
               University of Sydney, in August this year management admitted to
               underpaying casualised professional staff almost $9 million (Baker
               2020). In the same month, another of Australia’s wealthiest universi-
               ties, the University of Melbourne, agreed to repay almost $6 mil-
               lion in unpaid wages to casualised academic staff (Duffy, 2020b).
               Despite this, university managements across the country continue
               to deny that underpayment is a systemic problem for their casual
               employees.

               There is nevertheless a growing body of anecdotal and indicative
               evidence that suggests that wage theft is endemic to Australian uni-
               versities. As we explore in greater detail below, surveys carried out
               by the NTEU and other casuals networks point toward underpay-
               ment being part of the structure of the tertiary education sector and
               its workforce, and not an accidental feature (NTEU 2019, UNSW
               Casuals Network 2020). At the University of Sydney, the experience
               of permanent, fixed-term and casualised staff is reflective of these
               broader trends. With regard to permanent and fixed-term staff,
               the NTEU’s 2019 FASS Staff Workload Survey showed that the ma-
               jority of staff were forced to work more than 50 hours per week,
               as opposed to 37.5 hours as enshrined in the Enterprise Agreement
               (NTEU, 2019). As for casualised staff, the USyd Casuals Network’s
               report Overworked and Worked Over: Casual Academics Bear the
               Costs of COVID-19 showed that in Semester One 2020, casualised
               staff performed an average of 50 hours of unpaid work (USyd
               Casuals Network 2020).
                                                                                   8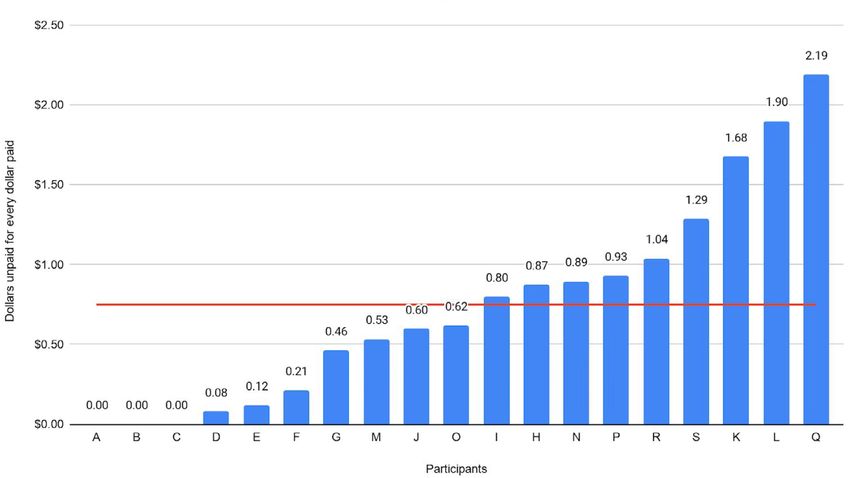
This semester, the USyd Casuals Network and the NTEU set out to build a more detailed picture
of underpayment of casualised staff at the University of Sydney by conducting a rigorous audit.
The current document is an interim report on our results, capturing data from the first six weeks
of Semester 2, 2020. As we explain in detail below, participants were asked to keep a regular
record of work performed throughout the semester, including any unpaid work. Our aim was to
determine the nature of underpayment at the University among casualised staff and to better
understand its root causes. Put simply, our report shows that for the vast majority of the staff who
participated in our audit, wage theft is a daily reality, one that is more than likely shared by
similarly casualised workers across the University. While our study is small — though the number
of data points it contains is extensive — its results reinforce what we already know from other
evidence about exploitation in the university sector. At the end of this interim report, we make a
number of summational observations and issue five demands to immediately address this serious
problem.

The more that university workers have studied the issue of wage theft, the more it has been
revealed as one of the sector’s most enduring, but also shameful, features. We have written this
report in the hope that the time will come when the weight of evidence will finally become a cat-
alyst for enduring and systemic change.

                                                                                                  9
Study design
              The purpose of this audit is to accurately quantify the amount of
              underpayment, i.e. wage theft, experienced by a cohort of casual
              employees of the University of Sydney during Semester 2, 2020,
              and to investigate the ways in which wage theft varied in this sample
              across gender and job task. To do this, members of the USyd Casuals
              Network designed an audit spreadsheet in consultation with our local
              branch of the National Tertiary Education Union. Principally, the audit
METHODOLOGY
              captured weekly data for each participant on:

                 1. The number of hours contracted to work;
                 2. The number of hours actually worked; and
                 3. An automatic calculation of the difference between (1) and (2),
                    both in hours and in dollars of underpayment.

              Data was entered according to job title and pay code, as set out in
              the ‘University of Sydney Enterprise Agreement 2018–2021’ (CPSU
              NSW, 2018). The audit template could be used equally by teaching
              staff, research assistants, those performing clinical hours, and those
              performing musical accompaniment. It sought granular data on the
              hours worked for each participant for individual contracts and under
              the relevant pay code (e.g. first lecture, repeat lecture, administra-
              tion).

              Recruitment
              Participants were recruited through mailing lists, at union meetings
              and in person through an on-campus stall. After signing up to the
              audit, participants were given a copy of the audit spreadsheet to
              record their hours via Dropbox. Each Dropbox folder was shared only
              with that person, so participants could not access or edit the data of
              others in the audit. Participants were provided with written instruc-
              tions, as well as a series of instructional videos. Members of the USyd
              Casuals Network also ran drop-in sessions via Zoom for participants
              to ask questions or seek help auditing their hours. Participants also
              received weekly reminders to log their hours via email.

              Scope of the report
              Herein we present our mid-semester findings, from weeks 1 through 6.
              We include only participants who audited at least 3 out of 6 weeks
              of the first half of semester. This left a total of 19 participants. Be-
              cause this is a mid-semester report, analysis of time spent marking

                                                                                   10
assignments—a major area of concern regarding unpaid work but one that typically occurs
toward the end of semester—is excluded. As such, we expect our overall findings to be con-
servative. For our upcoming end-of-semester report, we anticipate more participants will log
their hours, and that an even more detailed set of data will be gathered to prosecute the case
against wage theft and underpayment at the University of Sydney.
11Table 1.| Summary of demographic data gathered from survey.
Groups n
Total number of responses after data cleaning 19
Work performed at Sydney University*
DEMOGRAPHICS
Lecturing 9 (47%)
Tutoring 18 (95%)
Research 2 (11%)
Faculty/Centre*
Faculty of Arts and Social Sciences 18 (95%)
School of Philosophical and Historical Inquiry 4 (21%)
School of Literature, Art and Media 9 (47%)
School of Social and Political Sciences 6 (32%)
Not within a school 1 (5%)
Faculty of Science 1 (5%)
Faculty of Medicine and Health 1 (5%)
Brain and Mind Centre 1 (5%)
Gender
Female 9 (47%)
Male 8 (42%)
Non-binary 2 (11%)
Australian citizenship
Yes 17 (89%)
No 2 (11%)
Qualification
PhD 7 (37%)
No PhD 12 (63%)
Current student
Yes 9 (47%)
No 10 (53%)
12Years worked at Sydney University
Average 4.3 years
0-2 years 6 (32%)
2-4 years 5 (26%)
4-6 years 5 (26%)
6+ years 3 (16%)
Range 0-9 years
Years worked at any university
Average 5 years
0-2 years 3 (16%)
2-4 years 7 (37%)
4-6 years 3 (16%)
6+ years 6 (32%)
Range 1-9 years
Number of current contracts at Sydney University**
Average 2
1 8 (42%)
2 6 (32%)
3+ 5 (26%)
Range 1-4
Number of current contracts at any university
Average 2.2
1 7 (37%)
2 7 (37%)
3+ 5 (26%)
Range 1-6
* Several participants hold multiple positions so percentages add up to more than 100%.
** Note that this is based on answers to the question, ‘How many contracts do you currently hold at The University of Sydney?’ However,
not all contracts were audited e.g. participants with two contracts might have only audited one.
13Total underpayment
16 out of 19 participants (84%) performed unpaid work during the
audit.
Their stolen wages totaled $47,897 over a six-week period.
Stolen wages per person ranged from $0 to $11,469, with a mean of
$2521.
Participants were contracted to work 1230 hours but actually worked
RESULTS
1983, meaning they performed 753 hours of unpaid work over a
six-week period. This is equivalent to each person working close to
one day (6.6 hours) unpaid every week.
Figure 1 shows the underpayment and mean underpayment for all
participants.
Underpayment for weeks 1-6 of semester 2
Figure 1. Underpayment for weeks 1-6 of semester 2. Red line indicates mean.
14Case study: Participant S
• Total wages stolen at the end of week 6: $11,469
Participant S is employed casually in the Faculty of Arts and Social Sciences. She has worked as
a casual academic at the university for 6 years, but has not been given permanent work. This se-
mester, she has held 4 jobs at the University, and performed work including course coordination,
lecturing and tutoring. By the end of week 6, she was underpaid $11,469. For every dollar she
was paid, she was not paid $1.29, meaning she was paid for less than half of the work she did.
This wage theft mostly occurred because of significantly undercompensated administration and
teaching preparation. For administration, Participant S was paid 13 hours for the entire semester
to coordinate a unit with more than 70 students. This administration work includes creating the
Unit of Study outline, populating the Canvas (eLearning) site, designing assessments, responding
to student queries and attending student consultations. The 13 hours in her contract were exceed-
ed before semester even began. In other words, every email, every meeting, and every other
piece of administrative work for this course was unpaid from week 1, and her wage theft will
only continue through the remaining 6 weeks of the semester. As the results of our administration
audit (page 27) show, Participant S’s administration underpayment is a common story across our
sample.
Wage theft also occurred because Participant S performs ‘hybrid’ teaching in light of the
COVID-19 pandemic — that is, teaching both online and face-to-face. While it is important to
offer this type of teaching, it carries an enormous administrative burden. In Participant S’s case,
it meant negotiating rooms on campus big enough for 28 students to socially distance and mov-
ing online students between tutorials to accommodate time-zone differences to ensure they were
not expected to attend class at 4am. This work far exceeded the hours she was paid for.
Even setting aside the extra work created by the pandemic, Participant S was underpaid for
preparing teaching material for both lectures and tutorials. This was a recurring problem for
teaching staff in our sample.
Case study: Participant R
• Total wages stolen at the end of week 6: $7139
Participant R is casually employed in the Faculty of Arts and Social Sciences. She has worked
on and off as a casual academic at Sydney University for 9 years. This semester she is the co-
ordinator, lecturer and tutor for an undergraduate unit. By the end of week 6, Participant R
had been underpaid $7139. For every dollar she was paid, she was not paid $1.04 — again,
being paid less for than half of the work she needed to run this course.
Participant R performed much of this work without a contract. She spent 56 hours racing to meet
pre-semester deadlines, including publishing the Unit of Study outline, populating the Canvas site
15and accommodating the demands of online learning before semester began. However, when she
later received her contract after teaching had commenced, she had only been given 13 hours of
administration time. This amounted to $2650 in stolen wages before semester even began.
Her expectation to be paid more came from being hired in previous years to develop content
prior to the commencement of semester, as well as the general principle of being paid for all
hours worked. Previously, she was hired as a fixed-term employee and given 2 months to devel-
op materials. This year, she was given only 13 hours to ‘update’ the content, remodel the assess-
ment, and redesign all learning activities for blended (both face-to-face and online) learning.
While the contract was supposedly for ‘updating’ the course content, Participant R had to rede-
sign the module and spend significant time writing lectures from scratch.
This contract is the sole source of Participant R’s income, which she must live on until the new se-
mester in March 2021 (when she will hopefully be re-hired).
Case study: Participant P
• Total wages stolen at the end of week 6: $5062
Participant P is employed casually in the Faculty of Arts and Social Sciences. They have worked
as a casual academic at the university for 5 years, but have not been given permanent work.
They currently teach several workshop-based seminars of two hours each. Although they typi-
cally hold a wider variety of casual roles, when their School cut its casuals budget in 2020, they
saw several contracts disappear. Nonetheless, by the end of week 6, they had $5062 in stolen
wages. For every dollar they were paid, they were not paid 93 cents.
This wage theft came from being significantly undercompensated for administration, teaching
and marking. While teaching staff in our audit consistently reported needing more time to pre-
pare teaching materials, this is particularly the case for Participant P, who runs workshops that
demand extensive preparation and complex organisation across the entirety of the unit. This
teaching format also includes a rigorous feedback process, and Participant P typically spends
double, and sometimes triple, the allotted marking hours to grade student work.
Despite teaching this unit before, and being able to repeat some content across the three semi-
nars they run, Participant P found it impossible to complete all tasks in the allotted preparation
time.
Compounding this is the total lack of payment for and acknowledgement of Participant P’s
research — an aspect of wage theft not formally captured in this audit. Although Participant P
is employed on a casual teaching contract, this is less because of their teaching skills and more
because of their excellent publication track record and the social capital they bring to the Uni-
versity through industry connections. While the University and the students benefit from all of
Participant P’s work and connections beyond teaching, they aren’t paid a cent for this work.
16A note on case studies
The unpaid work outlined in the case studies is clear evidence of endemic wage theft. While
hybrid and asynchronous teaching, necessitated by the pandemic and University requirements,
created more unpaid work for casual academics (USyd Casuals Network, 2020), casuals have
been reporting underpayment of wages to the NTEU long before COVID-19, and the present
report confirms these claims.
Case studies like those of Participants P, R and S raise concerns about how academic labour is
taxonomised, whether or not there is a pandemic. For instance, Participants R and S classified
their work creating assessments and designing unit guides as administration in line with University
expectations. Participant P similarly logged the ongoing process of workshopping student work
outside the seminar hour as administration. Nonetheless, each of these participants received only
minimal administration hours in comparison to what they worked. Case studies like these suggest
that having casual staff perform higher-level academic work has been normalised at the Univer-
sity, but without adequate payment for performing these administrative tasks.
Exacerbating this underpayment, in exclusively tracking wage theft in relation to contracted
teaching hours, the audit does not capture the unpaid research work performed by casual ac-
ademics. The majority of the audit participants who hold PhDs are unpaid honorary research
affiliates in the departments where they perform casual teaching. This classification, which at first
glance is a useful way of remaining associated with the University, means that these staff con-
tribute their research output to the University without remuneration. Casual academics engage
in research and teaching activities similar to those performed by their permanent colleagues.
However, perversely, while the latter are paid and supported to do both activities, the research
contributions of casual teaching academics are not remunerated. It could be argued that the
University does not require this research work of these staff — that they are doing this research
on their own accord. However this would ignore the reality of the university labour market. First,
many of these honorary positions explicitly require the staff member to continue researching
without payment, lest they have their affiliation withdrawn. However, more importantly, aca-
demic hiring relies on continued research output — to have a gap in research during periods of
unemployment or teaching-only employment is to risk losing any chance of permanent employ-
ment. The University knows this and relies on it to boost its research status without having to pay
for it.
Finally, many workers included in the case studies reported that they had been quite conserva-
tive in their recording of unpaid hours. While some logged preparation completed prior to the
commencement of semester as administration hours, others found the intellectual labour involved
in developing a unit of study difficult to quantify and left it out of their audit. This suggests that
far from the underpayment data in this report being overblown, it is a cautious and restrained
snapshot of financial underpayment at the University. Indeed, as our data validation section (pg
30) shows, our results are in line with a range of studies across Australia.
17Accurate payment
3 participants in the audit (16%) were paid accurately for their work (i.e. had no wages stolen).
One of these participants is a research assistant. This person is able to claim variable hours
week to week, meaning their pay is an accurate reflection of the work they perform. This con-
trasts with teaching contracts, where hours are fixed and work beyond this is unpaid.
The other two participants who are teaching staff worked within the amount of time set for their
delivery and preparation. Although at first glance this may seem fine, correct payment should
not be something that happens by chance. It must be reliable and comprehensive. However, drill-
ing more deeply into these figures, these two participants reflect another perhaps more insidious
means of exploitation. Averaging out their audited hours over the whole year, these two partic-
ipants’ teaching hours equate to 35% and 32% of a full-time teaching-research contract. The
standard teaching proportion of a permanent or fixed-term teaching-research contract is 40%.
Once marking is included, it is likely that these two participants will be completing a full-time
teaching load, and so should not be employed on part-time casual contracts, but rather on full-
time fixed-term contracts at the very least. Despite being paid ‘correctly’ as a part-time casual,
they are being massively underpaid into the tens of thousands of dollars by virtue of the Univer-
sity casualising and under-employing them, rather than offering them a full-time job.
Case study: Participant A
• Total wages stolen at the end of week 6: $0
Participant A is a tutor in the Faculty of Arts and Social Sciences. They teach 6 tutorials, all for
the same course.
Participant A is one of only 3 participants who reported being accurately paid for their work.
The large number of repeat tutorials they taught gave them sufficient time to familiarise them-
selves with the course content, and to attend to any other tutorial preparation needed for
classes.
However, Participant A was still grossly underpaid for their administrative work. Their contract
specified only 2 hours for administration, a category which covers a range of tasks including
emails, consultations, meetings, and attending lectures. Despite their contract specifying only 2
hours, Participant A performed 37 hours of administrative work. This amounted to $1791 in sto-
len wages, a number which is not reflected in their total wage theft because they were able to
use their unused preparation hours for administration.
Rate of wage theft per person
In general, those with higher wage theft were those who were contracted to do more hours or
who worked across multiple contracts.
18For example, the participant with the highest wage theft (a total of $11,469 over 6 weeks)
included three separate contracts in the audit.
However, an employee with only one contract, or who is only given a few hours, might have
proportionally much higher wage theft.
To show this, we can compare how many dollars an employee was not paid with every dollar
they were paid—the rate of wage theft per person.
The rate of wage theft per person ranged from $0.00 to $2.19, with a mean of $0.75, as
shown in Figure 2:
Rate of wage theft
Figure 2. Rate of wage theft. Red line indicates mean.
On average, for every dollar casuals were paid, they were not paid 75 cents. This is equiv-
alent to 43% of work going unpaid, or someone in a 9-to-5 job not being paid for work
performed after 1:30pm.
The participant with the most wages stolen (Participant S) is still above the mean at $1.29.
However there are other participants (K, L and Q) who had proportionally more wages stolen.
The worst of these, Participant Q, had $2.19 stolen for every $1 of work they performed. In
other words, more than two thirds (69%) of their work was unpaid. This is equivalent to
someone in a 9-to-5 job not being paid for work performed after 11:30am.
Case study: Participant K
• Total wages stolen at the end of week 6: $1738
Participant K is a tutor in the Faculty of Arts and Social Sciences. She was given a contract to
tutor, but her course was cut after massive reductions in casual budgets during 2020 as a result
19of the pandemic. The University had to honour her existing contract, so she was assigned to
teach a similar unit. However, the unit had no tutorials. Instead, she was assigned to teach
seminars. Despite seminars being paid at a higher rate than tutorials (a 50/50 mix of the
tutoring rate and higher lecturing rate), her contract was not increased because of budget cuts.
Since Participant K was now teaching at a higher rate of pay than her contract, she arranged
with her coordinator to only teach every second week, so that she would roughly be paid the
correct amount over the semester. Despite this, she was underpaid $1738 at the end of week
6.
While Participant K has an idiosyncratic contract, unusual arrangements are not uncommon
among casualised staff, especially given the COVID-19 pandemic.
Gender disparity
Our sample included 9 women (47%), 8 men (42%) and 2 non-binary people (11%).
On average, women had 2.5 times the amount of wages stolen compared to men ($3837
vs. $1541). Non-binary people were underpaid $521 on average. The mean for the entire
sample (n = 19) is $2521. This is shown in Figure 3:
Mean wage theft by gender
Figure 3. Mean wage theft by gender. Red line indicates the mean for the entire sample.
The above differences may be attributable to the fact the women in this sample were contracted
for longer hours, and indeed performed more unpaid hours of work, than their male and non-bi-
nary colleagues. However, the differences are also in part explained by disparities in the rate
of wage theft per person between men, women and non-binary participants.
On this measure, the women in this sample are also underpaid at a higher rate than the men.
20For every dollar paid, women were not paid 98 cents, compared to men who were not paid 57
cents, and non-binary participants who were not paid 44 cents. The mean for the entire sample
is 75 cents. Note that there were only 2 non-binary participants, one of whom is an outlier be-
cause they are paid accurately. Reporting for this category is therefore skewed.
Other demographic details (e.g. holding a PhD, being a current student, years worked at Syd-
ney University, number of current contracts) were not notably correlated with either the amount
or the rate of wage theft.
The gendered nature of wage theft
The gendered nature of wage theft in this report reflects the broader issue of gender inequality
in the University sector. The University of Sydney itself recognises that a pay gap exists in the
tertiary sector, with women over-represented in casual jobs, and that teaching workloads for
women can mean that they are less able to designate time to research, disadvantaging their ac-
ademic career progression (The University of Sydney, 2020). The excess uncompensated teach-
ing and administrative labour that female academics reported in this audit is indicative of this
problem already identified by the University.
Additionally, the lopsided impact of wage underpayment on women in this report sits in tension
with the University’s efforts to make the organisation a more equitable place for women, and
the public recognition it receives for this work. For instance, in June the Vice-Chancellor Michael
Spence signed a pledge that committed the University to promoting gender equity during the
pandemic, which the University recognised had a deleterious impact on women in higher educa-
tion. This was because of the aforementioned overrepresentation of women in precarious work
(The University of Sydney 2020). Through signing the pledge, Spence committed the University
to: ‘support[ing]... the progression of women as students, higher degree researchers, and ear-
ly-mid career researchers’ (Australian Higher Education Joint Sector Position Statement, 2020).
If, as this report makes clear, women are not compensated for the work they do, the University
creates an environment that is not hospitable, or attractive, to female academics, sitting in tension
with Spence’s pledge.
We recognise that the University has a swathe of other initiatives that aim to promote gender
equity. In addition to Spence’s pledge, we note that the University was awarded the Science in
Australia Gender Equity — Athena SWAN Bronze Award in 2019; that gender equity is listed
as a priority in the University’s 2016–2020 Strategic Plan (The University of Sydney 2016, 46);
and that the University submits yearly reports to the Gender Equality Workplace Agency on its
gender equity efforts (The University of Sydney, 2020). Additionally, the institution has a ‘Pan-
el Pledge’, which enables members of our University community to improve gender diversity at
events and on public panels (The University of Sydney, 2020).
By ensuring casual academics are paid for all the work they do, the University will be able to
further their goal of promoting gender equity. It will also ensure the public-facing promotion and
recognition of the University’s commitment to gender equity is authentic and backed by on-the-
ground practice.
21Underpayment by position
Lecturing
8 of 9 (89%) participants who performed lecturing work reported being underpaid for lecturing.
The stolen wages for lecturing totalled $8088 over a six-week period. The mean was $899
per person for all six weeks, or $150 per person per week in underpayment.
Unpaid wages for lecturing ranged from $0 to $2527, with two people reporting stolen wag-
es exceeding $2000 over six weeks.
Table 2 shows the hours expected to work, excess hours worked, total unpaid wages and rate of
wage theft for lecturing work:
Total hours Hours worked in Total unpaid wages Rate of wage
Participant
expected to work excess of contract for lecturing theft
N 24 35 $2527 1.46
Q 4 5 $361 1.25
B 15 12 $867 0.80
J 18 14 $1011 0.78
F 4 3 $217 0.75
S 24 14 $1011 0.58
R 48 28 $2022 0.58
D 4 1 $72 0.25
E 6 0 $0 0.00
Mean 16.3 12.4 $899 0.72
Total 147 112 $8088
Table 2. Underpayment and rate of wage theft for lecturing.
As with overall underpayment, those with higher lecturing underpayment tend to be those who
are working more hours. However this is not always the case. Lecturing is an immensely time-con-
suming task, especially if it is the first time a casual staff member has taught that unit.
Indeed, in this audit, the person with the highest underpayment due to lecturing, Participant N,
only teaches 2 hours face-to-face per week, lower than some other participants. However, their
rate of wage theft was the highest for lecturing at $1.46, meaning they were paid less than
half of what they worked.
22For lectures, the mean rate of underpayment was $0.72, equivalent to casual lecturers be-
ing paid on average only 58% of what they are owed.
This reflects unrealistic modelling of how long lecturing should take as set in the Enterprise
Agreement. As Table 2 shows, only a single participant, Participant E, did not perform excess
(i.e. unpaid) hours for lecturing. That is, only one person managed to complete the work they
were given in the hours that would be expected under the current Enterprise Agreement, with all
others having to work considerably more than what is projected by the University.
We can more clearly see the unrealistic standards set in the Enterprise Agreement by looking
at one specific pay code: Significant Responsibility/Developed Lecture classification (P02). This
classification is for lectures where the lecturer ‘assumes significant responsibility for planning and
developing a course unit (or subject) or a large part of a unit as well as lecturing, or where a
lecture or small group of lectures calls for special expertise’ or ‘has responsibility for coordina-
tion of a course unit.’ Under the Enterprise Agreement, it is projected that every hour of lecturing
under this classification will need to be accompanied by three hours of preparation and associ-
ated work (totalling 4 hours work). Developing, preparing and coordinating units are significant
tasks that take considerably more time than the four hours afforded to it.
Figure 4 shows the total hours worked for every face-to-face hour for the Significant Responsi-
bility/Developed Lecture classification (P02). The standard set in the Enterprise Agreement, 4
hours, is shown in orange. Figure 4 shows that not a single participant in the audit was able to
meet this rate. The closest participant (Participant D) worked an hour more, while the mean was
3.25 hours more.
Hours worked for every hour of face-to-face (Lecturing)
Significant Responsibility/Developed Lecture (P02)
Figure 4. Hours worked per face-to-face hour of lecturing for pay code P02 (Significant Re-
sponsibility/Developed Lecture) compared to the hours specified by the Enterprise Agreement
(orange). Red line indicates mean.
23Tutoring
Fourteen of 18 participants (78%) who performed tutoring work reported being underpaid
for tutoring. This underpayment totalled $15,352, or a mean of $853 per person over the
six-week period. This amounts to $142 per person per week in underpayment. Total
underpayment per person ranges from $0 to $3058. The mean rate of underpayment is 0.37,
and the maximum is 1.89, where one participant was unpaid for 65% of their work performed.
See Table 3.
Total underpayment for tutoring work, weeks 1 to 6:
Total hours Hours worked in Total unpaid wages Rate of wage
Participant
expected to work excess of contract for tutoring theft overall
L 18 34 $1763 1.89
H 20 15 $778 0.75
S 81 44 $2725 0.54
Q 30 16 $829 0.53
O 120 59 $3058 0.49
M 54 25 $1548 0.46
I 31 13 $805 0.42
P 80 28 $1734 0.35
J 27 8 $415 0.30
N 30 8 $415 0.27
R 42 9 $557 0.21
G 40 7 $363 0.17
F 35 5 $310 0.14
K 18 1 $52 0.06
A 156 0 $0 0.00
B 130 0 $0 0.00
E 20 0 $0 0.00
D 15 0 $0 0.00
Mean 52.61 15.11 $852.87 0.37
Total 947 272 $15,352 -
Table 3. Total underpayment for tutoring work per participant during weeks 1 to 6.
24In the audit, many participants taught multiple tutorials each week. The first tutorials are paid
at a higher rate than any subsequent repeat tutorials. This is because the first tutorial requires
preparation whether or not there are any repeat tutorials, and this material can nominally be
‘reused’ in the repeat tutorial. As material is able to be reused from first to subsequent
tutorials, the more repeat tutorials participants taught, the more likely they were not
underpaid. Of the four participants who were not underpaid, two taught five repeat tutorials
per first tutorial, and two taught one repeat per first tutorial.
The audit revealed a general trend that as participants took on more repeat tutorials, their
underpayment lessened, as shown in Figure 5. This chart shows that under the current payment
system the ‘ideal’ ratio where participants are paid correctly for the work they do, falls around
the four-hour mark, involving one first tutorial and three repeat tutorials.
Rate of wage theft vs number of tutorials taught
Figure 5. Tutorial underpayment in relation to the number of tutorials taught.
Despite the trend shown in Figure 5, no matter how many repeat tutorials participants teach,
they are nonetheless typically significantly underpaid for the first tutorial. 16 of 18 (89%)
participants reported being underpaid for the first tutorial (see Table 4). Over the six weeks,
total unpaid wages from first tutorials ranged from $0 to $4251 per person.
Total underpayment for first tutorial(s), weeks 1 to 6:
Total hours ex- Hours worked in excess Total underpay- Rate of under-
Participant pected to work for of contracted hours for ment for first payment for first
first tutorial(s) first tutorial(s) tutorial(s) tutorial(s)
M 18 38 $2353 2.11
J 9 17 $881 1.89
L 18 34 $1763 1.89
25O 60 82 $4251 1.37
S 45 44 $2725 0.98
I 15 10 $619 0.67
H 12 7 $363 0.58
Q 30 16 $829 0.53
N 18 9 $467 0.50
G 24 8 $415 0.33
P 36 12 $743 0.33
E 12 2 $104 0.17
D 9 1 $62 0.11
R 18 1 $62 0.06
A 36 2 $104 0.06
K 18 1 $52 0.06
F 15 0 $0 0.00
B 30 0 $0 0.00
Mean 23.50 15.78 $877.34 0.65
Table 3. Total underpayment for tutoring work per participant during weeks 1 to 6.
Total 423 284 $15,792 -
Table 4. Total underpayment for first tutorials, weeks 1 to 6.
Comparing Tables 3 and 4 shows that there were certain instances where the underpayment
for the first tutorial was higher than the overall tutorial underpayment. This occurs because
some tutors managed to ‘make up’ some of their stolen wages through their repeat tutorials.
However as Participant O illustrates, this regularly did not lead to being paid correctly —
despite ‘making up’ $1192 through their repeat tutorials, their first tutorial underpayment was
such that they still had $3058 stolen.
The underpayment in the first tutorial averaged 65c per dollar paid. This means that while
teaching students, tutors effectively stopped being paid after 36 minutes of their first tutorial.
Interpreted in terms of hours, rather than money, tutors consistently worked considerably
longer than what the Enterprise Agreement standards suggest they need to. For first tutorials,
the Enterprise Agreement projects three hours of work, including 1 hour of teaching and up to
2 hours of preparation and associated work. However only 2 of 18 tutors managed to complete
26the work required of them in this time. In fact, on average each first tutorial took closer to 5
hours than the 3 suggested (mean = 4.6 hours), with two tutors working closer to 9 hours for
every first tutorial they delivered.
As the results for tutoring indicate, the standards set by the Enterprise Agreement grossly
underestimate the time it takes to complete the teaching work asked. This results in massive
and systematic underpayment of casual staff.
Administration
Administration is perhaps the area where casuals are most exploited and underpaid. On aver-
age in our audit, teaching casuals who reported doing administration were given just 4.75 hours
of administration in their contract for the first six weeks of semester, totalling only 48 minutes a
week to cover emails, student consultations, preparation of online materials, lecture atten-
dance for tutors, meetings with coordinators, completion of compulsory HR modules, inter-
action with HR, filling in of timesheets and all other associated work that does not fit within
‘teaching preparation’. The results of our audit shows that this allowance is absurdly minuscule
and represents the most egregious means of wage theft of teaching staff at the university.
The fifteen participants who reported doing administration hours were collectively underpaid
$25,517, at a mean of $1595 per person. This means that each week, each person’s job re-
quired they do $266 worth of administrative tasks for the university that they weren’t paid for.
The breakdown of these figures is shown in Table 5.
Total underpayment for administration, weeks 1 to 6:
Total hours Hours worked in excess Total underpay- Rate of under-
Participant expected to work of contracted hours for ment for payment for
for administration administration administration administration
D 8 2 $123.24 0.25
J 4 4 $206.20 1.00
H 3 5 $257.75 1.67
K 2 6 $309.30 3.00
E 2 6 $309.30 3.00
S 35 116 $7147.92 3.31
G 3 13 $670.15 4.33
R 13 74 $4559.88 5.69
B 2 24 $1237.20 12.00
27A 2 35 $1804.25 17.50
Q 2 78 $4020.90 39.00
I 0 10 $616.20 -
O 0 18 $927.90 -
M 0 12 $739.44 -
N 0 0 $0 -
P 0 42 $2588.04 -
Mean 4.75 27.81 $1,594.85 8.25
Total 76 445 $25,517.67 -
Table 5. Total underpayment for administration, weeks 1 to 6.
Not a single person in the audit managed to complete the administration required of their
job in the hours given to them. For those given administration hours in their contract, the rate
of underpayment ranged from 0.25c per dollar paid to $39 per dollar paid, with a mean of
$8.25. This means that casuals were on average paid for only 10% of the administrative work
they did.
However this figure in fact undercounts the actual rate of underpayment, as five staff were not
given any administrative hours in their contract at all, despite collectively working 82 hours of
administration.
A useful comparison for understanding administration work is to consider how much administra-
tion is needed per face-to-face hour of teaching, as shown in Table 6. Note that this table does
not include the hours needed for teaching preparation — these are purely administrative hours
on top of teaching preparation hours. On average, casual staff performed 1.32 hours of ad-
ministration per face-to-face teaching hour. For a tutor teaching two 1-hour tutorials a week for
a twelve-week semester, then, this means they should be given 32 hours of administration for the
semester. However as our audit shows, most are lucky to get more than 3. These results reflect
gross exploitation of casual workers, where the everyday work that keeps the university running
is done by an underclass that the university refuses to pay.
Administration hours worked per face-to-face teaching hour, weeks 1 to 6:
Administration Face-to-face Administration hours per
Participant
hours worked teaching hours face-to-face teaching hour
Q 80 11 7.27
S 151 39 3.87
R 87 30 2.90
28D 10 7 1.43
K 8 6 1.33
P 42 34 1.24
H 8 8 1.00
G 16 16 1.00
E 8 10 0.80
I 10 13 0.77
A 37 72 0.51
M 12 24 0.50
J 8 18 0.44
B 26 65 0.40
O 18 50 0.36
F 0 16 0.00
N 0 18 0.00
L 0 6 0.00
Mean 28.94 24.61 1.32
Total 521 443 -
Table 6. Administration hours per face-to-face teaching hour, weeks 1 to 6.
These results reflect significant underpayment of casual staff. Viewed in terms of each hour of
tutoring, lecturing and administration, it becomes clear that underpayment of casuals is systemic
and widespread. Whether or not this is explicitly stated, this suggests underpayment is a part of
the University’s business model.
29The results of the audit accord with other research in this area. Re-
search on underpayment and unremunerated labour has been con-
ducted by experts in higher education using a mixture of quantitative
and qualitative methods. This research has been conducted by aca-
demic staff across numerous universities, trade unions, and adds to ex-
DATA VALIDATION isting literature published in peer-reviewed journals. While there are
several themes that repeatedly present themselves across the litera-
ture — namely, the systemic nature of underpayment across the entire
higher education sector, the impact of the health and well-being of
staff subjected to unlawful underpayment, and the evidence base for
academic workloads well beyond what is allocated across a range of
core duties — it is with this final theme that this section is concerned.
The evidence on workloads involved in performing core duties in aca-
demic labour demonstrates a large disparity between allocated work
hours and actual hours worked. The FASS Workloads Group (2019a,
2019b) found that there had been a drastic undercounting of the time
necessary to perform core duties. The Group reviewed key literature
that addressed workloads in teaching labour, research labour, and
services and engagement duties (Bittman, 2016; Kenny and Fluck,
2014, 2017, 2018, 2019; Kenny et al., 2012; Miller, 2019). The
literature here shows that institutionalised practices of underestimat-
ing necessary workload in academic labour are well documented and
contradict the actual time taken to perform academic duties, just as this
interim report shows.
In 2019, the NTEU FASS Workloads Group (2019, 6-7) found that
while the workload allocation for lecture preparation is 2 hours, 84%
of staff took 4 or more hours to prepare for a 1-hour lecture, with
48% taking 8 or more hours. This accords with the current audit, where
participants took a mean of 5.1 hours to prepare for each hour of
lecturing (varying from 6.25 hours on average for a ‘significant re-
sponsibility/developed lecture’ to 2.9 hours for a ‘standard lecture’).
Likewise, updating lecture material routinely took staff more than 4
hours. For tutorials, the Group (2019, 7-9) found that 62% of staff
surveyed spent more than 3 hours to prepare for a 1-hour tutorial.
This again accords with the current audit where tutors reported taking
on average 3.6 hours of preparation per first one-hour tutorial. In the
NTEU FASS Workload Group’s survey, the time spent on tutorials was
not lessened by repeat tutorials, where the presumption is that minimal
time is needed. Instead, 65% of the staff who were surveyed reported
spending more than 2 hours preparing. Similarly, marking workload
policy was also found wanting, with only 14% of survey respondents
being able to mark a 2000-word essay within the 1-hour time allocat-
ed. 30The NTEU FASS Workloads Group (2019b) argued that across the sector there is a ‘structural
reliance on time and wage theft’ (2019b, 3), with underpayment in lecture preparation by a
factor of 4, academics routinely working 12 hours of unremunerated overtime each week, and
70% teaching loads despite the 40:40:20 workload requirement.
The NTEU workloads and wage theft report, Unlawful Underpayment of Employees’ Remuneration
(Wage Theft) (2020), showed that of the 2,392 casual academics who responded to their 2019
survey (NTEU State of the Uni Survey, 2019), 64% were underpaid according to the workload
formula they were contracted for. The report (NTEU, 2020) concluded that, based on the liter-
ature, ‘unlawful underpayments across the sector will have amounted to many tens of millions of
dollars over recent years’ (2020, 11).
The USyd Casuals Network report, Over-Worked and Worked Over (2020), revealed the extent
of workload intensification for casualised staff following the COVID-19 outbreak. The report
(2020, 21) showed that, prior to COVID-19, most casuals surveyed are performing additional
unremunerated overtime each week. Of those surveyed, 40.5% performed up to 3 hours ad-
ditional labour, 36.5% performed up to 7 hours additional labour, 11.1% performed up to 10
hours additional labour, 6.3% performed up to up to 14 hours additional labour, 1.6% per-
formed up to 18 hours additional labour, 1.6% performed up to 21 hours additional labour,
and 2.4% performed more than 22 hours of additional labour.
This compares with the significant increases to unremunerated labour expectations following the
COVID-19 outbreak. Of the respondents surveyed (USyd Casuals Network 2020, 22), 18.3%
performed up to 3 hours additional labour, 31.3% performed up to 7 hours additional labour,
24.5% performed up to 10 hours additional labour, 10.7% performed up to 14 hours addition-
al labour, 6.1% performed up to 18 hours additional labour, 4.6% performed up to 21 hours
additional labour, and 4.6% performed more than 22 hours of additional labour.
The Monash Casuals Network report, Hide the Pain Away (2020), investigates the changes to
workloads following the COVID-19 outbreak and shows a similar pattern of unremunerated
labour, with 65% of survey respondents reporting significant amounts of unpaid labour across
2020, as well as pointing to long-existing issues of underpayment well before the COVID-19
outbreak. The report notes that, while large amounts of unpaid labour have been a persistent
feature of casualised labour at Monash University, the transition to online delivery of courses
‘has seen an unprecedented amount of unpaid work take place’ (Monash Casuals Network,
2020, 6) at the same time as the total number of academic staff has been drastically reduced.
The UNSW Casuals Network report, Under the Pump, Unpaid and Uncertain (2020), investigating
the changes to workloads following COVID-19, found much the same pattern of unremuner-
ated labour, both as a long-term reality pre-existing COVID-19, and as intensifying following
the COVID-19 outbreak. The report (UNSW Casuals Network, 2020) showed that nearly half
(42%) of casual workers surveyed are doing additional unremunerated overtime each week. Of
those doing unremunerated labour each week, 26% performed up to 4 hours additional labour,
42% performed up to 10 hours additional labour, 14% performed up to 15 hours additional
31labour, 12% performed up to 20 hours additional labour, and 4% performed more than 20
hours additional labour.
Our report is therefore not standalone. It sits within a body of research which consistently
finds that university staff are not paid for all the work they perform, with casuals the most
exploited. The findings of this report should not be viewed as a self-contained problem for
a small handful of staff, but as more evidence of the sector-wide and systemic exploitation
of precarious university workers.
32Herein we present an interim report on the mid-semester findings of
the USyd Casuals Network wage theft audit of Semester 2, 2020. 19
casuals from 7 schools and 4 faculties and centres completed weekly
measures for 28 contracts. They tracked hours contracted and hours
worked against the specific pay codes for tasks.
We find that:
• 84% of participants performed unpaid work during the audit.
Their stolen wages totalled $47,897 over a six-week period.
• Participants performed 753 hours of unpaid work over a six-
week period, equivalent to each person working close to one
day (6.6 hours) unpaid every week.
• On average, for every dollar casuals were paid, they were not
paid 75 cents. This is equivalent to 43% of work going unpaid,
SUMMARY
or someone in a 9-to-5 job not being paid for work performed
after 1:30pm.
• On average, women had 2.5 times the amount of wages stolen
compared to men ($3837 vs $1541).
• Lecturing: The stolen wages for lecturing totalled $8088 over
a six-week period. Unpaid wages for lecturing ranged from
$0 to $2527, with two people reporting stolen wages exceed-
ing $2000.
• Tutoring: Fourteen of 18 participants (78%) who performed
tutoring work reported being underpaid for tutoring. This un-
derpayment totalled $15,352, or a mean of $853 per person
over the six-week period.
• Administration: On average in our audit, casual academics
were given 48 minutes a week to cover emails, student consul-
tations, preparation of online materials, lecture attendance for
tutors, meetings with coordinators, completion of compulsory
HR modules, interaction with HR, filling in of timesheets and all
other associated work that does not fit within ‘teaching prepa-
ration’. In contrast, casuals performed on average 1.32 hours
of administration per face-to-face hour of teaching.
Can we generalise these results to say that the University of Syd-
ney has a problem with wage theft of its casualised staff? The fact
that any 19 casuals at the University are experiencing wage theft is
alarming. Further, insofar as the known problem of unpaid marking
work is excluded from this report, we know that these mid-semester
findings are conservative. To the extent that the report reflects exist-
ing work on underpayment at universities, it reinforces the notion that
the University has a financial operating model dependent on exploit-
ed casual labour.
33DEMANDS
Given the similarities between our report and many others across the university sector, we
can say confidently that, yes, the University has a problem with wage theft of casual staff
and that these findings are likely to be just the tip of the iceberg. As casuals ourselves, as
lecturers, tutors, administrative staff and researchers, as well as members of the USyd Casuals
Network and the NTEU, we therefore make the following demands:
1 Pay back all unpaid wages
The University of Sydney must immediately move to pay back all unpaid wages to all
affected casualised staff, under the guidance of NTEU members in the USyd Casuals Net-
work and the NTEU to determine the appropriate amount of compensation to be paid.
2
Adapt casuals’ schedules of payment to end wage theft under the existing EA
The University of Sydney must immediately alter casuals’ schedules of payment to ensure
that for the remainder of the life of the existing EA, casualised staff are not underpaid.
To do this, the University must consult with NTEU members in the USyd Casuals Network
and the NTEU to determine how schedules of payment are to be altered (e.g. by in-
creasing administration hours and increasing hours paid for marking, tutorial and lecture
preparation).
3
Conduct a full-scale audit of all casuals’ working practices at the University
The University of Sydney must immediately extend its existing audit, under the guidance
of NTEU members in the USyd Casuals Network and the NTEU, to determine the true
scope of underpayment at the University amongst casualised staff.
4
Commit to ending wage theft in the next EA
The University of Sydney must commit to enshrining appropriate rates of pay for casual-
ised staff in the next EA so that wage theft is impossible.
Commit to reducing casualisation
5 The University of Sydney must immediately commit to reducing its current dependency on
a casualised workforce by providing greater employment and income security to casual
staff and facilitating the conversion of all eligible staff to permanent work.
As members of the USyd Casuals Network and the NTEU, we:
Commit to building our collective capacity across the University to have our demands met,
including through workplace meetings, political campaigning, and future industrial action.
34You can also read