Total Transport Systems Limited - Investor Presentation January 2018 - Total Transport Systems ...
←
→
Page content transcription
If your browser does not render page correctly, please read the page content below
Total Transport Systems Limited

   Investor Presentation
       January 2018
Table of Contents

 01       Company Overview

 02       Business Overview

 03       Half Yearly Financial Highlights

 04       Annual Financial Highlights

          Way Ahead
  05
                                             2
01 Company Overview
About The Company

▪ Incorporated in 1994 – reputed name in       ▪ Employs 401 ( including
  Indian Logistics Industry, located in          contractual) employees in India
  Mumbai - Engaged in LCL, FCL, Freight          alone. Highly experienced Key
  Forwarding, Deconsolidation business           managers and staff managing
  for both exports and imports                   timely delivery at any
                                                 destination

▪ First Company to be listed on                ▪ Sizeable market share in India’s
  NSE Emerge exchange which                      LCL segment and among
  has huge “ LCL ” revenue play                  leading players in cargo
                                                 consolidation

▪ Pan-India presence with 11 own offices and   ▪ Represent world’s 5th largest
  7 associate offices                            consolidators network named
▪ CP World network provides access to 39         “I Cargo Alliance”, with 89
  countries in 81 global locations               countries with 166 offices
                                                                                    4
Key Milestones

                                                          Rapid Customer Acquisitions
                                                          Growing International Network
                                                                                                                            ▪   Listed on NSE
                                                                                                                                Emerge Exchange –
▪   Incorporated                   ▪   Started                   ▪   Established CP            ▪   Best                         IPO Oversubscribed
    in 1994                            Ahmedabad                     World Global                  Consolidator                 130x
                                       operation                     network                       Awards for               ▪   Ventured in new
                                                                                                   over 15 years                service – Air freight

     1994                              1998                          2005                              2014                         2017

                       1996                            2000                           2007                         2015

                   ▪   Started                     ▪   Entered                  ▪     Revenues cross          ▪    Revenues cross
                       Chennai                         North India                    INR 1 billion                INR 2 billion
                       operation                       Market

                        Domestic Footprint                                                         Rapid Growth in Scale

                                                                                                                                                  5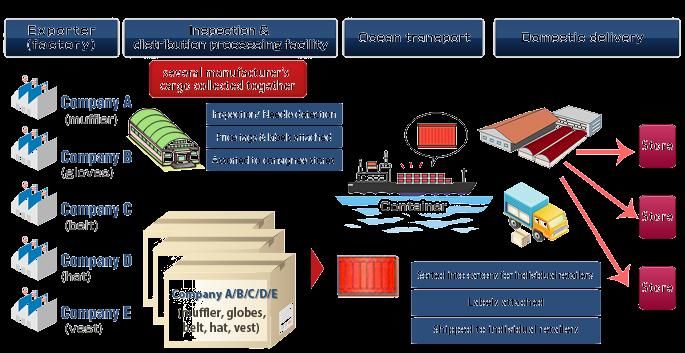
Experienced Management Team

                       Makarand P . Pradhan
                       Promoter and Managing Director
                       ▪ Director of Company since 1994 and has vast experience in Freight Forwarding and Logistics Industry,
                         stretching over thirty years
                       ▪ Overseas Business Policies and overall management of Companies
                       ▪ Also associated with various Overseas Organisations and is in best position to lead Company
                       ▪ President of Consolidators Association of India
                       ▪ Chairman of CP World Group and I Cargo Alliance

                                                                              Sanjiv A. Potnis
                                                                   Promoter and Executive Director
▪ Started his career with Dolphin Chartering Services Pvt. Ltd. ; Later he joined Forbes Gokak
  Ltd.
▪ Experience of over 25 years in field of Freight Forwarding & Offshore operations and
  exposure to shipping industry. Serving as President of Bombay Freight Brokers Association
▪ Responsible for Sales & Marketing across India and globe for Company
▪ Actively takes part in key managerial decisions in Company

                       Shrikant D. Nibandhe
                       Promoter, Executive Director & CFO
                       ▪ Diverse experience of thirty years in Logistics, Freight Forwarding and Management of Container Freight
                         Stations (CFSs)
                       ▪ Associated with since 1998 and actively involved in all discussions with International Associates
                       ▪ Also oversees Finance, leads various other functions like Corporate Communication and Human Resources
                       ▪ Treasurer of Consolidators Association of India since Inception in 2003

                                                                                                                                   6
Experienced Management Team

  Nitin Phadke
  Vice President - Finance

  ▪ Strong experience of 27 years in Accounting and Finance, out of which 21 years is in Freight
    forwarding industry
  ▪ Actively involved in setting up of process and system in each of the company
  ▪ Worked with Leading freight forwarders
                                                                                        Kanchan Kulkarni
                                                                                 General Manager – Air Freight

                   ▪ Rich experience of over 32 years in Freight forwarding industry
                   ▪ Strong expertise is in Air Freight business for over 26 years
                   ▪ Responsible for business Development and actively involved in developing overseas
                     partners and network for the Airfreight business

  Mr. Kaushal Buch
  General Manager – Sea Freight

  ▪ More than 20 years of experience in Freight forwarding and cargo consolidation field
  ▪ Responsible for business development both in India and overseas
  ▪ Working with Total Transport Systems Ltd for equal number of years and heading Sea Freight ,
    India
                                                                                        Vijay Veragiwala
                                                                                            Regional manager

                 ▪ Vast experience of over 38 years Shipping, forwarding and consolidation activity
                 ▪ He is with Total Transport Systems Limited since 2003 and key member of a team
                 ▪ Regional manager for Eastern India, Nepal and Bhutan and responsible for Pune market

                                                                                                                 7
Group Structure

                                              Total Transport Systems
                                                         Ltd

       CP World Logistics India                 One World Logistics Pvt                     Total Transport Systems
              Pvt Ltd                                    Ltd                                    Pvt Ltd – Nepal
          (100% Subsidiary)                       (100% Subsidiary)                            (64% Subsidiary)

▪ Engaged in providing one window   ▪ One World - international NVOCC company,        ▪ Engaged in providing one window
  logistics solutions                 specialising in provision of less-than-           logistics solutions in Nepal
                                      container load ( LCL ) cargo service solution
                                      across world. Its extensive experience begins
                                      in Asia and now extend into Europe and
                                      America

                                                                                                                          8
Awards and Recognitions

 Year     Award                                        Achievements
2009-10   Concor Awards (EXIM)                         Best LCL Consolidator 1st position
2009-10   Concor India- South Region Award             LCL Consolidator 2nd Position
2010-11   Concor Awards (Daily Shipping Times)         Best LCL Consolidator 1st position
2011-12   Concor Awards (Daily Shipping Times)         Best LCL Consolidator 1st position
 2012     Gujarat Star Awards (Daily Shipping Times)   Best LCL Consolidator of Year (Gujarat)
 2012     South East Cargo and Logistics Award         Best LCL Consolidator 1st position
2012-13   Concor Awards (Exim)                         Best Consolidator LCL Exports 1st position
2012-13   Concor Awards (Exim)                         Best Consolidator LCL Imports 1st position
2013-14   Concor Awards (Daily Shipping Times)         Best Consolidator LCL Exports 1st position
2013-14   Concor Awards (Daily Shipping Times)         Best Consolidator LCL Import 2nd position
2013-14   Concor Awards (Daily Shipping Times)         Direct LCL Console 3rd position
 2014     Gujarat Star Awards (Daily Shipping Times)   Best LCL Consolidator of year(Gujarat)
2014-15   Concor Awards (Exim)                         Direct LCL Console 1st position
2014-15   Concor Awards (Exim)                         Best Consolidator LCL Import 2nd position
2014-15   Concor Awards (Exim)                         Best Consolidator LCL Exports 1st position
 2015     Gujarat Star Awards (Daily Shipping Times)   Best LCL Consolidator of year (Gujarat)
 2015     South East Cargo and Logistics Award         Best LCL Consolidator 1st position
2015-16   Concor Awards                                Best Consolidator LCL Exports 1st position
2015-16   Concor Awards                                Best Consolidator LCL Import 2nd position
 2016     South East Cargo and Logistics Award         LCL Consolidator Import Finalist
 2016     South East Cargo and Logistics Award         LCL Consolidator Export Finalist
 2016     Logistics Asia awards                        LCL Consolidator
 2017     India Mari-Time Awards                       LCL Consolidator
                                                                                                    9
02 Business Overview
Business Offerings

                            Cargo             Freight Forwarding       Air
                        Consolidation           (FCL & Projects)     Freight
                         (LCL) 70%*                  25%*             5%*

                                                                     Started
                                                                   operations in
                                                                     Aug’17
          Imports                   Exports
           40%*                      60%*

                                                                                   11
*Volume in TEU’s
Services Offered – Cargo Consolidation
▪ Core business activity since inception
▪ Consolidates shipments for more than 1,100 destinations worldwide
▪ Market leader with sizeable market share across all major locations in India
▪ Over 10% market share at major locations in India
▪ Contributes 60-65% of total turnover as on March 31, 2017
▪ Strong Global Presence – Network across 89 countries with 166 offices
▪ TTSL/CP World receives Less-than-Container-Load (LCL) cargo from various freight-forwarders
▪ Tie-ups with leading shipping lines Maersk, MSC, NYK, Hapag Lloyd, Hyundai , CMA –CGM, Cosco
Cargo Consolidation
Focus geographies – CIS
countries
Africa
Afghanistan
12Services Offered – Freight Forwarding
02
▪ Strong buying capacity and
controlled business, enables
Company to obtain special
03 rates from carriers
▪ Specialised in moving
full container loads in
CIS region
01
04
▪ Coordinating with Shipping Lines, ▪ Through
CFS, Vendors to provide effective and experience of
efficient logistic solutions moving cargos in
inland Africa
▪ Contributes 15-20% of top line
05
06
▪ Helps to retain substantial
▪ Provides effective logistic margins in spite of offering
solutions to Automobile competitive freight levels to
industry clients
13Services Offered – Air Freight
▪ IATA Accredited
▪ Strong partners worldwide to handle DDP,
DDU and Ex-Works as members of freight
forwarding networks
▪ Centralized pricing and co-ordination desk in
Mumbai for pan India operations
▪ Focus to provide shortest turn around time to get
shipments confirmed
▪ Proficient Airfreight handling team with
over 15 years rich experience
▪ Specialized team to handle any
type of DGR cargo
▪ Strong network partners worldwide to
provide best possible solutions to clients
▪ Strong ability to handle any imports or
exports to/from any International
airport across globe 14Key Strengths
Expertise in business
▪ More than 20 years of expertise
in logistics industry in dealing Functional Expertise
with global clients
▪ High Entry barrier for new
Strong entrants ▪ Strong Employee Network – Over
Client Relationships 400 employees(Including
contractual) across 11 locations in
▪ Long term relationships India
with marquee clients.; ▪ Robust IT System - Web-based, 24x7
Over 1,000 smaller real-time tracking and Standardized
clients software
▪ Alliance of over 500
CHA’s
Robust International Strategic Domestic
Network Footprint
▪ Robust network of ▪ Present in all major
consolidator through CP locations including Key
world hubs, ports
▪ Over 1,100 agents
network 15CP World Global Network – An Advantage
Europe
North
N. America, S. America
America
routes give higher
margin per TEU Singapore and
Dubai and Far East
Upper Gulf
CP World Contribution
Asia 36% South
America
Oceania 8%
Africa
Europe 20%
Africa 2% Export
America 12%
Import
South America 10% ▪ Traditionally major routes: Dubai & Upper Gulf, Singapore & Far East
Middle East 12% ▪ Increasingly plying longer routes: North America, South America, Europe
▪ South Africa and other African countries also getting more traffic 16Reciprocal Relationship
Led formation of exclusive networks (Mr Pradhan is Chairman of both networks):
Membership to Greater trust, reliability &
▪ CP World Global Network: Formed with Ken Chiang of Singapore in 2005
exclusive networks exclusivity ▪ iCargo Alliance: Formed in 2011 along with CP World Group and Fang Cheng (China)
Strong Agent Global reach through one-to-one ▪ 180+ agents connecting 1,100 locations in 39 countries globally that include both key trading
Network partners of India such as Gulf states as well as rapidly growing EXIM hubs such as S.E. Asia, S.
relationships
America
Greater market ▪ Rapid growth in volumes and revenues with increased access to geographies and cargo
Contender for top position
power ▪ Increased profitability on account of longer routes such as US, Canada, Europe are plied
▪ Strong global network ▪ Registered in Hong Kong
▪ Staff of 1,250 personnel ▪ Promoted by CP World
▪ Singapore, Hong Kong, Group and Eurasia Group
Busan and Jebel Ali - Main ▪ Exclusive cargo alliance
trans-shipment hubs across 89 countries with 166
Mr. Makarand Pradhan Mr. Ken Chiang ▪ Access to exclusive cargo offices
Group Chairman Group CEO from/to S.E. Asia, Australia,
Gulf states, Europe,
CP World CP World Americas
17Strong Client Relationships
Easy customer access ▪ 30% of total export tonnage through own network
Deep-rooted client relationships ▪ Around 50% of customers with Group for >5 years
Custom Brokers and Trusted service provider ▪ Low rate of customer attrition
Freight Forwarders
Relationships with Custom Brokers
– Both FCL and LCL
CHAs and freight forwarders – Majority of clients ship 60-70% of their cargo through TTSL
Relationships with freight forwarders
– Majority of TTSL’s freight forwarder customers, forward their cargo through TTSL and
have been associated with organisation for a long time
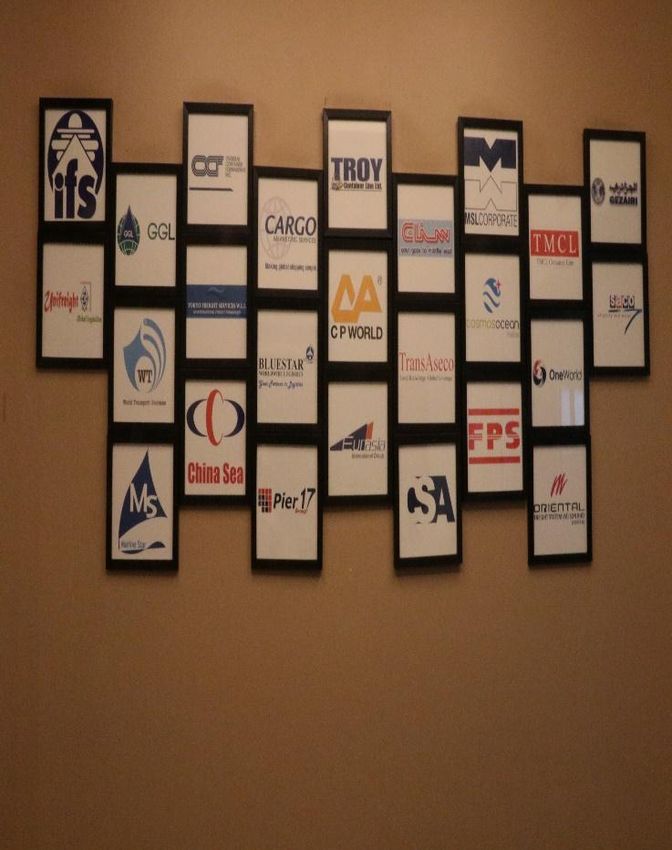
18Marquee Clients
19Strategic Footprint in India
▪ Cargo Sourcing: 17(including CP World) offices that
Presence in major cargo hubs
cover key cargo (export) hubs:
– North: Engineering goods, auto and auto
components marble, textiles, agri,
pharmaceuticals
– West: Chemicals, textiles, engineering and auto
– North Central: Agri goods, textiles, engineering,
carpets
– South: Engineering goods, textiles, auto and auto
components
CP World Presence
– East: Textiles, jute products, leather, iron & steel Major Ports/EXIM hubs
Key Cargo Regions
▪ Strategic tie-ups: To provide port based services such
as trailer transport, container transport etc.
20Half Yearly 03 Financial Highlights
Half Yearly Performance Metrics

        PAT (In Rs. Crore)                          PAT Margin %

                             2.5
                                                                    2.4%

  1.5
                                             1.4%

H1 FY17                 H1FY18              H1 FY17                H1FY18

                                                                            22
Balance Sheet Highlights
Networth (In Rs. Crore) Total Debt (In Rs. Crore)
32.4
17.8
9.4
12.4
As on 31st Mar'17 As on 30th Sep'17 As on 31st Mar'17 As on 30th Sep'17
23Half Yearly Financial Statements
Rs. Crore H1 FY18 H1 FY17
Revenue 103.73 109.95
Employee Expenses 7.19 6.69
Other Expenses 92.93 99.29
Total Expenditure 100.12 105.98
EBITDA 3.61 3.96
Depreciation 0.37 0.74
EBIT 3.24 3.22
Other Income 0.31 0.00
Finance Cost 1.03 1.76
PBT 2.52 1.46
Taxes 0.04 0.03
PAT 2.47 1.50
Minority Interest 0.00 0.01
PAT after Minority Interest 2.47 1.49
24Balance Sheet Highlights
th st th st
As on 30 As on 31 As on 30 As on 31
Rs. Crore Rs. Crore
Sept’17 Mar’17 Sept’17 Mar’17
Shareholder’s Funds 32.39 12.37 Non-current assets 9.30 11.15
Share capital 14.31 5.00
Fixed assets 7.88 9.85
Reserves & Surplus 18.09 7.37
Non-current Investments 0.04 0.01
Minority Interest 0.06 1.80
Long-term loans & advances 0.62 0.37
Non-current liabilities 4.51 5.70
Long term borrowings 1.68 2.75 Deferred Tax Assets 0.76 0.93
Long-Term Provisions 2.83 2.96 Current assets 56.07 49.16
Current liabilities 28.40 40.43
Trade receivables 33.68 32.50
Short Term Borrowings 7.76 15.03
Cash & Cash equivalents 3.82 2.35
Trade Payables 8.85 17.43
Short-term loans & Advances 18.57 14.30
Other Current liabilities 11.78 7.97
Total Equities & Liabilities 65.37 60.31 Total Assets 65.37 60.31
25Half Yearly Balance Sheet Highlights
To be Updated
Rs. Cr. As on 30th Sept 2017 As on 30th Sept 2016
Share Capital X.XX X.XX
Reserve & Surplus
Shareholders Funds
Minority
Deferred Tax Liabilities
Long Term Loan
Long Term Provisions
Total Current Liabilities
Source of Funds
Fixed Assets
Investments
Loans & Advances Annual
Deferred Tax Assets 04 Financial Highlights
Total Current Assets
Application of Funds
26Strong Annual Operational Performance
Revenue EBITDA
263.3 275.8 14.1 13.8
247.0
213.3 10.2 10.6
PAT
FY14 FY15 FY16 FY17 FY14 FY15 FY16 FY17
9.4
6.0 5.8
FY14 FY15 FY16 FY17
In Rs. Cr. -15.5 27Business Vertical Breakups
TEU’s ( in 000’s)
25.0
20.3 20.9
100% 20.0
4.1 4.2 15.3
15% 14.3
90% 18% 17% 15.0
24% 6.9 4.0
6.9 3.8
80% 10.0
15% 2.8 3.0 5.5 5.8
18% 5.0
70% 21% 2.3 2.0
6.5 6.8
16% 2.7 3.5
0.0
60% FY14 FY15 FY16 FY17
FCL Export FCL Import LCL Export LCL Import
50%
Export & Import % of Total Revenue
40%
70% 100%
65% 76% 77%
30% 61% 60% 80% 73% 75%
20% 60%
40% 27% 25% 24% 23%
10%
20%
0% 0%
FY14 FY15 FY16 FY17 FY14 FY15 FY16 FY17
Warehousing Freight Forwarding Consolidation
Export Import
28Annual Balance Sheet Performance
Net worth RoCE
22.1
124.9%
16.2
12.4
64.4% 62.6%
6.6
29.1%
FY14 FY15 FY16 FY17 RoNW FY14 FY15 FY16 FY17
58.1% 46.7%
27.1%
FY14 FY15 FY16 FY17
In Rs. Cr. -234.9% 29Annual Financial Statements
Rs. Crore FY17 FY16
▪ Company entered into business of CFS and
Revenue 213.27 247.02
developed capacity of handling around
Operating Expenses 175.18 205.62 13,000 containers by 2015. Due to regulatory
changes and loss of one of prime overseas
Employee Expenses 15.10 13.82 customer (which went bankrupt), this
diversification became unviable
Other Expenses 12.41 13.81
▪ Therefore decided to exit this business and
Total Expenditure 202.69 233.26 handed over CFS to government. Reported
EBITDA 10.58 13.77 loss of Rs. 15.49 cr in FY 15-16
Depreciation 1.12 1.55 ▪ Renewed focus on core business of LCL and
cargo consolidation and freight forwarding.
EBIT 9.46 12.22 This business contributed 95% in FY13,
reduced to 76% in FY16, has now gradually
Finance Cost 3.96 3.99 recovered to 85% in FY17
PBT 5.50 8.23 ▪ EBITDA margin and PAT margin of 5.4% and
3.6% respectively in FY14 dropped in FY 15
Exceptional Item - -24.62
and FY 16 and now recovered to 5.0% and
Taxes -0.22 -0.07 2.7% in FY17
PAT 5.72 -16.32 ▪ After drop in FY15 and FY16, RoCE and
RoNW have now recovered to 62.6% and
Share of Minority & Asso. -0.05 -0.83 46.7% in FY17, which is similar to FY14
numbers of 64.4% and 58.1% respectively
PAT after Minority 5.77 -15.49
3005 Way Ahead
Leveraging Opportunities

Opportunity: Strong Growth fundamental in
                                                             TTSL’s strengths:
Container Traffic:
                                                                       Leadership in cargo consolidation
                                                                          Strong domestic footprint
▪   Growth in India’s export-import trade
                                                                         Strong international network
▪   Increasing containerization of cargo
                                                                       Relationship with shipping lines
▪   Large port capacity expansion underway, both                            Operational Expertise
    major and non-major

▪   Plans   for      increasing   container   handling   Focused to
    capacity at major, non-major ports                   grow core
                                                                                                Market
                                                          activity
                                                              &                               dominance
▪   Highly fragmented cargo consolidation space
                                                         Air-Freight
    opportunities for large players

                                                                                                           32
Way Ahead
Large customer base and strong
relation with marquee clients
▪ Strong customer base and huge global network to
increase client count through reference and also
lead to increase volume
▪ Cross selling opportunity among existing clients via
play between FCL & LCL and expansion of import
and export
Door-to-door delivery Strong relationship with over
and Airfreight
▪ Large network and relationship
3 500 Customs Broker
▪ Large network and relationship
with CHA’s gives opportunity to
increase market share
2 4 with Customs Brokers gives
opportunity to increase market
share
Mining strong base over E- Commerce
1000 of small clients ▪ Consolidation for E-commerce
▪ Deepening business amongst 1 5 logistic players
network of small clients for
higher growth
33Disclaimer
All data and information is provided for informational purposes only and is not intended for any factual use. It should not be
considered as an offer of sale of services mentioned in this information memorandum. Neither Sarthi Capital Advisors Pvt. Ltd.
(SCAPL) nor any of its group companies, directors, or employees shall be liable for any of the data or content provided for any
actions taken in reliance thereon. Sarthi Capital Advisors Pvt. Ltd. is SEBI registered Category-1 Merchant Banker.
This document is a part of research only. In rendering this information, we assume and relied upon without independent verification,
the accuracy and completeness of all information that was publicly available, the information has been obtained from the sources
we believe to be reliable as to the accuracy or completeness. This information is given in good faith and we make no
representations or warranties, express or implied as to the accuracy or completeness of the information and shall have no liability
to you or your representatives resulting from use of this information.
This document contains certain “forward-looking statements”. These forward-looking statements can generally be identified by
words or phrases such as “aim”, “anticipate”, “believe”, “expect”, “estimate”, “intend”, “objective”, “plan”, “project”, “shall”, “will”, “will
continue”, “will pursue” or other words or phrases of similar meaning. Similarly, statements that describe strategies, objectives,
plans or goals are also forward-looking statements. Sarthi Capital Advisors Pvt. Ltd. cannot assure investors that the expectation
reflected in these forward-looking statements will prove to be correct. Given these uncertainties, investors are cautioned not to
place undue reliance on such forward-looking statements and not to regard such statements as a guarantee of future performance.
34Thank You
TOTAL TOTAL:IN TOTA.NS
For further information, please contact:
Company : Advisors :
Total Transport Systems Limited Sarthi Capital Advisors Pvt Ltd
CIN No. CIN No. U65190DL2012PTC238100
U63090MH1995PLC091063
Mr. Bhavik Trivedi info@sarthiwm.in
Company Secretary
ir@ttspl.in www.sarthiwm.in
www.ttspl.inYou can also read