Toward a Sustainable Cocoa Sector - Rainforest Alliance
←
→
Page content transcription
If your browser does not render page correctly, please read the page content below
April 2017

Toward a Sustainable Cocoa Sector
Effects of SAN/Rainforest Alliance Certification on
Farmer Livelihoods and the Environment
Deanna Newsom, Jeffrey C. Milder, and Matthew Bare

The Rainforest Alliance works to          233 Broadway, 28th Floor
conserve biodiversity and ensure          New York, NY 10279-2899
sustainable livelihoods by transforming   tel: +1.212.677.1900
land-use practices, business practices,   fax: +1.212.677.2187
and consumer behavior.                    rainforest-alliance.org
Contents

EXECUTIVE SUMMARY                                                                3

I. INTRODUCTION                                                                  5

II. HOW RAINFOREST ALLIANCE SUPPORTS SUSTAINABLE COCOA FARMS,                    6
LIVELIHOODS, AND LANDSCAPES

III. OUTCOMES AND IMPACTS OF SAN/RAINFOREST ALLIANCE COCOA                       8
CERTIFICATION

   Characteristics and Trends for SAN/Rainforest Alliance Cocoa Certification    8

   Adoption of Sustainable Practices on SAN/Rainforest Alliance Certified       10
     Cocoa Farms

     Protecting Forests and Biodiversity                                        11

     Improving Agronomic Practices and Boosting Yields                          13

     Addressing Entrenched Poverty and Child Labor                              14

     Improving Safety and Minimizing Overuse of Agrochemicals                   15

   Trends, Successes, and Challenges per Region                                 16

     West Africa                                                                17

     South America                                                              18

     Indonesia                                                                  18

   Impacts Research: Linking Sustainable Practices to Long-Term Change          19

IV. LOOKING TO THE FUTURE                                                       20

REFERENCES                                                                      21

ACKNOWLEDGMENTS                                                                 21

                                                                2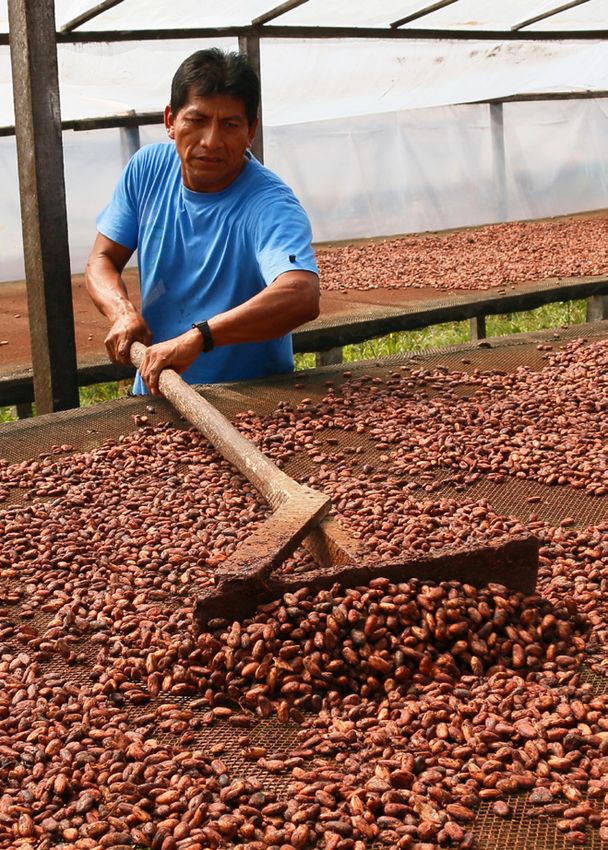
Executive Summary
The SAN/Rainforest Alliance cocoa program has grown rapidly sults from recent independent scientific studies evaluating the
over the past five years, with just under 1 million hectares of effects of the SAN/Rainforest Alliance certification program.
cocoa farmland in 15 countries achieving SAN/Rainforest Alli-
ance certification by the end of 2016. SAN/Rainforest Alliance The analysis focuses on four challenges of modern cocoa farm-
Certified™ cocoa now composes 13.4 percent of the world’s ing. The first challenge is the loss of natural ecosystems on
cocoa supply, with increasing numbers of commitments by and near cocoa farms, and the effects of this habitat loss on
large cocoa buyers to source sustainable cocoa. forest-dwelling animals and plants. Natural ecosystems are
compromised when cocoa farmers expand their cocoa plots
The Rainforest Alliance and its partner the Sustainable Agricul- into neighboring forests or eliminate native tree species from
ture Network (SAN) started working to mainstream sustain- their farms. The SAN Standard addresses this problem by re-
able practices in the cocoa industry through the SAN/Rain- quiring farmers to protect natural ecosystems and maintain
forest Alliance certification program in the late 1990s. Our adequate shade cover, tree species diversity, and connectivity
program establishes a norm for sustainable cocoa farming (the in crop areas. Certified cocoa farms in all regions complied ful-
SAN Standard), evaluates attainment of this norm by partici- ly with mandatory requirements to protect on-farm and off-
pating farmers, and awards Rainforest Alliance Certified status farm natural ecosystems. Farms in Ecuador and Peru complied
to farms meeting this standard. The program also helps build fully with recommended shade cover parameters, but farms
consumer demand and market incentives for sustainable co- in Ghana, Côte d’Ivoire, and Indonesia had substantially lower
coa products while simultaneously supporting cocoa produc- compliance rates in this area. We expect that recent regulatory
ers to farm more sustainably, productively, and profitably. changes in West Africa to rectify ambiguous tree ownership
laws, combined with ongoing farmer training on the benefits
Now that the program has been in place for nearly two decades, of shade cover in cocoa farms, will increase farmer interest and
it is critical to take stock of its results, reflect on successes and incentives to plant and tend canopy trees. Even with lower
limitations, and consider how the program could be adjusted compliance rates, however, two independent studies in West
in the future to build on successes while addressing remaining Africa found that SAN/Rainforest Alliance Certified cocoa
challenges. This report answers the question: what have been farms retained and/or replanted shade trees at a significantly
the effects of the SAN/Rainforest Alliance cocoa program on higher rate than non-certified farms.1
cocoa-producing farms, households, and landscapes?
A second challenge is low farm productivity, often caused by
To make this assessment, we analyzed performance for a large pests and disease, aging cocoa trees, and insufficient prun-
sample of certified cocoa farms (186 out of 266 total certif- ing. For low-income farmers, increasing farm productivity is
icates available at the close of 2015), representing just over a priority. The SAN Standard outlines productivity-boosting
170,000 individual farms across five countries: Côte d’Ivoire,
Ghana, Ecuador, Peru, and Indonesia. We also summarize re- 1 Addae-Boadu 2014, Borg & Selmer 2012
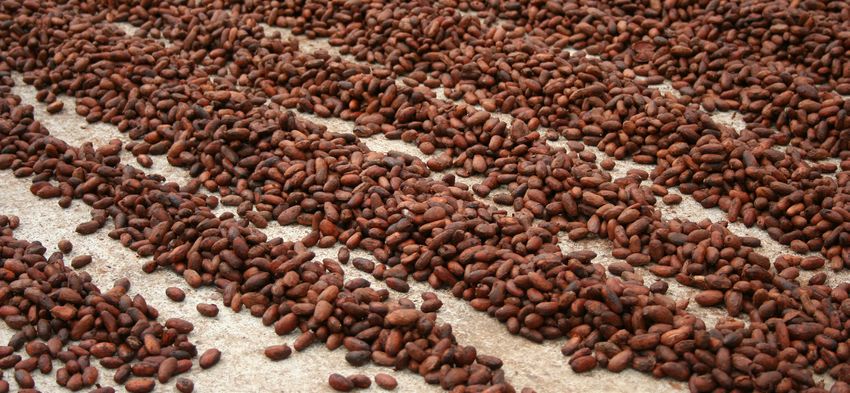
Rows of cocoa beans dry in the sun on a farm in Ecuador.
3
Executive Summary

practices, such as integrated pest management and fertiliza-            farms are required to comply with numerous criteria related
tion based on soil and crop need. Managers of group certifi-            to the use of personal protective equipment and the avoid-
cates are tasked with providing training to all group members           ance of 99 prohibited substances. Adoption of non-mandatory
on these and other aspects of SAN Standard implementation.              agrochemical safety best practices varied by country, but gen-
Data from the 188 certificates show that group training pro-            erally improved over time especially with regard to the use of
grams and systems are in place in all regions, with programs            personal protective equipment, emergency procedures, safe
being tailored to workers’ roles and suited to the local cultural       handling of agrochemicals, and agrochemical storage locations.
context. Implementation of these training programs has in-              Improvements were especially pronounced in Ghana and Côte
creased over time. Despite these programs, adoption of good             d’Ivoire. Independent research likewise found that SAN/Rain-
agronomic practices such as fertilization and pest control re-          forest Alliance Certified cocoa farmers in West Africa used
mained variable across the certified portfolio, with few distinct       protective equipment and safe agrochemical storage practices
trends. This may be due, in part, to the constant influx of new         at significantly higher rates than non-certified farmers.5
farmers to the program, resulting in static program-wide aver-
ages even as individual farmers improved their practices. This          Taken together, the evidence in this report reveals that SAN/
interpretation is supported by several independent studies              Rainforest Alliance cocoa farms around the globe are consis-
from West Africa, which found that cocoa yields2, profitability3,       tently implementing practices that address major environ-
and optimism about the future4 were higher on SAN/Rainfor-              mental and socioeconomic challenges associated with cocoa
est Alliance Certified farms than non-certified farms.                  farming. Where it exists, independent research supports these
                                                                                              findings, with certified farms showing
Cocoa farmers and farming communi-                                                            higher rates of sustainable practice im-
ties face a third critical challenge of en-
trenched poverty and, in some regions,           SAN/Rainforest                               plementation than non-certified farms,
                                                                                              as well as higher yields and profitabili-
child labor. Child labor, in particular,
must urgently be addressed, due to its        Alliance cocoa farms                            ty. In addition, results show that a core
                                                                                              concept of SAN/Rainforest Alliance—
long term negative impacts on children
and its threat to the viability of the co-    around the globe are                            the promotion of continuous improve-
                                                                                              ment toward sustainability—is being
coa sector as a whole. The SAN Stan-
dard places strict limits on the amount        consistently imple-                            achieved in practice, with performance
                                                                                              in many areas, such as agrochemical
of time that youth aged 15-18 can work
and the tasks they can perform, and             menting practices                             safety practices in West Africa, showing
                                                                                              robust improvement over time.
completely prohibits minors under 15
from farm work except on family farms          that address major                              The report also identifies a handful of
in very restricted circumstances. Across
the board, certified operations were           environmental and                               sustainability topics in specific regions
                                                                                               where performance was not as strong
found to comply fully with all require-
ments related to the employment of                socioeconomic                                or consistent as desired. These findings
                                                                                               point to the need for more concerted
minors and youth. With the exception
of one certificate in Ecuador, all certi-           challenges.                                efforts to improve training and further
                                                                                               support farmers to overcome barriers
fied farms complied with the SAN cri-                                                          to progress. Changes introduced in the
terion addressing access to education                                                          new 2017 SAN Standard (published in
for school-aged children, and nine out of ten certified farms           September 2016 and effective for audits as of July 1, 2017)
provided access to medical services for farmers, workers, and           will help better address many of these topics. For example, for-
their families.                                                         merly non-mandatory criteria related to integrated pest man-
                                                                        agement will become mandatory in the 2017 SAN Standard. In
Finally, exposure to hazardous agrochemicals can be a prob-             addition, the 2017 standard introduces the concepts of living
lem on cocoa farms, where a lack of protective equipment, in-           wage and essential needs to help drive improvements in farm-
sufficient knowledge of safe application and storage methods,           er livelihoods more systematically. The standard also codifies
and the use of banned pesticides can negatively affect the              the concept of continuous improvement more formally to help
health of workers, their families, communities, and nearby nat-         drive quantitative improvements in performance over time,
ural areas. The SAN Standard guides farmers to minimize the             beginning with the highest priority sustainability topics. These
need for agrochemicals by promoting integrated pest manage-             changes, combined with ongoing efforts to increase market
ment and non-chemical control measures; to the extent that              demand and market incentives for SAN/Rainforest Alliance
agrochemicals are applied, the standard includes numerous               Certified cocoa, are designed to drive increased uptake and
protective measures to minimize any associated risk. Cocoa              impact of the program, benefiting cocoa farmers, communities,
                                                                        and landscapes in more than a dozen countries.
2 Deppeler et al 2014
3 Addae-Boadu 2014, Oseni and Adams 2013
4 Bennett et al 2012                                                    5 Addae-Boadu 2014

                                                                    4
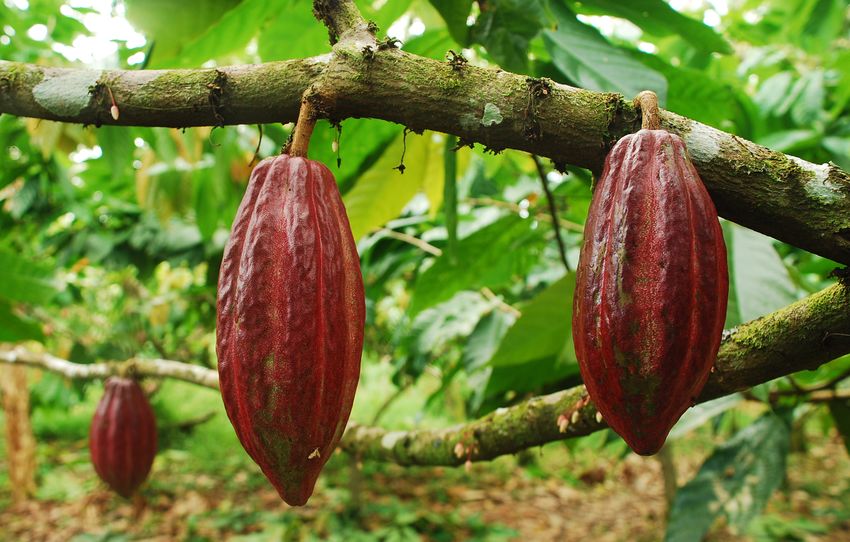
I. INTRODUCTION                                                         cocoa bean quality, prevent pest outbreaks, protect and re-
                                                                        store natural ecosystems, eliminate child labor, and address
If they could glimpse two thousand years into the future, the           other social and environmental challenges.
Mexican farmers who first domesticated cocoa trees would
likely be amazed at what they saw: a multi-billion-dollar in-           In the late 1990s, the first group of cocoa farmers achieved
dustry built around the humble unsweetened chocolate made               SAN/Rainforest Alliance certification after auditors deter-
from trees like theirs. They would marvel at the variety of choc-       mined it was in compliance with the SAN standard. In 2006,
olate bars, drinks, syrups, and all manner of sweetened cocoa           seeing a need to support cocoa farmers prior to the certifi-
confections. They would perhaps be even more surprised to               cation process, the Rainforest Alliance began training cocoa
learn that, despite chocolate’s popularity, most of the world’s         farmers on sustainable agronomic practices that would im-
five million cocoa farmers live in poverty and struggle against         prove farm productivity while conserving natural ecosystems
damaging cocoa pests, climate change, and the frequent ex-              both on and off the farm. Since then, the reach of certification
ploitation of children as laborers.                                     and associated training has expanded rapidly. By the end of
                                                                        2016, 247 cocoa producing groups—consisting of more than
The vast majority of the cocoa farmers around the world to-             200,000 individual farms in 15 countries—had become Rain-
day are smallholders who, along with their families, depend             forest Alliance Certified. These farms produce 13.4 percent
directly on cocoa farming for their livelihoods. But life can be        of the world’s cocoa. The demand for certified cocoa is likely
difficult for these farmers. Productivity                                                      to increase since large chocolate com-
is often low due to a lack of agricultur-                                                      panies and retailers such as Mars, Her-
al training on productivity- and quali-                                                        shey’s, Ferrero, Unilever, Tesco and oth-
ty-boosting practices, and inadequate                                                          ers have made commitments to source
access to inputs such as fertilizers.                                                          100 percent sustainable cocoa in the
Maintaining, let alone increasing, yields                                                      years ahead.
requires the time and knowledge to ef-
fectively prune cocoa trees, keep pests                                                        Given the rapid spread of SAN/Rainfor-
and weeds in check, and maintain soil                                                          est Alliance certification and associat-
fertility. Improper use and storage of                                                         ed training programs, and the growing
agrochemicals can jeopardize the health                                                        demand for certified cocoa, now is an
of farm owners, workers, and their fam-                                                        important time to assess the available
ilies, while child labor has long been                                                         evidence on the results of these pro-
widespread on cocoa farms in West                                                              grams. Doing so can help document
Africa, denying children educational op-                                                       progress made to date while also high-
portunities and putting their health and                                                       lighting areas in which further improve-
safety at risk. Cocoa farming can also                                                         ments are needed. In this report, we
have a negative environmental impact                                                           present results of the Rainforest Alli-
when production expands into nearby                                                            ance’s cocoa sustainability programs by
forests or other natural areas, pollutes                                                       addressing three evaluation questions:
local waterways, or degrades the soil.
While cocoa can be grown in biodiverse                                                         1.    What are the extent of these
agroforestry systems with a rich shade                                                          programs, and what are the char-
canopy of native tree species, in reality     Abel Yaranga spreads cocoa beans over a           acteristics of the farmers and land-
many cocoa farms have few shade trees,        drying table on his farm in Peru. Photog-         scapes they reach? Answers to this
to the potential detriment of both en-        rapher: David Dudenhoefer                         question    demonstrate   the   mar-
vironmental and agricultural outcomes.                                                          ket penetration of cocoa certifica-
                                                                                               tion and the potential magnitude of
The Rainforest Alliance, together with the Sustainable Agricul-              field-level results based on the number of partici-
ture Network (SAN), has been addressing these challenges in                  pating farmers and the land area under certification.
the cocoa sector since the late 1990s, when it broadened the
scope of its sustainable agriculture program from coffee and            2.   To what extent are certified cocoa farmers adopting
bananas to cocoa. As with all crops, the core of the SAN/Rain-               sustainability best practices, and how does this change
forest Alliance cocoa certification program is the SAN Standard,             over time in association with certification? This infor-
which defines a norm of sustainable agriculture with which all               mation reveals whether farmers are taking steps toward
participating farms must comply. Compliance with the stan-                   more sustainable production, as well as how patterns and
dard is assessed through a rigorous set of audit procedures,                 trends differ between West Africa, South America, and
and successful farms are awarded Rainforest Alliance Certified               Indonesia, the world’s three largest cocoa-growing areas.
status and afforded use of a market label that helps promote
consumer choice of sustainable products. A key complement               3.   What additional information on impacts of Rainforest Al-
to the certification process is farmer training, conducted by                liance certification or training is available from indepen-
Rainforest Alliance agronomists or local partners, to help pre-              dent scientific studies? Such studies can provide highly
pare farmers to become certified or support further improve-                 credible information on the attributable effects of certifi-
ment once certified. These hands-on training programs teach                  cation on farm productivity, farmer and family livelihoods
farmers about practices to increase farm productivity, improve               and wellbeing, and the environment.

                                                                    5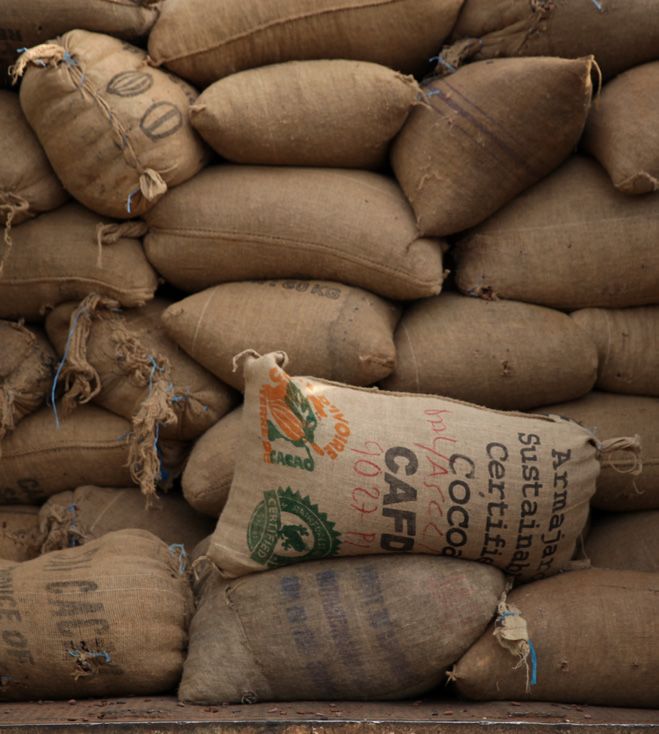
Figure 1. Rainforest Alliance Certified cocoa production and consumption

countries where certified cocoa is:
  produced and sold
  sold
  produced

In addressing these questions, we focus on five countries that            standards and policies are revised periodically. The newest
collectively account for about 90 percent of Rainforest Alli-             version of the standard, called the 2017 SAN Standard, was
ance Certified cocoa: Cote d’Ivoire, Ghana, Indonesia, Ecuador,           published in September 2016 and will become effective for
and Peru.                                                                 audits starting in July 2017.

This report first describes the Rainforest Alliance’s certification       To achieve certification, farms must undergo annual audits by
and training programs in greater detail. It then addresses each           SAN-accredited certification bodies, which determine whether
of the three sets of evaluation questions in sequence. Finally, it        farms or farm groups are in compliance with the SAN Standard.
concludes with a summary of key opportunities and needs for               During the audit, compliance to each SAN criterion is careful-
improving the outcomes of cocoa sustainability initiatives and            ly assessed, with farms scored as “fully compliant,” “partially
the evaluation thereof.                                                   compliant,” or “non-compliant” with each applicable criterion.
                                                                          These compliance levels are given numerical values (100 for
II. HOW RAINFOREST ALLIANCE SUPPORTS SUSTAIN-                             full compliance, 50 for partial compliance, 0 for non-compli-
ABLE COCOA FARMS, LIVELIHOODS, AND LANDSCAPES                             ance) that are rolled up into a final score. Applicants may attain

At the core of the SAN/Rainforest Alliance system is the SAN
Sustainable Agriculture Standard (SAN Standard), which out-
lines the requirements for cocoa farms to become certified.                  Principles of the 2010 SAN Standard
Developed by the SAN6 through a multi-stakeholder process
that includes farmers, scientists, civil society groups, and in-             1.  Social and environmental management system
dustry, the 2010 SAN Standard contains 100 criteria that, to-                2.  Ecosystem conservation
gether, define sustainable agriculture and farm management.                  3.  Wildlife protection
These criteria cover topics ranging from ecosystem conserva-                 4.  Water conservation
tion to fair treatment of workers to alternative pest control                5.  Fair treatment and good working conditions for
measures. Farms that wish to become certified as part of a                       workers
cooperative or other group structure must also address the 23                6. Occupational health and safety
criteria of the SAN Group Certification standard, which cover                7. Community relations
topics such as internal inspections and group governance. The                8. Integrated crop management
SAN Sustainable Agriculture Standard and supporting SAN                      9. Soil management and conservation
                                                                             10. Integrated waste management
6 Sustainable Agriculture Network, http://san.ag/web/

                                                                      6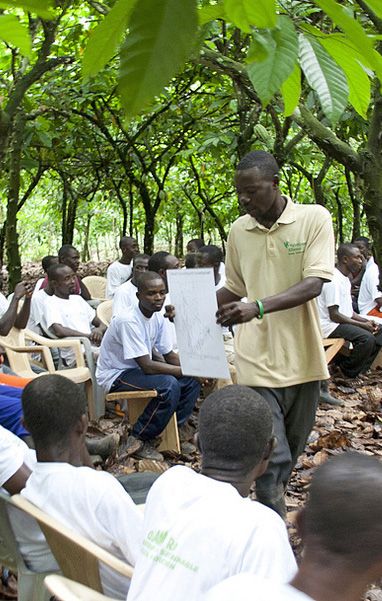
Cocoa and the SAN/Rainforest Alliance Theory of Change

   As mission-driven organizations, the SAN and the Rainfor-                       while also reducing greenhouse gas emissions. Cocoa farms
   est Alliance have developed a “Theory of Change”* for their                     are also expected to become more productive, efficient, and
   jointly run certification program to specify how the pro-                       profitable—thereby ensuring that agriculture can form the
   gram’s activities—including training, certification, and im-                    basis of a decent livelihood for farmers, workers, and their
   proved farmer access to critical farm inputs—are expected                       families. Finally, certification is designed to help safeguard
   to deliver key social, environmental, and economic benefits                     worker rights and benefit smallholders through effective
   for farmers, communities, and natural ecosystems. In addi-                      and transparent management of group structures that sup-
   tion to clearly defining the program’s objectives, the Theo-                    port sustainable farm management and product marketing,
   ry of Change also provides a framework for evaluating the                       often to international buyers with commitments to sustain-
   extent to which the program has delivered its anticipated                       able cocoa.
   direct, indirect, and broader results.
                                                                                   The SAN and the Rainforest Alliance aim to support sus-
   In relation to cocoa farming, the Theory of Change indicates                    tainability improvements not only at the level of individual
   that certification, training, and support activities should                     farms, but also more broadly across landscapes and value
   lead to the adoption of more sustainable farm practices and                     chains. To this end, the program aims to establish a positive
   therefore to improved social well-being, economic viability,                    feedback loop whereby companies realize value from sus-
   and environmental sustainability of cocoa farms. Specifical-                    tainable sourcing and therefore choose to invest more in in-
   ly, the activities will not only protect on-site conservation                   creasing the sustainability of their supply base. At the same
   values (e.g., by conserving existing natural ecosystems, re-                    time, as neighbors, governments, and other stakeholders
   storing native vegetation, and protecting endangered spe-                       see the benefits of sustainable agriculture on certified
   cies), but also support conservation at a landscape level by                    farms, best practices are scaled up and contribute to wider
   maintaining wildlife corridors and preventing encroach-                         aggregate benefits at the community and landscape scale.
   ment. Through the adoption of good agronomic practices, it
   is expected that cocoa farms will maintain and improve soil                     Understanding the causal links between an organization’s
   health, reduce erosion, minimize water pollution, and use                       activities and desired outcomes is an ongoing process. Eval-
   water in an efficient manner. By sustaining such key natural                    uation studies such as the ones presented in this report
   resources, farms should also reduce their input costs and                       help clarify the extent to which the benefits described in
   become less susceptible to droughts and pest outbreaks,                         the Theory of Change are actually being delivered in prac-
                                                                                   tice. Where results are less than expected, this information
   * See http://www.rainforest-alliance.org/sites/default/files/2016-08/SAN_       can suggest ways that the program might be improved, or
   RA_Impacts_Report.pdf#page=16 for a visual representation of the SAN/           that the logical framework should be revised.
   Rainforest Alliance Theory of Change

certification only if they achieve a total score of 80 or above                    trainer” sessions, the Rainforest Alliance or SAN agronomists
for the entire standard and achieve a score of 50 or above for                     provide the trainees with a package of training materials7 and
each of the 10 component principles in the standard and are                        modules that are specifically geared towards farmers. These
in full compliance with 23 critical criteria. Cocoa produced                       local trainees then become trainers themselves, working di-
on certified farms may be sold and commercialized using the                        rectly with farmers in six to 12 sessions that each address one
Rainforest Alliance Certified label.                                               specific topic, such as best agronomic practices, occupational
                                                                                   health and safety, recordkeeping, and climate-smart agricul-
While the SAN Standard provides a framework and set of best                        ture. In addition to training, cocoa farmers often receive ac-
practices for improving the productivity and sustainability of                     cess to key inputs such as fertilizers and finance before the
cocoa farming, to implement this framework widely among                            certification audit. Recent research in Ghana found that finan-
smallholder cocoa farmers may require providing them with                          cial support, knowledge, technical assistance, and increased
training and other kinds of support, such as access to quality                     access to farm inputs and credit produced significant positive
inputs, planting materials, or farm record-keeping assistance.                     impacts on Rainforest Alliance Certified cocoa farmers’ natural
The majority of cocoa farmers seeking Rainforest Alliance                          and financial capital.8
certification receive training and support to institute sustain-
able farming practices before they undergo a certification au-                     Once the cocoa leaves the farms, the Rainforest Alliance trac-
dit. Such training is usually conducted by agronomists from                        es it through the supply chain to the final chocolate manu-
in-country NGO partners, government agencies, or company                           facturers. This traceability—along with Chain of Custody (CoC)
partners, often based on training modules developed by the                         audits of the supply chain—help to protect the integrity of the
Rainforest Alliance. A typical training program is based on a                      Rainforest Alliance Certified™ seal on chocolate products that
two-tiered training approach. First, Rainforest Alliance or                        consumers buy in stores. The manufacturers must source the
SAN agronomists train the staff of local NGOs or group ad-
ministrators, usually in three-to-four-day sessions that are half                  7 http://www.sustainableagriculturetraining.org/
classroom-based and half field-based. During these “train the                      8 Fenger et al. 2017

                                                                               7
Training Cocoa Farmers in West Africa
The Rainforest Alliance’s technical assistance work in West Africa began in Côte
d’Ivoire in 2006, through a partnership that involved cocoa growers’ cooperatives,
a large cocoa-buying company (Kraft) and the national government. This model was
replicated in Ghana in 2008 under a similar partnership with Mars Inc., the Ghana
Cocoa Board, and a consortium of civil society partners. By 2009, this approach be-
gan generating economic returns for farmers. These benefits, combined with grow-
ing commitments from major brands and consumer goods companies such as Mars,
Kraft, and Unilever to shift their cocoa purchases toward a certified sustainable sup-
ply, provided the impetus for rapid growth of the program beginning around 2010.
The training program received a major boost in 2011 when the Rainforest Alliance
received support from the Global Environmental Facility to execute the Greening
the Cocoa Industry project in Ghana and several other countries. The Rainforest
Alliance partnered with Olam International in Ghana’s Juabeso-Bia District to train
more than 2,000 cocoa farmers from 34 communities on climate-smart agriculture
(CSA) practices and sustainable forest management, and to facilitate the estab-
lishment of two nurseries that raised 300,000 tree seedlings. These efforts are
expected to sequester an estimated 140,000 metric tons of carbon dioxide equiv-
alent (CO2-e) over 20 years.
cocoa from the certified farms and have traceability documen- SAN/Rainforest Alliance cocoa certification program through
tation that ensures that the volume of cocoa sold from the three different lenses. First, we describe the current reach
certified farms through each point in the supply chain does and characteristics of the cocoa program, to help understand
not exceed what is produced or purchased at each step. Each the potential for market transformation and field-level effects.
claim of Rainforest Alliance Certified cocoa or use of the Rain- Next, we use data from SAN/Rainforest Alliance certification
forest Alliance Certified seal requires a signed license agree- audit reports to identify the rates at which cocoa farmers are
ment and must be approved in advance by the Rainforest Alli- adopting sustainable agronomic practices on and around their
ance. Together, these requirements help ensure that products farms, and how those rates change over time. Lastly, we sum-
with the seal are credible, they encourage sourcing from cer- marize the small but growing body of independent research
tified farms, and they empower consumers to leverage their that uses scientific methods to identify the impacts of SAN/
purchasing power in support of sustainable practices on and Rainforest Alliance certification on farm productivity and a
around cocoa farms. handful of other variables.
Characteristics and Trends for SAN/Rainforest Alliance
III. OUTCOMES AND IMPACTS OF SAN/RAINFOREST Cocoa Certification
ALLIANCE COCOA CERTIFICATION
At the close of 2016, there were 247 SAN/Rainforest Alliance
In this section we examine the outcomes and impacts of the cocoa certificates globally, consisting of 206,426 individu-
Figure 2. Percentage of SAN/Rainforest Alliance Certified cocoa produced in each country in 2016
Côte d’Ivoire 63.5%
Tanzania 1.7%
Dominican
Ecuador Indonesia
Ghana 18.2% Republic Peru 1.1%
5.3% 4.4%
4.3%
other 1.5%
8Figure 3. Trends in Rainforest Alliance Certified cocoa production Figure 4. Trends in total quantity (in metric tons) of Rainforest
area (in hectares) Alliance Certified cocoa produced
900,000 600,000
800,000
500,000
700,000
600,000 400,000
500,000
300,000
400,000
300,000 200,000
200,000
100,000
100,000
2010 2011 2012 2013 2014 2015 2016 2005 06 07 08 09 10 11 12 13 14 15 16
al farms. The vast majority of these (96.8 percent) are group 692,228 hectares of which is used for cocoa production. The
certificates, wherein hundreds to thousands of individual remaining 272,248 hectares consists of natural areas, ripari-
smallholder cocoa farmers are organized into a group that col- an buffer zones, infrastructure zones, areas producing other
lectively seeks certification. Under this model, a designated crops, or other non-farm uses. In all, SAN/Rainforest Alliance
group administrator is responsible for helping to ensure mem- Certified cocoa farms produced 473,480 metric tons of cocoa
bers’ compliance with the SAN Standard, training and support- in 2016, representing about 13.4 percent of the world’s cocoa
ing members to achieve and maintain compliance, and holding production.
the certificate. SAN/Rainforest Alliance Certified cocoa-farm-
ing groups contain an average of 864 members each, although Compared to previous years, the amount of certified produc-
size varies considerably. The individual farms that make up the tion area and quantity of cocoa produced declined slightly in
group are typically owned and operated by smallholder farm- 2016 (Figures 3 and 4). We attribute this decline primarily to a
ers, and have an average farm size of 7.7 hectares, with 5.0 mismatch in the supply versus the demand for certified cocoa.
hectares of that area used for cocoa production. Individual Specifically, demand for certified cocoa has been growing in
(non-group) certificates consist of a farm under single own- steps, as major cocoa buyers that have committed to certified
ership. These cocoa farms are typically much larger, with an sustainable sources are ratcheting up their purchases incre-
average size of 971 hectares, of which 214 hectares are used mentally toward future targets (e.g., 2020). During this phase-
to produce cocoa. in period, some certified producers experienced weak demand
for certified produce and may have dropped certification. In
The combined total area of SAN/Rainforest Alliance Certi- other words, in the period of rapid growth from 2011-2013,
fied cocoa farms at the end of 2016 was 964,476 hectares, the production of certified cocoa may have overshot demand;
Training Cocoa Farmers in Indonesia
The Rainforest Alliance has been training and supporting Gunung Lompobattang Protected Forest in South Sulawesi.
smallholder cocoa farmers in Central and South Sulawesi,
Indonesia, since 2012. In 2013, through bilateral coopera- In 2014, with funding from the Ford Foundation, the Rain-
tion with Mars Inc., the Rainforest Alliance piloted a training forest Alliance began training 750 farmers in Central Su-
module that focused on farm recordkeeping as a catalyst to lawesi on farm management and post-harvest handling
drive the adoption of good agronomic practices, including practices, and helped them establish group structures and
proper and efficient input use and the rehabilitation of old build the business capacity of group administrators. The
planting stock and degraded soils to boost farm productivi- success of these smaller programs has helped catalyze a
ty. This approach was adopted by smallholder cocoa farmers broader four-year partnership with Olam International and
with little or no prior experience in recordkeeping, and has GrowCocoa aimed at incentivizing 8,000 cocoa smallhold-
since been replicated, first in other cocoa producing regions ers in South and Southeast Sulawesi to implement farm-
and now much more widely as a core element of the 2017 ing practices that will optimize yields, help guard against
SAN Standard. Other training modules instructed farmers climate change-induced risks, support farmer resilience,
on soil and water conservation strategies, and explained key improve cocoa quality, and enable greater access to stable
safeguards in the SAN Standard to conserve biodiversity marketing channels.
and protect wildlife habitats, for instance in and around the
9Table 1. Characteristics of SAN/Rainforest Alliance certified operations in the six countries with the most certified cocoa area, as of
December 2016
Dominican
Côte d’Ivoire Ghana Ecuador Republic Indonesia Peru
Total certi- 648,238 168,186 41,913 27,233 21,885 13,549
fied area (ha)
Total cocoa 472,172 128,390 19,439 23,980 21,547 3,319
production
area (ha)
Volume of 300,480 86,266 24,911 20,406 20,953 5,203
cocoa pro-
duced (kg)
Avg. yield 671 578 931 837 933 1,373
(kg/produc-
tion ha)
Individual 2 0 3 0 0 0
certificates
Group 172 12 17 4 9 7
certificates
Total number 99,323 47,548 2,584 5,067 14,794 1,284
of farms
Avg. farm 6.9 3.6 20.9 13.3 1.6 11.0
size (ha)
(group mem-
bers only)
Avg. farm 5.0 3.2 10.1 12.3 1.6 3.4
production
area (ha)
(group mem-
bers only)
however, this overshoot is anticipated to be temporary as considerable variability in farm size and productivity among
commitments to sustainable purchasing are fully phased in regions. See Figures 5, 6, and 7 for maps showing locations
during the next few years. Several initiatives are underway to of SAN/Rainforest Alliance Certified cocoa farms in Ecuador,
accelerate market demand for certified cocoa so that produc- Peru, Côte d’Ivoire, Ghana, and Indonesia.
ers can benefit more fully from their certified status. These
initiatives include the introduction of a cocoa “mass balance” Adoption of Sustainable Practices on SAN/Rainforest
option, which allows manufacturers, brands, and retailers to Alliance Certified Cocoa Farms
source and label SAN/Rainforest Alliance cocoa even when it
is not feasible to keep certified and non-certified product sep- The SAN Sustainable Agriculture Standard and associated
arate in the supply chain. farmer training emphasize the adoption of more sustainable
farming practices related to agronomy, farm record-keeping,
In 2016, 64 percent of SAN/Rainforest Alliance Certified co- pesticide use, shade canopy management, water resource
coa was produced in Côte d’Ivoire, 18 percent in Ghana, five protection, natural ecosystem protection, and more. During
percent in Ecuador, four percent in Indonesia, and one per- the certification audit, whether or not farmers actually adopt
cent in Peru (Figure 2 and Table 1). Ten additional cocoa-pro- these practices is recorded in the audit report, where the level
ducing countries, which are not the primary focus of this re- of compliance—full, partial, or non-compliance—is assessed for
port, account for the remaining 7.5 percent of certified cocoa each of the SAN Standard’s 100 criteria. In this section, we
production. Table 1 describes the characteristics of the SAN/ quantify the extent to which different sustainable practices
Rainforest Alliance Certified portfolio in the six countries with have been adopted on certified farms, using information from
the largest amount of certified cocoa area. This table shows farm audit reports.
10Figure 5. SAN/Rainforest Alliance cocoa certificates in Figure 6. SAN/Rainforest Alliance cocoa certificates in
South America West Africa
countries included in audit report analysis countries included in audit report analysis
SAN cocoa certificates SAN cocoa certificates
ECUADOR
CÔT E D’ IVOIRE GHA NA
0 100 200 400 km
N
Figure 7. SAN/Rainforest Alliance cocoa certificates in Indonesia
P ERU
countries included in audit report analysis
SAN cocoa certificates
0 100 200 400 km
N
We analyzed the audit data in two ways. First, we assessed
current performance at the time of the most recent audit for
186 active cocoa certificates in the five countries on which this
report focuses. Second, for the subset 90 of certificates for 0 500 1,000 2,000 km
N
which a time series of two or more audit reports were available,
we assessed changes in performance between the earliest and
most recent audit. Both analyses focus especially on the 26
SAN criteria (out of the 100 total criteria) that most directly in full compliance with this criterion and two in partial compli-
address four key challenges associated with cocoa production: ance, would be 75 ((100+100+50+50)/4).
1) forest encroachment and biodiversity loss; 2) poor agrono-
my and low yields; 3) entrenched poverty and child labor; and In the following subsections, we report results related to each
4) exposure to hazardous agrochemicals. of the four challenge areas listed above, followed by a summa-
ry of key differences and trends among the different regions
The analyses in this section calculate an average compliance where SAN/Rainforest Alliance Certified cocoa is produced.
score for each country for each criterion in the 2010 SAN farm
standard and SAN group certification standard. This score is Protecting Forests and Biodiversity
calculated by assigning 100 points for full compliance with a
given criterion, 50 points for partial compliance (i.e., a minor Cocoa is grown in regions dominated by moist tropical forests
non-conformity), and 0 points for a major non-conformity, as that are typically high in biodiversity. When cocoa farms are
determined by the auditors. For example, the compliance score established, some or all forest cover is eliminated to make
for the SAN criterion related to soil erosion control measures way for cocoa trees, which typically displace at least some
for a hypothetical country that had four cocoa certificates, two native biodiversity. However, these impacts can be mitigated
11by planting cocoa under a shade canopy of native trees (i.e., connectivity of natural ecosystems and buffer areas around
agroforestry) and by retaining other on-farm natural vegeta- streams and other water bodies can also help protect forests
tion such as riparian buffers. In addition to helping protect bio- and biodiversity.
diversity, such measures can also significantly improve cocoa
yields9 by supporting pollinators, preventing pest damage, and Audit results indicate that SAN/Rainforest Alliance Certified
protecting against drought and soil loss. However, in some re- cocoa farms are fully protecting on-farm natural ecosystems
gions, farmers tend to retain little native vegetation on their and effectively addressing off-farm encroachment into neigh-
farms. Additionally, as poor farming practices lead to pest boring conservation areas. Generally, certified operations also
and disease outbreaks, decreased soil fertility, and low yields, performed well for criteria related to maintaining adequate
some farmers feel compelled to further expand production buffer zones between crops and aquatic areas (criterion 2.6)
into nearby natural forests. and maintaining adequate connectivity of natural ecosystems
on the farm (2.9).
To address these challenges to on- and off-farm biodiversity,
the SAN Standard contains critical criteria that require farm- However, many certified cocoa farms in West Africa and In-
ers to protect and restore natural ecosystems (criterion 2.1), donesia did not maintain sufficient tree canopy cover or spe-
and renders farms that have damaged high value ecosystems cies diversity to comply fully with criterion 2.8 (agroforestry
in recent years ineligible for certification (criterion 2.2). Crite- shade cover). Compliance scores for criterion 2.8 during re-
rion 2.8 specifies that farmers should manage their cocoa as cent audits averaged only 25 in Côte d’Ivoire, 34 in Ghana, and
a diverse agroforestry system with at least 40 percent shade 55 in Indonesia. In contrast, all of the evaluated operations in
canopy cover, at least 12 tree species per hectare, and at least Ecuador and Peru fully complied with this criterion. The re-
two vertical layers of canopy cover. Other criteria addressing gional differences in performance related to shade cover man-
agement illustrate the legacy that historical factors and legal
9 Asare 2016
frameworks can have on current practices. When cocoa farms
Table 2. Average compliance score at most recent audit for criteria that address forest encroachment and biodiversity loss. Compliance
scores range from 0 to 100; operations are awarded 0 points for non-compliance, 50 points for partial compliance, and 100 points for
full compliance. Compared with previous audit scores, indicates an increase of 25–45 points, indicates an increase of 11–24
points, indicates a decrease of 11–24 points, indicates a decrease of 25–45 points. Changes of +/- 10 points are not indicated.
The first sample size presented is the number of certificates used to calculate the most recent score; the sample size in parenthesis is the
number of certificates included in the time series analysis. In the left column, critical criteria are denoted by an asterisk (*).
Côte
All regions d’Ivoire Ghana Ecuador Peru Indonesia
Sample size 186 (90) 124 (50) 28 (17) 16 (10) 7 (6) 11 (7)
2.1* Protect/restore 100 100 100 100 100 100
natural ecosystems
2.2* No destruction of 100 100 100 100 100 100
natural ecosystems
2.3 No harm to nearby 100 100 100 100 93 100
natural areas
2.6 Buffer between 83 81 98 97 93 45
crops and aquatic
areas
2.8 Adequate tree 37 25 34 100 100 55
diversity, shade
cover, and natural
vegetation
2.9 Maintain connec- 78 73 100 66 86 91
tivity of natural
ecosystems
Average for above criteria 83 80 89 94 95 82
12Farmer Voices
Vida Tsatso, a cocoa farmer at Nkranfum, Ghana, shares her views on cocoa farm-
ing before and after training with the Rainforest Alliance:
“I have now realized there were so many things we used to think and do that were nor-
mal practices from time immemorial, and just did not think that some of these practices
were negatively affecting our lives, the soil, water bodies and our environment. We used
to clear the trees and other forms of vegetation that used to be around water bodies. I
used to fell the bigger trees on my cocoa farm because I didn’t see the reason why they
should be on my farm. The worst of all was that these trees attracted the chainsaw
operators who would come and fell them, causing damage to my cocoa trees. So the
safest thing that I thought was to kill these trees when they were young.”
were established years ago in South America, they were typi- the importance of overstory trees and shade cover and begun
cally established under an existing forest canopy: some trees planting more trees; however, since it typically takes at least
were removed to provide light to cocoa seedlings but many five years before trees are large enough to fulfill the require-
existing trees were retained as canopy cover. In West Africa, ments of criterion 2.8, there will be a time lag before these
in contrast, forests were typically felled when establishing improvements affect compliance scores.
cocoa farms, and overstory trees had to be actively planted
afterwards. An additional factor inhibiting agroforestry man- Improving Agronomic Practices and Boosting Yields
agement in West Africa was a legal framework that failed to
give farmers clear ownership of the trees on their land. This Yields on smallholder cocoa farms are generally far below
situation opened the door for unscrupulous loggers to remove where they could be, due to sub-optimal management of pests
overstory trees from cocoa farms without the farm owner’s and diseases, soil fertility and fertilization, and a lack of rejuve-
permission, often using machinery that damaged cocoa trees nation practices such as pruning. For instance, in Ghana, cocoa
in the process. As a result, many farmers felt they had no farms following either a sustainable intensification program
choice but to eliminate shade trees and seedlings from their (as promoted by SAN/Rainforest Alliance certification) or con-
farms to protect their cocoa crop. Compounding the legal fac- ventional full-sun intensification (which is not eligible for Rain-
tor, in many cases, is an incorrect assumption on the part of forest Alliance certification) can approach or exceed yields of
farmers or local extension workers that shade cover is detri- 1,000 kilograms per hectare per year (kg/ha/yr), compared to
mental to crop productivity. a baseline of unimproved practices that yield less than 300 kg/
ha/yr, according to models.10 Two key SAN Standard criteria
Despite these barriers, Rainforest Alliance agronomists in that promote improved agronomic practices are criterion 8.1,
West Africa report that in recent years farmers have accepted which addresses integrated pest management and pest moni-
toring, and criterion 9.2, which specifies a soil and crop fertil-
ization approach based on periodic soil sampling and analysis
and prioritizing the use of organic fertilizers. The requirements
The Sustainable Yields Module of the training programs through which smallholder cocoa
farmers typically learn about these practices are outlined in
In 2011, with support from Mars Inc. and later the Dutch criteria 1.1 and 1.4 of the group certification standard, which
Sustainable Trade Initiative (IDH), the Rainforest Alliance require trainings be conducted in the local language and are
developed the Sustainable Yield Module (SYM), a series suited to the local context.
of training modules that describe best practices for in-
creasing cocoa farm productivity. The SYM was piloted Audit data indicate that the certified cocoa farms are tailoring
with smallholder cocoa farmers in Cote d’Ivoire, Indo- farmer training programs to the local context, and, in most
nesia, Ghana and Peru. In Cote d’Ivoire, measurements countries, are performing other aspects of training well. Nota-
taken by Rainforest Alliance partner Centre d’Etudes, bly, there was evidence of improvement over time in training
Formations, Conseils et Audits (CEFCA) indicate that performance for nearly all countries we examined.
productivity increased by 86 percent over a two-year pe-
riod on 40 farms implementing the SYM (though the lack With regard to integrated pest management and soil and crop
of a control group limits our ability to attribute increases fertilization, audit results indicate considerable room for im-
solely to the SYM). Since then, the SYM has remained a provement in most countries, with overall compliance scores
core element of technical assistance around the world
and informed the development of the 2017 SAN Stan- 10 Gockowski, J., Afari-Sefa, V., Sarpong, D. B., Osei-Asare, Y. B., & Agyeman,
dard, particularly on productivity-related topics such as N. F. (2013). Improving the productivity and income of Ghanaian cocoa farmers
integrated pest management and farm renovation and while maintaining environmental services: what role for certification? Interna-
rehabilitation. tional Journal of Agricultural Sustainability, (February), 1–16. http://doi.org/10.10
80/14735903.2013.772714
13Table 3. Average compliance score at most recent audit for criteria that address low yields associated with poor agronomy. Compliance
scores range from 0 to 100; operations are awarded 0 points for non-compliance, 50 points for partial compliance, and 100 points for
full compliance. Compared with previous audit scores, indicates an increase of 25–45 points, indicates an increase of 11–24
points, indicates a decrease of 11–24 points, indicates a decrease of 25–45 points. Changes of +/- 10 points are not indicated.
The first sample size presented is the number of certificates used to calculate the most recent score; the sample size in parenthesis is
the number of certificates included in the time series analysis. In the left column, criteria from the SAN group certification standard are
denoted by the prefix “G.”
Côte
All regions d’Ivoire Ghana Ecuador Peru Indonesia
Sample size 186 (90) 124 (50) 28 (17) 16 (10) 7 (6) 11 (7)
1.9 Training and 87 90 96 72 64 64
education program
8.1 Integrated pest 64 58 77 81 50 77
management
9.2 Soil or crop fertil- 62 50 100 69 71 73
ization program
G1.1 Training program 76 77 84 70 71 64
for group members
G1.4 Training suited 99 99 95 100 100 100
to local cultural
context
Average for above criteria 78 75 90 78 71 76
of 64 and 62, respectively. There is evidence that operations dard includes new critical criteria on integrated pest manage-
in Ghana and Peru have improved their practices related to soil ment and other aspects of farm planning and management.
and crop fertilization over time, while operations in Ecuador
and Indonesia experienced a slight decrease in performance. Addressing entrenched poverty and child labor
Implementation of practices related to integrated pest manage-
ment decreased in Ecuador and Ghana over time, and remained Cocoa-growing families frequently live in poverty, due in part
stable in all other countries. Recognizing the need to boost the to low cocoa yields and a lack of other income-generating
implementation rates of these practices, the 2017 SAN Stan- activities. The effects of poverty are exacerbated by a lack
of social services in many cocoa-growing regions. In addition,
child labor has historically been widespread on cocoa farms
in West Africa, limiting educational opportunities for children
Farmer Voices and often subjecting them to tasks that are dangerous or too
physically demanding. SAN Standard criteria 5.8, 5.9 and 5.19
According to Joshua Armah, a smallholder cocoa farmer put restrictions on the hours worked by youth aged 15 and
from Nkranfum who participated in a Rainforest Alliance 17, and prohibit child workers between the ages of 12 to 14
training program: except on family farms when special safety conditions are in
place and working does not interfere with school. In addition,
“I was able to double my production by implementing best criteria 5.15 and 5.16 require clean drinking water for farmers,
practices and achieved that without the application of fertil- workers and their families, and access to medical services.
izers. Now I want to continue increasing my yield and we are
discussing with exporters if our group can get an advance to Audit reports indicate all certified cocoa farms to be in com-
buy fertilizers. The changes I implemented on the farm are: pliance with criteria related to the employment of minors.
appropriate pruning to ensure sufficient sunlight to my trees, With very few exceptions, families on certified cocoa farms
weed management, eliminating diseased pods, sanitation had access to education for school-aged children and access
management of the farm. Most important is to maintain the to medical services for all workers and their families, with
farm healthy, as soon as I see a branch that needs pruning, compliance scores of 90 and 99, respectively, for all countries
I prune.” combined.
14Table 4. Average compliance score at most recent audit for criteria that address entrenched poverty and child labor. Compliance scores
range from 0 to 100; operations are awarded 0 points for non-compliance, 50 points for partial compliance, and 100 points for full
compliance. Compared with previous audit scores, indicates an increase of 25–45 points, indicates an increase of 11–24 points,
indicates a decrease of 11–24 points, indicates a decrease of 25–45 points. Changes of +/- 10 points are not indicated. The first
sample size presented is the number of certificates used to calculate the most recent score; the sample size in parenthesis is the number
of certificates included in the time series analysis. In the left column, criteria that were critical at the time of the audit are denoted by an
asterisk (*).
Côte
All regions d’Ivoire Ghana Ecuador Peru Indonesia
Sample size 186 (90) 124 (50) 28 (17) 16 (10) 7 (6) 11 (7)
5.8* No workers under 100 100 100 100 100 100
15 years old
5.9 Minors (12-14 99 99† 100 100 100 100
years old) may work
part-time on family
farms only under
special safety con-
ditions
5.15 Access to potable 84 77‡ 100 91 86 100
water
5.16 Access to medical 90 88 100 84 100 100
services
5.17 Access to education 99 100 100 94 100 100
5.19 Minors may partic- 100 100 100 100 100 100
ipate in harvesting
only under strict
conditions
Average for above criteria 95 93 100 95 98 100
†
Compliance score was 100 in 2016, after criterion 5.9 became a critical criterion.
‡
Compliance score was 100 in 2016, after criterion 5.15 became a critical criterion.
Most certified farms were found to be providing potable water
for farmers, workers and their families, but the operations in Farmer Voices
Peru and Ecuador that were not in compliance will need to
address this criterion by their next audit, as it became a critical A woman participating in a Rainforest Alliance training
criterion in the fall of 2015. program in the Nkranfum community of Ghana says:
Improving Safety and Minimizing Overuse of Agrochemicals “My yield in cocoa production has increased from about
three bags to about ten bags per acre since I started prac-
Smallholder farmers and workers can be exposed to toxic ticing what I was taught during the training sessions, and
chemicals if these substances are used improperly or without it keeps improving. Most women in the program can testify
protective equipment, stored in an unsafe manner or location, that thanks to this, our children are now happily in school.”
transferred home on workers’ clothing or skin, or if banned or
illegal agrochemicals are used. These and other issues relat-
ed to agrochemicals are addressed in the 20 SAN criteria that
focus on responsible and safe agrochemical use. Overall, the and prophylactic measures such as removal of diseased pods.
approach of the SAN Standard and associated farmer training However, to the extent that chemical pesticides are used, the
is to minimize the need for toxic agrochemicals on cocoa farms standard includes numerous measures to minimize the risk
by promoting integrated pest management, pest monitoring, that these substances pose to people and the environment. In
15Table 5. Average compliance score at most recent audit for criteria that address potential exposure to hazardous agrochemicals. Compli-
ance scores range from 0 to 100; operations are awarded 0 points for non-compliance, 50 points for partial compliance, and 100 points
for full compliance. Compared with previous audit scores, indicates an increase of 25–45 points, indicates an increase of 11–24
points, indicates a decrease of 11–24 points, indicates a decrease of 25–45 points. Changes of +/- 10 points are not indicated.
The first sample size presented is the number of certificates used to calculate the most recent score; the sample size in parenthesis is
the number of certificates included in the time series analysis. In the left column, criteria that were critical at the time of the audit are
denoted by an asterisk (*).
Côte
All regions d’Ivoire Ghana Ecuador Peru Indonesia
Sample size 186 (90) 124 (50) 28 (17) 16 (10) 7 (6) 11 (7)
6.3 Agrochemical use 92 92 95 88 93 95
training
6.10 Safe agrochemical 84 90 68 84 100 59
storage
6.11 Location of agro- 88 89 77 91 100 95
chemical and fuel
storage areas
6.13* Use of personal pro- 100 100 100 100 100 100
tective equipment
6.17 Safe handling of 96 97 100 88 100 86
clothing after agro-
chemical work
8.2 Inventory and 74 77 61 84 93 50
reduction of agro-
chemical use
8.4* Ban on illegal 100 100 100 100 100 100
substances and
agrochemicals
8.5 Eliminating use of 97 98 88 97 93 100
WHO pesticides
Average for above criteria 91 93 86 92 97 86
this analysis, we look in depth at the eight SAN criteria that rochemical safety practices may be attributable, at least in part,
most directly address the risks of agrochemical use to human to the upgrading of criterion 6.3 (training on safe agrochemical
health and safety on cocoa farms (Table 5). use) to a critical criterion in 2015, resulting in more emphasis
on this topic during farmer training provided by group admin-
Certified cocoa farms achieved full compliance with the crit- istrators. Nevertheless, there remains some room for improve-
ical criteria related to use of personal protective equipment ment in pesticide safety: for instance, criterion 8.2—which
(PPE) and the prohibition of illegal substances and agrochem- requires a farm agrochemical inventory, and agrochemical ro-
icals. Performance related to other agrochemical safety crite- tation and reduction—registered an average compliance score
ria varied considerably by country and topic area. Over time, of 74 across the five focal countries.
there was substantial improvement in several agrochemical
safety areas, such as safe fuel and agrochemical storage, as Trends, Successes, and Challenges per Region
well as training on topics such as the interpretation of agro-
chemical labels, emergency procedures, and the use of pro- Despite some commonalities in cocoa production systems
tective gear. Particularly strong improvements were observed across the tropics, cocoa farmers and farming communities
in West Africa and Indonesia, as discussed further in the next in each region face unique opportunities and challenges. In
section on regional trends in compliance. Improvements in ag- this section, we analyze audit data to report the most salient
16You can also read