Grow South Island 05 06 16 - Autumn 2020 - Ballance Agri-Nutrients
←
→
Page content transcription
If your browser does not render page correctly, please read the page content below
Grow     South Island
       Autumn 2020

             05
            Fertigation
             potential

             06
           Regenerative
          farming for NZ?

              16
           Post drought
             recovery
03                                   10
Contents
                      Detainment for good                  Spread more accurately

                      04                                   12
                      Retain or replace?                   S products: side-by-side

                      05
                      Fertigation’s potential
                                                                                              18
                      06                                                                      A vehicle for action

                      A regenerative future?
                                                                                              19
                      08                                                                      MitAgator at work

                                                           13
                      N for pre-tupping feed

                                                           Grazing winter crops
                                                                                              20
                                                                                              Mo gets its mojo back

                                                           14                                 21
                                                           Valuable but variable              Clippings

                                                           16                                 23
                                                           Recovering from drought            Science-based submission

                      09                                   17
                      Fodder beet findings                 Sustainability snaphot

                      Ballance Agri-Nutrients is one of    Since its inception in the         SealesWinslow is a recognised
                      New Zealand’s leading fertiliser     1980s, Super Air has evolved       leader in the production of
                      manufacturers. A 100 percent         into one of New Zealand’s          high-performance compound
                      farmer-owned co-operative,           leading agricultural aviation      feeds and feed additives.
                      the company has over 19,000          companies. In addition to aerial   A fully owned subsidiary of
                      shareholders and sells around        fertiliser application, Super      Ballance, SealesWinslow has
                      1.7 million tonnes of product        Air has developed a world-         manufacturing sites located
                      each year, representing a            class reputation for aircraft      in Morrinsville, Ashburton
                      turnover close to $900 million.      engineering and innovation.        and Wanganui, and supplies
                      Its products include imported        Wholly owned by Ballance,          custom-blended pelletised
                      and locally manufactured             Super Air services most of the     feed to farmers throughout
                      fertilisers, the majority of which   North Island.                      New Zealand. It also provides
                      attract a rebate for shareholders.                                      molasses feed blocks, feed
                                                                                              supplements and additives.
                      ballance.co.nz                       superair.co.nz                     sealeswinslow.co.nz
                      0800 222 090                         0800 787 372                       0800 287 325

  02 /   ballance.co.nz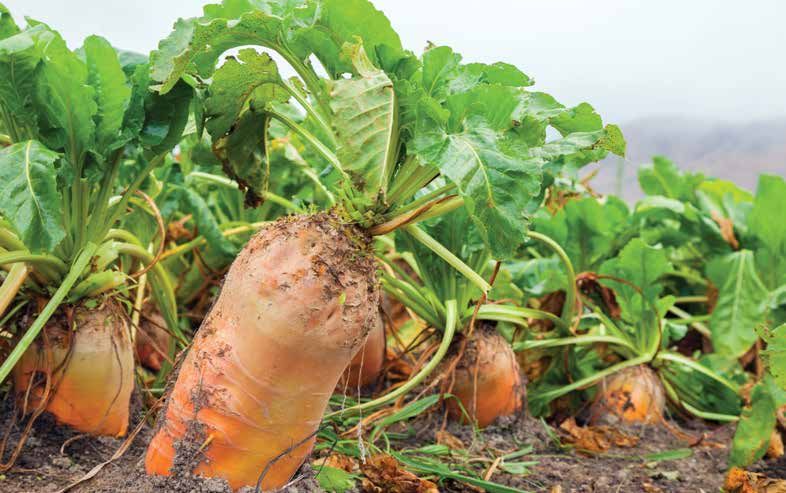
Animal   Effluent   Plant    Soil

Detainment for good
Detainment bunds can help                    events were responsible for most              In addition, by capturing and slowing
farmers in their quest for                   runoff water, and thus sediment and           down the force of storm water, bunds
                                             phosphorus losses.                            can help to moderate floods and protect
environmental sustainability and                                                           communities, and reduce stream bank
improved water quality.                      Multiple benefits                             erosion and damage to infrastructure
                                             Detainment bunds are most effective           such as fences, tracks and lanes.
Final results from three years of trials
show detainments bunds’ success at           for smaller flows from catchments less        “Achieving the full potential of
intercepting and treating storm water        than 50 ha in size, where they have the       detainment bunds depends on the
before it leaves the farm.                   potential to provide multiple benefits        willingness of farmers, as they own the
                                             beyond phosphorus and sediment                land that’s suitable for them,” says John.
The recently completed three year            capture. The project also recorded
Phosphorus Mitigation Project has a          nitrogen capture and further trials           The project was funded by the Ministry
governance group made up entirely of         will focus on validating the capture          of Primary Industries Sustainable
farmers, who arranged a collaboration of     of E. coli and nitrogen. Recharging of        Farming Fund, and eight co-funders
nine industry co-funders to support this     groundwater aquifers via soil infiltration    including regional councils, industry and
comprehensive applied science work.          from the ponding areas is another co-         Ballance Agri-Nutrients.
                                             benefit of detainment bunds.
Rotorua deer farmer and Bay of Plenty
Regional Council sustainable farming
advisor John Paterson, who kickstarted
and managed the project says: “With          Detainment bunds, low earth embankments across valley floors where
an increasing spotlight on farmers and       storm water flows, temporarily detain stormwater runoff in a large ponding
the impact farming has on waterways,         area for up to three days, during which time its volume decreases due to
this is a project developed and led by       infiltration into the soil. The suspended sediment particles, and attached
farmers.”                                    phosphorus, cannot infiltrate and settle out before the water is released.

Exciting results
Interim results (as reported in Grow
Spring 2019) showed an average load
reduction of 50 to 60 per cent, but the
latest results are even higher, indicating
detainment bunds capture around 60
per cent of the annual phosphorus load       1. Stormwater runoff arrival and ponding
and 80 per cent of the annual suspended
sediment load of storm water, depending
on soil drainage conditions.
The project has demonstrated that
well planned and built detainments
bunds have a high success rate and           2. Pond full and overtopping riser
their installation does not compromise
pastoral productivity. Their size needs
to be matched to the catchment size,
so they can store at least 120 m³ of
storm water per hectare of contributing
catchment. Over 20 detainment bunds
have been built in recent years and          3. Settling and infiltration (up to three days)
the host farmers agree that storm
water should only be stored for up
to three days, so that pasture growth
in the ponding area is not unduly
compromised. Often the ponded
water has largely soaked away before
the three day limit is reached. This is      4. Release of residual pond
important because often the prime
places for creating the bunds and their
large ponding areas are on some of the
best pasture areas of the farm.
An interesting finding of the project
was that a small number of large storm       5. Return to production

                                                                                                               Grow South Island / 03
Animal     Effluent     Plant   Soil

Retain or replace?
Crop residues can be a useful                        retained and returned to the soil as ash.       sufficient nitrogen (and phosphorus) to
                                                                                                     support early crop development.
resource for returning plant                         “Residues left to decompose will slowly
nutrients and building organic                       release nutrients and help retain organic       “Nutrients are released at varying rates
matter into the soil.                                matter. The rate of decomposition and           as residues decompose. Potassium’s
                                                     release depends on the residue type,            generally released pretty quickly; after
Crop residue management determines                   size, if and how it’s incorporated back         five weeks about 50 to 90 per cent of
whether the nutrients they contain are               into the soil, and the nutrient itself,” says   the potassium content will be released.
returned to the soil or removed and                  Aimee.                                          Nitrogen, phosphorus and sulphur are
replaced via fertiliser.                                                                             released more slowly.”

Grain crop residues contain varying                                                                  FAR research has concluded different
                                                     “Barley straw decomposes faster
amounts of plant nutrients such as                                                                   residue management systems are
                                                     than oat straw, which is faster                 unlikely to result in major differences
nitrogen, phosphorus, potassium,
sulphur and magnesium (see Table 1).                 than wheat straw. Smaller pieces                to total soil organic matter, but recent
                                                     of residue decompose faster                     research suggests removing crop
Weighing up options                                  than larger pieces. Using discs                 residues limits earthworm abundance
                                                     instead of ploughing to incorporate             and biomass.
“The options for managing crop
                                                     residues back into the soil mixes
residues – removing, burning, leaving                                                                “Whichever option you choose,
                                                     them more thoroughly into the soil,
them or incorporating them back into                                                                 consider the nutrient removal or
the soil – all have their own pros and               so they break down faster.”
                                                                                                     retention when selecting the fertiliser
cons,” says Ballance Science Extension                                                               for your next crop,” says Aimee.
Officer Aimee Dawson.
                                                     Residues can also be left on the surface
“Residue that’s baled and removed has                and the next crop direct drilled into
an economic value, but almost all of                 them.
the nutrient content is lost. So it’s wise
                                                     Both incorporated and surface-
to compare the value of the straw to
                                                     retained crop residues have
the cost of replacing the nutrients via
                                                     a high carbon to nitrogen
fertiliser.” The economic cost of straw
                                                     ratio, which can affect the
nutrient losses can be calculated using
                                                     availability of soil nitrogen.
the Foundation for Arable Research
                                                     As the soil organisms
(FAR) spreadsheet at www.far.org.nz/
                                                     decompose residues
articles/247/economic-cost-nutrient-
                                                     they take nitrogen from
losses.
                                                     the soil. Using fertiliser
When residue is burnt most of the                    containing nitrogen to
nitrogen and sulphur content is                      support decomposition
lost as gas, but about 80 per cent                   is not always reliable,
of the potassium, 60 per cent of                     but drilling nitrogen
the phosphorus and most of the                       fertiliser, such as DAP,
magnesium and calcium content are                    with seed provides

Table 1 Nutrient content of crop residues

                                              Approximate content (kg per tonne of residue)
                                                        Wheat straw             Barley straw           Oat straw          Ryegrass straw
Nitrogen                                                      5.9                     4.6                  5.3                    10.1

Phosphorus                                                    0.7                     0.4                  0.5                    1.0

Potassium                                                    12.8                     12.9                 21.2                   13.8

Sulphur                                                       1.2                     1.3                  1.0                    1.4

Magnesium                                                     0.7                     0.7                  0.4                    1.2

Source: FAR Arable Extra, Issue 103, December 2013

04 /   ballance.co.nz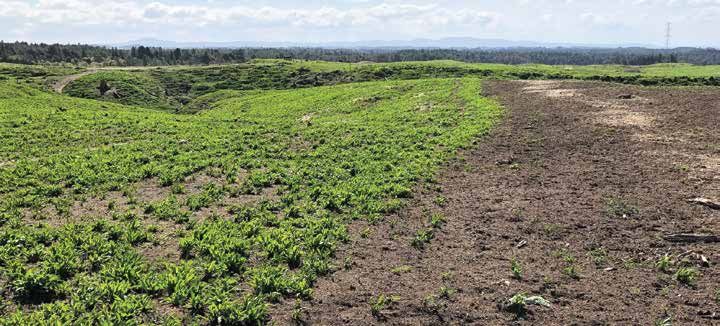
Animal     Effluent    Plant      Soil
     The Fertigation project
     group at Pāmu’s Waimakariri Dairy Unit.

      PHOTO: Irrigation NZ

Fertigation’s
potential
A new project is investigating                 granular fertiliser application, especially   The project began with small plot trials
fertigation’s potential for                    at low application rates. Even with the       at Lincoln University as well as on-
                                               best spreading applicator technology          farm monitoring at Pāmu’s Waimakariri
irrigated pastoral farms.                      and compound fertiliser granules              Dairy Unit. Pāmu Farm Innovation
Fertigation, essentially applying fertiliser   containing consistent amounts of              Specialist Tim Lissaman says: “Pāmu
together with irrigation water, could offer    nutrients, conditions during spreading,       is striving to farm more efficiently with
huge benefits for growing pasture, such        and granule size, weight and shape            lower environmental impact. After
as reducing nitrogen (N) application           can still severely impact distribution        very positive results in the first year of
and loss, increasing N utilisation and         uniformity (see page 10).                     fertigation at Waimakariri Dairy, we are
improving clover content and pasture                                                         keen to quantify fertigation benefits
                                               The project is investigating some of the      through the project trials. We hope the
quality.                                       other benefits fertigation could offer        trial will inform further investment in
Since the 1970s fertigation has been           over conventional methods of solid            infrastructure at more of our farms and
used around the world, mainly in arable        N fertiliser application. By reducing N       also help with learnings for the wider
and horticultural cropping systems             applications, fertigation may benefit         farming community.”
in countries such as Australia and             the pasture clover content. When
America. Here in New Zealand, where            N applications are reduced, clovers           Ballance Agri-Nutrients is
it has mostly been used for horticulture       face less competition and shading             collaborating with Irrigation NZ,
and viticulture, and in few large scale        from ryegrass plants, which can               the Ministry for Primary Industries,
irrigated pastoral or cropping farming         lead to increased clover populations.         Pāmu Farms of New Zealand and
operations, its impact on pastoral             In turn, more clover fixes more N,            others on the project.
farming is not yet known.                      enabling further reduction of N inputs
                                               over time. However clover will still
To fill this information gap, the              suffer if nutrients such as potassium,
Sustainable Farming Fund Fertigation           phosphorus and sulphur are deficient,
project started in 2019 to look at N           as they typically need higher levels of
application through fertigation and its        these nutrients than ryegrass does, so
potential to help New Zealand pastoral         not all nutrients inputs can be reduced.
farmers reduce their environmental
footprint while maintaining farm               Fertigation could allow farmers to
viability and sustainability. Ballance Key     apply N at the optimum time, when
Accounts Nutrient Specialist for the           most needed by the pasture and when
upper South Island Raymond Williams            environmental risks are lowest. It allows
is on the project team and says: “It's an      smaller amounts of N to be applied
exciting project, given the knowledge          more often, which may help to reduce
gap in using fertigation on pastoral           losses and environmental impacts and,
farming in New Zealand, and in fact            by matching N application to demand,
globally.”                                     improve the effectiveness to the pasture      This pivot irrigates and provides fertiliser
                                               and profitability. This has significant       for pasture through a fertigation system.
It is already known that fertigation           implications for ‘shoulder’ season N
can distribute N more uniformly than           management.                                   PHOTO: Irrigation NZ

                                                                                                                    Grow South Island / 05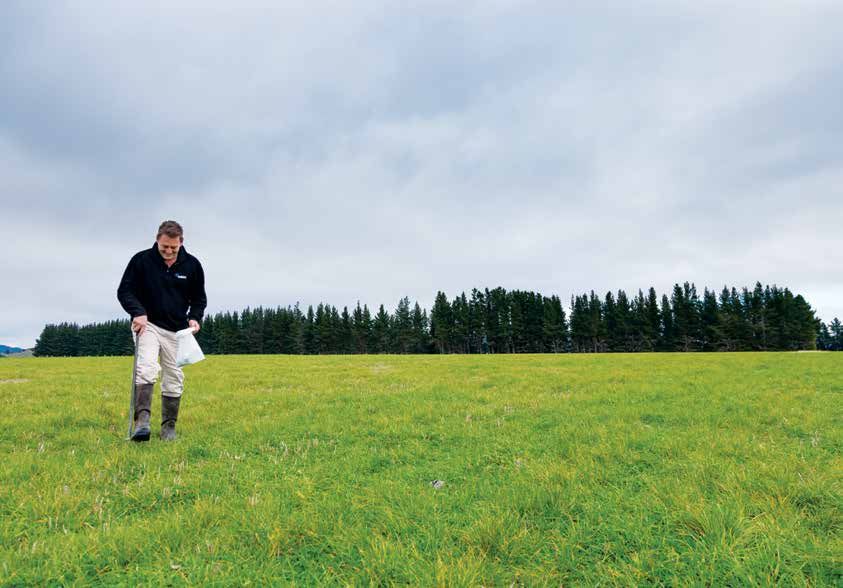
Animal    Effluent      Plant   Soil

                        A regenerative future?
                                       Is regenerative agriculture the answer to
                                              the issues facing farmers?

Is regenerative agriculture a                                                                   fertiliser, clover, or manures and compost
silver bullet that can improve                                                                  – increases plant growth and production
soil health and biodiversity, and                                                               of dry matter, in turn resulting in more
mitigate climate change, while                                                                  soil organic matter.
still maintaining on-farm profits?
                                                                                                Where chemical fertilisers do differ to
As a science-based                                                                              biological fertilisers is their superior
organisation, Ballance Agri-                                                                    cost-effectiveness and practicality.
Nutrients is interested in what                                                                 Relying solely on compost and manure
regenerative agriculture can                                                                    for nutrients poses an array of major
offer New Zealand farmers. Are                                                                  logistical challenges, such as the
                                                                                                massive increase in stock and land use
its practices scientifically robust
                                                                                                that would be needed to produce the
and relevant to New Zealand,
                                                                                                required amount of manure.
and do they differ to ‘business as
usual’?                                                                                         New Zealand pastoral farmers already
                                               Goal 1: Improve soil health                      aim to maximise clover and its fixation
Originating in the USA                                                                          of nitrogen, and to some degree, already
and Australia, regenerative                    Regenerative farming aims to improve             use compost (plant residues) and
agriculture is still in its infancy,           soil health by using compost and                 manure (dung and urine) to improve soil
so has no clear, universal                     manures and reducing chemical                    health. Crop residues (see page 4), for
definition. It is best broadly                 fertiliser use.                                  example, are recognised as having an
understood by its goals, which                                                                  economic value for the nutrients they
                                               This infers chemical fertilisers are bad         can provide.
we look at in more detail, asking              for soil health, which is not backed by
how they relate to our context                 scientific research. Chemical fertilisers        Regenerative agriculture reinforces
and what opportunities they                    are just as effective as biological fertiliser   what we already know – soil health
may present.                                   at improving soil health, biological             is important, so we need to continue
                                               activity and organic matter. Research            investigating realistic and practical
                                               shows that nitrogen – whether from               means of maintaining or improving it.

06 /   ballance.co.nz
Animal   Effluent   Plant    Soil

Goal 2: Sequester carbon                    Goal 3: Grow topsoil                        Goal 4: Improve biodiversity
Regenerative farming aims to mitigate       Regenerative agriculture aims to grow       One way regenerative agriculture
climate change by sequestering carbon       topsoil by minimising soil disturbance      aims to improve biodiversity is by
into the soil as organic matter.            and keeping the soil covered using          reducing nitrogen fertiliser use (by
                                            practices such as no-till or minimum        100 kg/ha), which it claims can result
This approach is not currently backed       tillage, cover crops and rotational         in a sixteenfold increase in varieties
by robust science and further research      grazing. Ballance aims to create ‘the       found in pasture, while still maintaining
is needed to prove it can work in New       best soil on earth’, and encourages         productivity.
Zealand. Evidence of regenerative           the same practices employed by
agricultural practices increasing soil                                                  The scientific research behind this
                                            regenerative agriculture.                   claim involved natural grassland with
organic carbon (SOC) comes largely
from the USA and outback Australia,         Ballance leads and/or supports a range      predominantly tropical grasses, very
both with very different farming systems    of projects that are investigating soil     different to New Zealand pastures.
to ours, and typically with low soil        conservation practices. These include       The research also did not suggest that
fertility and biological activity.          the Sustainable Farming Fund projects       production could be maintained by
                                            Helicropping – protecting our soils (see    reducing nitrogen fertiliser application,
As our SOC levels are already relatively    Grow Spring 2019), which is finding the     but instead that doing so over a 25
high, the same effect is not as readily     best tools to protect soil when cropping,   year period might result in a balance
seen here, despite pastoral farmers         and Catch crops to reduce N leaching        between biodiversity and productivity.
already using some of the regenerative      (see Grow Autumn 2019), a practice
agriculture practices promoted for                                                      At a soil level in New Zealand, growing
                                            which also stabilizes soil.                 as much dry matter as possible feeds
achieving this goal, such as keeping
ground in long term pasture, rotational     In New Zealand, rotational grazing is       the worm and microbial population.
grazing and cover crops.                    already practised, and our soils are        Through their efforts to improve water
                                            relatively young, so soil organic matter    quality or to sequester carbon, many
Research in 1997 reported no net            levels are already very high. For us,       farmers have been providing habitat
change in SOC, but more recent              growing pasture (perennial ryegrass         and improving biodiversity by planting
research has reported declines in SOC.      and clover) using conventional farming      productive and unproductive areas, and
The jury’s still out as to why SOC levels   methods is the most soil regenerative       restoring or creating wetlands.
may be declining in New Zealand, with       practice we can do.
further research currently underway. In                                                 Not encroaching on existing habitat
the meantime, there is an opportunity       As a company and country, we should         by more efficient use of agricultural
for further research, with the New          continue to explore and adopt practical     land already in production is vital for
Zealand Pastoral Greenhouse Gas             soil conservation practices.                maintaining land with high biodiversity
Consortium saying: “Despite a wealth                                                    value.
of theories and ongoing research, there                                                 Biodiversity varies across New Zealand,
are not yet any robust general rules        "Regenerative agriculture                   and is best addressed at a farm specific
about how to reliably and sustainably                                                   level. A reduction in applied nitrogen
                                            reinforces what we already know –
increase soil carbon in New Zealand                                                     is unlikely to result in biodiversity
                                            soil health is important, so we need
pasture soils.”                                                                         gains. Instead, farmers should continue
                                            to continue investigating realistic
                                            and practical means of maintaining          to work with councils and industry
                                                                                        groups to identify the most effective
                                            or improving it."
                                                                                        and practical solutions to enhance
                                                                                        biodiversity for their properties.

                                                                                                            Grow South Island / 07
Animal    Effluent      Plant   Soil

N for pre-tupping feed
Tactical nitrogen (N) use to                content and low total N levels. In most        N should be applied to hill country at no
provide feed before tupping can             summer-dry hill country conditions,            more than a moderate rate – no more
                                            a minimum response of 15 kg DM                 than 50 kg N/ha in a single application
have a big impact on returns.               per kg N applied can be expected. If           – and sensitive areas such as streams
Good body condition for ewes before         conditions, primarily soil temperature         should be avoided. Timing of N should
mating in autumn is important, and          and moisture, are right greater                allow enough time to generate a
with a little help, pasture is the most     responses are highly likely, reducing the      valuable response before grazing off the
cost-effective way to provide the feed      cost of feed grown significantly. Factors      pasture. “About six weeks is ideal and a
required.                                   such as aspect and altitude can also           good rule of thumb, but four weeks can
                                            influence the level of response.               suffice,” says Josh.
“The critical feeding period for
increasing ewes to body condition
score (BCS) 3-4 is typically when               Choosing the right N                          My Pasture Planner
pasture cover is likely to be limited and
                                                fertiliser for the job                        This decision support software
after a long, dry summer, its content
                                                Factors to consider include                   tool uses soil total N test
high in fibre and low in energy,” says
                                                other nutrients required such                 information to improve N use
Ballance Science Extension Officer
                                                as sulphur (as provided by                    efficiency on pastoral farms. It
Josh Verhoek.
                                                PhaSedN) or phosphorus, as                    can help improve feed budgeting
“But this can be overcome by using              well as the need to reduce                    and economical use of N fertiliser
nitrogen tactically from late summer            volatilisation, using a product               as a low cost supplementary
to early autumn to boost pasture. It’s          such as SustaiN.                              feed. See ballance.co.nz/My-
the cheapest way to provide good feed                                                         Pasture-Planner
leading up to tupping, and can have a
big impact on lambing returns.”

Better body condition benefits
Increasing ewes’ body condition for         Table 1 Benefits of increasing body condition pre-tupping to BCS 3
mating has a number of significant
benefits, including increased                                                                  Increase
                                                                           Do nothing                            Gross margin
conception rates, higher birth weights,                                                       condition
                                                                          (15% ewes ≤                             difference
increased chance of multiples, and                                                           (5% ewes ≤
                                                                            BCS 2.5)*                               ($/ha)
increased lamb survival.                                                                       BCS 2.5)

If ewes are on good leafy feed and          Scanning %                         160%              171%                 + $42
gaining weight as the rams go out
there will be an additional benefit of      Lamb survival                      78.2%             80%                  + $36
possibly 5-10 per cent in lamb drop.
Ideally ewes should be rotated rapidly,     Weaning weight                    26.5 kg           27.5 kg               + $50
going on to about 5-6 cm of pasture
(2200 kg DM/ha) and not grazing             Gross margin $/ha                  $770              $898                 + $128
below 3 cm (1500 kg DM/ha).
                                            * Typical percentage of ewes below ≤BCS 2.5.
“All of the benefits from improving
                                            Source: Trevor Cook, 2017
body condition lead to more lambs,
and if well fed, heavier weights,” says
Josh. “Heavier lambs at birth are more
likely to reach prime weights quicker,
so there’s more chance they’ll be
sold before Christmas when meat
schedules are typically higher. Lambs
sold before the period leading into
and during mating also help reduce
competition ewes face for feed.”

Using N to improve body
condition
Hill country is very responsive to N
applications, as it has less clover

08 /   ballance.co.nz
Animal   Effluent   Plant         Soil

Fodder
beet findings
Farmers can benefit from                    optimise yields, but no notable increase     The trial highlighted the value of soil
results of local research into              in yield from a third application was        tests such as Ballance’s fodder beet
                                            apparent. Response to N fertiliser           profile test. Taken before sowing to a
fodder beet.                                depended on the level of available N         depth of 150 mm, the test identifies
A recently completed three-year             in the soil, demonstrating the benefit       available N, K and B, as well as
Sustainable Farming Fund project, led       of soil testing to avoid unnecessary N       phosphorus, pH, sulphur, sodium and
by Plant & Food Research and involving      applications and expenditure.                magnesium levels (see Table 1 for target
Ballance Agri-Nutrients, has shed light                                                  levels). Testing well before the crop is
on the role of fertiliser management and    Fodder beet took up large amounts of         sown can give you time to adjust soil
crop establishment in optimising fodder     K, depending on the soil K level and         test levels, especially soil pH.
beet yields.                                the amount applied. Across the trial
                                            sites K application rate and timing did      If nutrient deficiencies are suspected
The impacts of different rates and          not affect yields, even at low K soil test   once the crop has established, a
timings of nitrogen (N), potassium (K)      levels (as low as QTK of 3), suggesting      herbage test at canopy closure will
and boron (B) applications were trialled    fodder beet response to added K is           confirm if further nutrient addition is
at sites (including dairying, arable        minimal. However, as it is important to      required.
cropping and sheep and beef, in both        consider fodder beet in the full crop/
irrigated and rain-fed conditions) across   pasture rotation, soil testing is still
five key fodder beet production regions.    suggested. If QTK is less than 3, adding
According to results, as fodder beet is a   up to 100 kg K/ha is sufficient to supply     Test                       Target level
luxury feeder of N, N should be applied     K for the fodder beet and subsequent
prudently. While crop N uptake and          crops/pasture. If QTK is 3-5, 50 kg K/ha      pH                            6.0-6.2
N concentration increased as result of      is sufficient and for QTK greater than 5,
                                            K can be withheld as its addition will not    Phosphorus (Olsen P)           ≥15
increased N application rates, yield did
not consistently increase. In year 1 of     affect yield.
                                                                                          Potassium (QTK)                    ≥3
the study, yield response to N fertiliser   The essential micronutrient B did
varied across sites, with responses from    not affect yield in the trial, however B      Sulphur (sulphate S) Not determined
100 to 200 kg/ha of added N. Three          soil test levels across the sites were        Magnesium (QTMg)                   ≥8
sites had no response to added N.           not in deficiency ranges. Due to its
Similar results were observed in year 2,    importance for crop health, B should          Sodium (QTNa)                      ≥4
with peak N response up to 100 kg/ha        still be supplied adequately at sowing,
of added N.                                 as deficiencies can result in brown heart     Boron (mg/kg)                      1.1
On average adding up to 100 kg N/ha         rot. Unlike other nutrient deficiencies, B
                                            deficiency cannot be remediated after        Table 1 Target soil test results for
optimised yield. Applying N at sowing
                                            the crop has established.                    growing fodder beet
and again at canopy closure assists to

                                                                                                             Grow South Island / 09
Animal     Effluent     Plant   Soil

                Spread more accurately
               Accurate spreading is vital for getting the best returns from fertiliser.

“Fertiliser can be a significant            In New Zealand, most fertilisers range       performance once applied.
investment for farmers, and if you’ve       from SGN 95-475 (a higher value
invested in a quality product you want      indicating a larger mean particle size)      Products with a similar SGN and UI (a
to make sure you use it well,” says         and UI 5-68 (a higher value indicating a     difference of less than 20) blend and
Ballance Nutrient Dynamics Specialist       more uniform range of particle sizes).       spread better (see Table 1). “Blends
Jim Risk.                                                                                will segregate, resulting in uneven
                                            Heavier, larger granules (with a higher      spreading, if a low SGN product is
“Fertilisers such as Superten and           SGN) will throw further than lighter,        mixed with a high SGN one, as smaller
SustaiN supply plant nutrients in a         smaller granules. Spread width also          particles fall to bottom of spreader.
very concentrated form, so to be most       depends on spreader equipment and            Segregation and uneven spreading also
effective they must be spread evenly.       how it is calibrated to the product being    occurs when a low UI product is mixed
Uneven spreading can result in striping     spread. “Ideally spreaders should be         with a high UI product, as the small,
in crops and pasture, reduced yields        calibrated for specific products, so         medium and large particles separate
and variation in soil fertility.”           using the information on the fertiliser’s    out,” says Jim.
                                            physical characteristics ensures the
Spreading accuracy depends on               spreader is set up correctly for different
product quality, physical and chemical      products,” says Jim.
compatibility (if blending), and spreader
calibration.                                The UI of the products being spread             Difference
                                                                                                               Physical
                                            also impact the quality of the spread         between SGN
                                                                                                             compatibility
Product quality                             achieved. When a high proportion of the        or UI values
The product quality of a fertiliser         granules are within a narrow particle
                                                                                             Under 20          Compatible
impacts how far it can be thrown            size range (have a higher UI) the spread
(known as spread width or bout width).      will be more consistent than if the                                Moderately
Product quality refers to a fertiliser’s:   particle size varies largely.                      20-40        compatible (some
                                                                                                            segregation likely)
• mean particle size (represented by        Physical compatibility
  the size guide number - SGN)                                                                Over 40         Incompatible
                                            If blending two fertiliser products,
• range of particle sizes (represented      their compatibility affects their flow
  by the uniformity index - UI)             through a spreader, impacting the            Table 1 The effect of SGN and UI on
• bulk density (BD).                        quality of the spreading and their           physical compatibility

10 /   ballance.co.nz
Animal Effluent Plant Soil
Chemical compatibility settings and ability to throw products to can optimise spread widths, resulting
Mixing chemically incompatible specific spread widths,” says Jim. in more even application and fewer
fertilisers is most likely to pose a health passes. Spread testing can demonstrate
Spread testing determines the CV at product quality, but it is ultimately the
and safety risk, but it can also impact certain spread widths. For nitrogen the
spreading. spreader calibration and settings that
maximum CV is 15 per cent, whereas determine maximum spread width,”
A product’s tendency to attract for phosphorus it is 25 per cent. When says Jim.
moisture, which is usually associated looking at spread testing graphs you
with nitrogen-based fertilisers, is the determine the maximum spread width
most common chemical compatibility for that product from that spreader by
issue that can impact spreading. looking at where the line intercepts FOR MORE INFORMATION
the CV.
“For example, avoid blending nitrogen For more information on Ballance
products with superphosphate-based “Spread testing has shown that by products and their compatibility,
fertilisers, as the mix can turn into using uniform products (well granulated contact the Ballance Customer
a wet sludge,” says Jim. If used, the with even particle size), spreaders Service team on 0800 222 090.
sludge clogs spinners in groundspread
machines, and in top-dressing
planes can get stuck in the hoppers
and prevent the fertiliser from being Truck travels in circles Truck travels back and forth Good
discharged, as well as creating a health
and safety risk. Even if a blend is only 50
CV at 15%
slightly affected by moisture issues, 45 intercepts the
uneven spreading and striping can still 40 line at a bout
Coefficient of variation %
occur. 35 width of 8 m. For nitrogen, the
maximum CV is 15%,
Moisture from rain or humidity causes 30 so for a desired spread
fertiliser to deteriorate and storing 25 width of 20 m, a CV
over 15% means the
fertiliser products in cool dry conditions 20 actual application rate
minimises the chance of any product 15 has varied from the
degradation. 10 set application rate by
more than 15%.
5
Spreader calibration and
0
testing 5 6 7 8 9 10 11 12 13 14 15 16 17 18 19 20 21 22 23 24 25 26 27 28 29
Like any machinery, regularly
Bout width (m)
maintaining, calibrating and testing a
spreader are important for ensuring its
Figure 1 Example spread testing graph, showing a poor spread pattern. On this
accuracy.
spreader with the current settings a nitrogen product (CV 15%) will spread to 8 m.
On a well-calibrated spreader, the disc
speed and drop point of the fertiliser
onto the disc is right for the product or
mix being spread (generally based on
Truck travels in circles Truck travels back and forth Good
its bulk density), and the actual and set
application rates are similar. 50 CV at 15%
The coefficient of variation (CV) refers to 45 intercepts the
how much the actual distribution of the 40 line at a bout
Coefficient of variation %
fertiliser varies from the desired spread width of
35
23 m.
rate, as set on the spreader. A lower 30
CV means a more even spread. “CV 25
properties depend on the spreader’s
20
design; a poorly designed spreader can
only operate effectively at lower spread 15
widths. Testing a spreader with different 10
fertiliser types determines the best 5
spread width.” 0
5 6 7 8 9 10 11 12 13 14 15 16 17 18 19 20 21 22 23 24 25 26 27 28 29
Spread testing helps to calibrate a
spreader and ensure the settings are Bout width (m)
correct for a particular product or mix,
and can also help determine how Figure 2 Example of a spread testing graph showing a good spread pattern.
far a product or mix can be thrown. On this spreader with the current settings a nitrogen product (CV 15%) will
“Spreaders usually have their own spread to 23 m.
Grow South Island / 11Animal Effluent Plant Soil
S products: side-by-side
What’s the difference between sulphur products, and what are their best uses?
“PhaSedN, PhaSedN Quick Start and Nrich SOA are related fertiliser products, all with sulphur (S)
and nitrogen (N), but they’re best used at slightly different times of the year for different purposes,”
says Ballance Science Extension Officer Josh Verhoek.
The key difference in these products is the S they contain – sulphate S (plant available and can leach),
elemental S (not available to plants and does not leach), or both. We look at them in more detail below to
better understand them.
What’s in it N (SustaiN), S, calcium (small amount, as lime) N, S
S content 28.5% 17% 22%
(and type) (100% elemental S) (32% sulphate S, 68% elemental S) (100% sulphate S)
N content 25.3% 31.3% 19.5%
(and type) (100% urea) (85% urea, 15% ammonium) (100% ammonium)
autumn (March to May) and late autumn to end of winter (May spring (August to November)
When best
early winter in areas with milder to August) to cover winter and early to cover high S demand and
used
conditions spring S and N needs* typically low supply from soil
What it does N gives pasture an immediate boost Sulphate S and N give pasture an immediate boost
Fine elemental S particles sit in the soil over winter and are
increasingly converted to sulphate S as soil temperatures rise, -
supporting early spring growth
SustaiN helps minimise N volatilisation losses -
Best for • low S soils • strategic N application to
• high rainfall areas at risk of S leaching over winter pastures in early spring
• areas high in phosphate but low in S and N • where soil S supply is low
enough to limit pasture
• effluent blocks requiring tactical S and N response to N applications
Dairy farm • where phosphate isn’t needed, but S availability needs to be increased/ • in place of straight N
uses maintained products in late winter/
• on effluent blocks with a tactical requirement for S and N, but no need for early spring when pasture
potassium demand is high,
• on effluent blocks that
haven’t had effluent since
autumn
Sheep and • on hill country where cost of applying phosphate is uneconomic, but • on hill country as a pre-
beef farm applying S and N (which are constraining pasture production) is economic lamb N application, swap
uses • on hill country with low organic S levels (< 8) and with soils with low- straight N for N and S for
medium anion storage capacity (ASC < 60) further growth in spring
• include with/instead of
(if budget constraints)
phosphate application
on finishing areas on fertile sheep and beef farms to boost pasture
-
growth, helping to provide sufficient quality feed to rapidly finish stock
*assuming suitable conditions (mild, no heavy rainfall, not waterlogged, actively growing pasture)
12 / ballance.co.nzAnimal Effluent Plant Soil
Grazing winter crops
Simple strategies could better “No-tillage techniques have been growing more feed than planned,
protect the soil during winter successfully used to grow crops without disturbing soil structure and
for nearly 40 years, so if you’re still growing (for example) plantain as a
forage crop grazing. cultivating, maybe it’s time to change. companion crop, not only means
Winter forage crops are essential to get No-till drills handle the soil as it is; it’s there’ll be enough to meet the moving
grazing animals through the winter, and only the more primitive drills that require target, it may also help to minimise soil
allocating stored feed is important to tillage to create a seed bed. damage.”
ensure maintenance or growth targets “Leaving the soil structure intact is the
are achieved. But managing stock Block grazing vs strip grazing
first line of defence to protect the soil,
grazing on these crops involves juggling the next being having a low growing “A number of farmers I’ve been
the need to optimise crop utilisation plant and roots (such as plantain) in the working with, being pushed for time,
while keeping animals well fed and swede or fodder beet crop, to provide have moved away from strip grazing
looking after the soil. greater resistance to pugging.” to block grazing. Recognising that the
efficiency of utilisation will decline,
“A lot of information’s already available they deliberately grow more crop than
on planning and managing grazing Grow more
essential, and are prepared to have
stock for best outcomes for the animal “There’s always wastage when some wastage. The concept is to, after
and for the soil. But despite this, forage crops are grazed. The current transition, offer four days grazing, and
farmers continue to get variable results recommendation to minimise wastage move them at three, returning at a later
depending on the severity or kindness is to graze stock on a long grazing date to pick up the extra day, along with
of the winter weather, and receive front behind an electric wire, moving regrowth from the companion crop of
criticism for animal welfare outcomes the fence daily. This approach aims to plantain, essentially reducing pressure
and soil damage from grazing winter efficiently allocate the crop so it lasts on soil.
forage crops. So the following ideas right through the winter period, until
may be food for thought,” says Ballance spring grass growth takes over. “It may be that we need to rethink
Forage Specialist Murray Lane. not only how we establish the crops,
“The reality is that yield varies across prioritising retention of soil structure
the paddock. That, combined with not
Leave it uncultivated plus a suitable companion crop, but
knowing the length and severity of also how we graze the crops, prioritising
“Disruption of soil structure from winter conditions, means that allocating
cultivation leads to a greater risk minimising soil damage,” says Murray.
the crop is a moving target. While the
of soil pugging during forage crop current recommendation focuses on
grazing, as well as affecting grass grub optimising crop consumption, often FOR MORE INFORMATION
predators, often leading to poor future leading to greater soil damage, it may
pasture persistence. So leaving the dairynz.co.nz/feed/crops/wintering-
be that minimising soil damage will cows-on-crops/
soil undisturbed is a big positive,” says become the major focus. Potentially
Murray. beeflambnz.com/wintergrazing
Plantain sown with swedes. Good plantain recovery after appropriate grazing (left), compared to plantain recovery damaged by overgrazing (right).
Grow South Island / 13Animal Effluent Plant Soil
Valuable but variable
Testing soil from the same place, and in similar
conditions each year means better results.
Soil testing provides valuable and the exact location it’s taken from can be much higher, and Olsen P
information to help determine what are far more likely to be behind the slightly elevated. In dry conditions,
nutrients are required, but variability can variability. Soil’s a biological system, microbial activity is much higher
impact the reliability and accuracy of so it’s highly variable from location to and plant available nutrients such as
results. location. Furthermore, soil conditions sulphate sulphur and phosphorus are
such as temperature and moisture levels released into the soil at a rate faster than
“Soil testing is about optimising are known to affect soil test results.” plants can use, elevating levels in the
production and profits. Knowing the soil. Also during this time soil moisture
level of nutrients in the soil means
Timing (and conditions) are tends to be low so leaching and plant
you can apply the fertiliser needed to uptake of nitrate nitrogen reduces,
optimise pasture or crop growth,” says everything
which can cause it to accumulate in the
Ballance Science Extension Officer “Taking samples at the same time of
soil and push up mineral nitrogen levels.
Aimee Dawson. year as previous samples, ideally in
similar conditions and not in extreme
Even though soil testing is important, dry or wet, minimises variability in
trials have indicated that there is soil test results due to seasonal and
variability in soil test results (see Table Soil test Variability (%)
climatic factors, such as moisture and
1). “So an Olsen P result of 20 could temperature,” says Aimee (see Figure 1). pH 2-5
mean, with a potential variability of 20
per cent as seen in the trials, that the “Recent application of fertiliser and Calcium 10 - 15
soil’s Olsen P levels could be anywhere grazing by stock can also affect soil
between 16 and 24,” she says. “This test results. Ensuring you don’t soil Potassium 20 - 30
doesn’t mean that soil tests aren’t to be test within three months of fertiliser
trusted, but that you should ensure that application and avoid dung and urine Magnesium 10 - 15
you look at results over multiple years to patches will reduce test variability.” Olsen P 15 - 20
determine trends in soil fertility.”
If you test during very dry or wet
Sulphate
But what causes this variability? conditions there are a few ‘watchouts’ 20 - 40
sulphur
Laboratory environments and methods for nutrient levels. Compared to other
are strictly controlled, so are only likely times of the year, during drought or
to play a small part. “The conditions summer dry soil conditions sulphate Table 1 Typical variability in laboratory
under which a soil test sample’s taken sulphur and potassium soil test results soil tests¹
14 / ballance.co.nzAnimal Effluent Plant Soil
5.5
Temperature can affect soil pH, with pH
dropping by up to 0.2 units in warm soil
conditions due to microbes releasing 5.4
organic acid and plant roots growing.
pH
Wet winter conditions can also affect
5.3
test results, with pH increasing slightly
due to reduced microbial activity and
plant growth. In soils that leach easily,
significant rain events can lower
sulphate sulphur. In soils with low cation 35
exchange capacity such as coarse or
sandy soils, potassium can also leach,
reducing its soil test value. Phosphorus, Phosphorus 30
however, is not affected as it does not
readily leach in most soils.
25
In the spring and autumn flush, rapid
nutrient uptake by plants can cause
phosphorus, potassium and sulphate
sulphur levels to be temporarily
25
depleted.
Sulphate sulphur
"The best timing for testing is spring or 20
autumn, when soil’s not too wet or dry.
Also this is when pasture and crops are 15
actively growing so results will better
reflect the nutrient levels available to 10
growing plants."
5
Location, location, location
Setting up soil testing transects (lines
along which samples are collected) and 14
taking samples from the same transects 13
Magnesium
in subsequent years also helps to tackle 12
variability in test results. 11
“When you initially set up the transects, 10
make sure you mark them on a map 9
or with painted pegs, or take GPS
coordinates so you can use them again,”
says Aimee. 10
9
“One-off soil tests can be useful but
they can also be misleading; the full 8
Potassium
value comes from soil testing over 7
several years, so you can identify
trends in the soil’s nutrient status over 6
time, and then adjust fertiliser inputs 5
accordingly.”
FOR MORE INFORMATION
See Hill Laboratories Technical Notes 4
Seasonal and environmental effects on
Calcium
3
soil tests and Soil test variability or talk
to your Ballance Nutrient Specialist. 2
1
¹ Edmeades, DC, Cornforth IS, Wheeler DM 1985.
NZ Fertiliser Journal. J F M A M J J A S O N D
² Edmeades DC, Cornforth IS, Wheeler DM. Month of year
Occasional article: Getting maximum benefit
from soil testing. Ruakura Soil & Plant Research Figure 1 Soil test variability by month in a single paddock of a high producing dairy
Station, Hamilton farm from a MAF study on a Taupō soil²
Grow South Island / 15Animal Effluent Plant Soil
Recovering
from drought
Nitrogen (N) helps pasture The research, commissioned by conditions, or PhasedN, containing
bounce back after a drought. Ballance and independently performed SustaiN and sulphur.
and reported on, was on drought-
affected land in the Bay of Plenty and Drought followed by rain (or moist
Getting pasture back on track after
Hawke’s Bay, and indicated that any N overcast days) is when the risk of
drought is crucial for animal production
not immediately used is not lost, and nitrate poisoning is greatest, but certain
and profit, as well as ongoing pasture
produces a pasture response when practices can reduce the risk. “Avoid
persistence.
more rain arrives. grazing within three weeks of applying
Drought causes many spring tillers to N, or minimise intake one to two weeks
die or become stressed, and summer after drought-breaking rain. If stock
tillers do not emerge. “Supporting must be put on high risk pastures,
autumn tillering is important to prevent the risks of nitrate poisoning can be
pastures thinning out over winter and reduced by limiting access overnight
becoming vulnerable to weed invasion. and in the morning, when nitrate levels
This could reduce production and start a are highest, feeding well on low nitrate
cycle of decline,” says Ballance Science feeds such as straw hay or silage before
Extension Officer Joshua Verhoek. grazing, and stocking lightly to avoid
hard grazing, as the lower parts of
“Drought doesn’t affect all pastures stems have the highest nitrate levels.
equally, so they’ll need to be treated These measures will protect recovering
differently when the drought breaks.” pastures as well as stock.”
Pastures dominated by productive
species, with plants still alive or the “While applying N to dry ground is not
crown of the plant at ground level, ideal, if it’s your only opportunity, it will
recover well with support. Those with not leach but a small percentage could
weeds and large bare patches need still be lost through volatilisation, and
regrassing. “So the current recommendation is to using SustaiN minimises this loss.”
“While it’s traditionally been advised to apply N fertiliser to any live pasture “Regrassing will be needed for pasture
wait until pasture begins to recover from as soon as the first drought-breaking that’s beyond recovery. Assuming your
drought before applying N fertiliser, rains fall, so you’re not missing any base fertility is fine, you’ll need DAP
more recent research suggests that N opportunity for growth in this critical or a similar starter product to drill with
applied after the first significant rains period.” SustaiN, which does not need seed, followed by post-emergence N,
produces a similar pasture response to 5 to 10 mm of rain within eight hours provided growing conditions are good.”
deferring it until further rain has fallen,” of application to reduce volatilisation
says Josh. losses, is an ideal N option for such
16 / ballance.co.nzAnimal Effluent Plant Soil
Sustainability snaphot
We talk to Ballance National job, and how other areas can be helped be heavily involved in the Ballance Farm
to perform better. Environment Awards judging process,
Farm Sustainability Services
and their wide range of voluntary work
Manager Claire Bekhuis about The team have also been working to support good management practices
her team’s work. alongside farmers and growers to within the industry.
support them to farm within limits while
maintaining profitability. We provide With a continuously changing policy
What has the Farm sound advice and use expert tools to environment, the team are focused on
Sustainability Services team inform decision making. We’re expert being ahead of the change, upskilling
been working on recently? users of tools such as OverseerFM and with the latest science to ensure they
MitAgator, and come with strong farm can remove a lot of the stress from
There’s been a flurry of interest in our systems knowledge and a practical farmers in this space and support them
new MitAgator services (see page 19) attitude to farming within limits. to farm into the future. Some of the team
which started in 2019. We’ve produced have completed the latest Massey GHG
risk maps for a number of farmers,
What does your team do to course to support farmers with queries
bringing their critical source areas on the Zero Carbon Bill.
for nitrogen, phosphorus, sediment ensure farmers get the best
and E. coli to life and deepening their possible advice?
How many people are in the
understanding of their farming systems, We collaborate across a wide range of
ultimately supporting better decision industries, working with stakeholders
Farm Sustainability team and
making. The team have also been such as milk companies, industry where are they based?
using MitAgator to run mitigation bodies and working groups, regional The team’s nationally based, with 18
scenarios and complete farm councils, consultants, real estate agents, staff. In the last four years we’ve grown
environment plans. Helping land hold irrigation schemes, catchment groups to meet demand from the regions,
on to nutrients is vital for keeping it and banks throughout New Zealand, and now have a presence in Otago,
healthy and productive for the long haul, so we can provide the best advice to Canterbury, Hawke's Bay/Manawatu,
and MitAgator removes the guesswork farmers in the regions. Bay of Plenty and Waikato. We plan
and gives sound insights into a farm’s to extend our team into Southland to
strengths and weaknesses, identifying I’m exceptionally proud of the team’s support our shareholders with the Land
which soil is well equipped to do the passion and drive that have led them to and Water plan.
Consultation Understanding regulatory Nutrient budgets Produce risk maps
framework
Ongoing support Risk and opportunity Farm environment plans Run mitigation scenarios
recommendations
FOR MORE INFORMATION
Contact the Ballance Farm Sustainability Services team to discuss how they can help
support your farming business on 0800 222 090 or farm.sustainability@ballance.co.nz
Grow South Island / 17Animal Effluent Plant Soil
A vehicle for action
Farm environment plans are a “A farm plan’s purpose will be guided over time as actions are implemented
by issues within the farm and as well or new risks and challenges emerge.
useful tool for making moves in
as any catchment-wide issues, such They become a vehicle to show
the right direction on farm. as sediment management. So while environmental improvements over
they’re specific to each property, all time, and can be provided to milk or
Farm environment plans are good
farms within a catchment can address a meat companies you supply, as well as
business practice and a way of
common risk in their farm environment environmental regulators,” he says.
demonstrating and guiding increasing
plans,” says Jim.
sustainability on farm.
Creating a farm plan involves an FOR MORE INFORMATION
Farm plans could also become
individualised risk assessment followed
compulsory across New Zealand as • Find out how the Ballance
by the development of an action plan to
part of the Government’s proposed Farm Sustainability Services
reduce the risk. “It’s possible to develop
freshwater management reforms. team can help you to create a farm
your own farm plan or you can use a
environment plan on 0800 222 090
“In some parts of the country, farms certified farm planner, but in some places
or farm.sustainability@ballance.co.nz
meeting certain criteria (for example, if you make your own plan it must be
over a set size) are already required by signed off by a certified planner.” • See page 23 for Ballance’s
regulation to have a farm plan, or may submission on the proposed
“MitAgator (see page 19) is an excellent
need to do so in the near future,” says freshwater management reforms.
first step in getting your farm plan
Ballance Nutrient Dynamics Specialist
underway,” says Jim. The risks and
Jim Risk.
mitigations identified by MitAgator can
“The beauty of farm plans is their be used to produce a list of prioritised,
recognition of the uniqueness of each time bound actions, displayed spatially
farming system and farm landscape, on a map of the farm (see Figure 1).
giving farmers the freedom to
“A farm plan’s a living document that
implement management practices and
can be reviewed annually to see what’s
mitigations that best suit their farm.
been achieved, what needs to be done
They also identify key actions already in
in the future and if anything’s changed
place to address risks, such as riparian
that may impact future planning. The
management, and prioritise future
plan can be added to and changed
actions.”
A farm environment plan reflects
the environmental risks and
opportunities a farm faces and
sets out how soil, water and
nutrients will be sustainably
managed. They can also be multi-
purpose, integrating other areas
such as biodiversity, biosecurity,
winter grazing, waste and
greenhouse gases. They always
include:
• Risks on farm – current
and potential losses of the
four key contaminants to
water (nitrogen, phosphorus,
sediment and E. coli)
• Actions – current mitigations
and prioritised planned
mitigations to reduce the risks
• Timelines – when good
management practices and
Figure 1 MitAgator action map for Why-One Farms. Actions are numbered
mitigations will be implemented
and their colour indicates the level of risk being addressed (pink=high risk,
green=medium risk, blue=low risk).
18 / ballance.co.nzAnimal Effluent Plant Soil
MitAgator plan, involving strategic use of crops to
reduce N losses.
between the nutrients and the different
soil types. It’s great to be able to see
it all visually. It can surprise you, or
at work MitAgator’s identification of the critical
source areas for P loss (see Figure 2)
has led to strategic application of P
confirm your thinking,” says Richard.
The Subtils are continuing to work with
fertiliser. This involves reviewing Olsen Julie and Kerry to utilise the full richness
A powerful new tool has P tests on high risk areas where higher of their risk maps by testing mitigations.
helped a Mackenzie basin P loss is more likely if soil test levels are MitAgator can test the outcome
farming couple choose the best above optimum, as well as working with achieved by different combinations of
Ballance Nutrient Specialist Kerry on mitigation options, as well as provide
mitigations for contaminant mitigation options to reach a set target,
maintaining a sustainable fertiliser plan
losses. such as reducing P loss to meet a
and soil testing regime.
target.
Richard and Annabelle Subtil have A sediment risk map (not shown here)
benefited from using Ballance’s identified high risk areas, supporting FOR MORE INFORMATION
MitAgator service on their 12,000 ha thinking on how to manage such areas
high country sheep and beef farm, Visit ballance.co.nz/mitAgator. To find
to further reduce losses.
Omarama Station. out more about the MitAgator service
“We now have a much better phone 0800 222 080 or email
“We wanted to learn as much as possible understanding of the interaction farm.sustainability@ballance.co.nz.
about the outcomes on our property so
that we can target the areas where we
can make the biggest difference,” says Risk map - Nitrogen
Richard. This led them to Ballance’s Risk map - Nitrogen
Risk map Classification: Quantile
MitAgator service, a further step on their LoadRisk map Classification: Quantile
Loss(kg/ha/yr)
journey towards a more sustainable and
Load Loss(kg/ha/yr)
profitable farming operation.
MitAgator, cutting-edge software,
spatially identifies critical source
areas of nitrogen (N), phosphorus (P),
sediment and E. coli losses on farm and Definition - Quantile assigns the same number of data
then finds the best mitigation options to values to each-class.
Definition Quantile assigns the same number of data
values to each class.
reduce losses.
Total loss (kg/yr) Total loss rate (kg/ha/yr)
57,835.00
Total loss (kg/yr) 4.84Total loss rate (kg/ha/yr)
57,835.00 4.84
• The total Nitrogen load for the property is
4.84 •Kg/ha
The /yr.
total Nitrogen load for the property is
The Subtils teamed up with Ballance 4.84 Kg/ha /yr.
• The highest loss on the farm is illustrated by the dark
pink •areas
The highest loss on
on the map. the farm
These is illustrated
contribute 19.95%byto
the dark
the
Farm Sustainability Services Senior totalpink areasload.
Nitrogen on the map. These contribute 19.95% to the
total Nitrogen load.
• The next highest risk areas on the farm are illustrated
Specialist Julie Lambie and Nutrient
• The next highest risk areas on the farm are illustrated
by the light pink areas on the map. These contribute
by the light pink areas on the map. These contribute
17.61% to the total Nitrogen load.
17.61% to the total Nitrogen load.
Specialist Kerry Galvin, and used
• The medium to low Nitrogen risk areas for the farm
• The medium to low Nitrogen risk areas for the farm
are illustrated by the green, light and dark blue areas on
are illustrated by the green, light and dark blue areas on
the map. These contribute 62.4% respectively to the
MitAgator to produce risk maps,
the map. These contribute 62.4% respectively to the
total Nitrogen load.
total Nitrogen load.
• Key drivers of the nitrogen loss are: cropping areas
• Key drivers of the nitrogen loss are: cropping areas
identifying critical source areas for N, and soil
and type.
soil type.
P and sediment losses on the farm,
showing the relative risk of loss within Figure 1
the property and prioritising areas for MitAgator nitrogen risk map for Omarama Station.
Risk map - Phosphorus
mitigations. Risk map - Phosphorus
Risk map Classification: Quantile
Risk map Classification: Quantile
Load Loss(kg/ha/yr)
The couple already had a nutrient Load Loss(kg/ha/yr)
budget, showing N and P loss and
movement, but it was not easy to relate
this information spatially to the property.
Identifying the less obvious areas of
high risk for contaminant loss, such as
N leaching or how P loss varies across Definition - Quantile assigns the same number of data
the property was also a challenge. Definition
values to each- class.
Quantile assigns the same number of data
values to each class.
Total loss (kg/yr) Total loss rate (kg/ha/yr)
Total loss (kg/yr)
907.77 0.08Total loss rate (kg/ha/yr)
907.77 0.08
MitAgator’s ability to visually and •The total Phosphorus load for the property is
•The total Phosphorus load for the property is
0.08 Kg/ha /yr.
spatially display the critical source areas
0.08 Kg/ha /yr.
•The highest loss on the farm is illustrated by the dark
•The highest loss on the farm is illustrated by the dark
pink areas on the map. These contribute 57.68% to
for N loss (see Figure 1) allowed the
pink areas on the map. These contribute 57.68% to
the total Phosphorus load.
the total Phosphorus load.
•The next highest risk areas on the farm are illustrated
•The next highest risk areas on the farm are illustrated
nutrient loss to be more easily relatable
by the
by light pinkpink
the light areas on the
areas map.
on the These
map. contribute
These contribute
23.41% to the
23.41% to total Phosphorus
the total load.
Phosphorus load.
to the property. Showing the location
•The•The
medium
mediumto low Phosphorus
to low Phosphorus riskrisk
areas forfor
areas thethe
farmfarm
are illustrated by the
are illustrated green,
by the light
green, andand
light dark blue
dark blue
areas on the
areas map.
on the These
map. contribute
These contribute18.92 % to
18.92 thethe
% to
of loss helped with understanding the totaltotal
Phosphorus
•Key•Key
Phosphorus
drivers in the
drivers
load.
in the
load.
highhigh
riskrisk
areas areare
areas slope andand
slope thethe
relativity and quantity of loss, as well as soil type.
soil type.
the background drivers of loss, such as
soils vulnerable to leaching. This led to Figure 2
development of a winter management MitAgator phosphorus risk map for Omarama Station.
Grow South Island / 19You can also read