Tracing the Path to YouTube: A Quantification of Path Lengths and Latencies Toward Content Caches - Vaibhav Bajpai
←
→
Page content transcription
If your browser does not render page correctly, please read the page content below
ACCEPTED FROM OPEN CALL

                    Tracing the Path to YouTube:
                 A Quantification of Path Lengths and
                  Latencies Toward Content Caches
                                           Trinh Viet Doan, Ljubica Pajevic, Vaibhav Bajpai, and Jörg Ott

Quantifying the benefits                            Abstract                                       traffic (as of July 2014) as witnessed by Comcast.
of content cache deploy-                                                                           Consequently, content providers are witnessing
ments, both in terms of             Quantifying the benefits of content cache                      an increasing trend of clients requesting content
                                deployments, both in terms of latency and path                     over IPv6. For instance, Google reports that ~90
latency and path lengths,
                                lengths, and identifying the disparity of achiev-                  percent of traffic originating from Verizon Wire-
and identifying the dispar-     able benefits over IPv6 and over IPv4, is essen-                   less clients is over IPv6 [6]. Similarly, according
ity of achievable benefits      tial to identify bottlenecks in content delivery.                  to Facebook and Akamai, more than half of the
over IPv6 and over IPv4, is     We approached this matter by collecting and                        traffic from four major U.S. mobile networks to
essential to identify bottle-   analyzing traceroute measurements toward                           Facebook and dual-stacked websites hosted on
                                YouTube from ~ 100 vantage points located in                       Akamai originates from IPv6 clients alone [6].
necks in content delivery.
                                74 different origin autonomous systems (ASs).                          Swisscom reports (as of October 2014) that
The authors approached          Using a longitudinal dataset (05/2016–05/2018),                    ~ percent of their IPv6 traffic is served by You-
                                                                                                    60
this matter by collecting       we show that most of the Google Global Cache                       Tube (with ~5 percent by Facebook) alone. As
and analyzing traceroute        (GGC) nodes were reachable within ~6 IP hops                       such, YouTube is the single largest source of IPv6
measurements towards            and within ~20 ms from users streaming the vid-                    traffic in ISP networks. We pose three questions:
                                eos. Further, we observed that in cases where                      How far are GGC nodes in terms of path lengths
YouTube from ~100 van-
                                GGC nodes were dual-stacked, the path lengths                      and latency from vantage points that stream You-
tage points located in 74       and latencies were comparable over both address                    Tube content? How much benefit do they provide?
different origin                families. However, as generally believed, shorter                  How do these metrics compare quantitatively over
autonomous systems.             path lengths did not always correlate with lower                   IPv4 and IPv6? To investigate these questions, we
                                latency: when the video was cached by a GGC                        performed traceroute measurements toward
                                node over IPv6 only, paths were almost always                      YouTube media server locations over both address
                                shorter over IPv6. Yet, latencies were still lower                 families from ~100 geographically distributed van-
                                over IPv4, indicating room for improvement over                    tage points to ensure the diversity of network
                                IPv6. GGCs reduced IP path lengths and latencies                   origins. These vantage points receive native IPv4
                                by up to a third over IPv4 and by up to a half over                and IPv6 connectivity and belong to different Inter-
                                IPv6, stressing the importance of content cache                    net Service Providers (ISPs), covering 74 different
                                deployments in ISP networks. To encourage                          origin ASs. This article presents an analysis of a
                                reproducibility of this work, we make the entire                   longitudinal dataset (05/2016–05/2018) toward
                                dataset available to the community.                                YouTube media server locations (or Google Global
                                                                                                   Cache (GGC) nodes in situations where the video
                                                 Introduction                                      was cached), collected by these dual-stacked van-
                                Latency is a critical factor that impacts Quality                  tage points. Our main findings are:
                                of Experience (QoE) in networks [1]. To meet                       • Path lengths and latencies toward YouTube
                                the increasing user demands in this respect, con-                     media server destinations over both address
                                tent delivery networks (CDNs) make continuous                         families were similarly distributed, with ~50 per-
                                efforts [2, 3] to move popular content as close to                    cent of the paths being faster over IPv6, while
                                the edge as possible by deploying content cach-                       in ~91 percent of the cases, path lengths and
                                es directly in ISP networks [4, 5]. Lately, due to                    latencies between address families differed by
                                the rapid depletion of the IPv4 address space,                        five IP hops and 20 ms of each other.
                                prominent ISPs have also rolled out IPv6 both                      • GGC nodes were reachable within approxi-
                                in fixed-line and cellular networks. Furthermore,                     mately six IP hops and within ~20 ms (more
                                given that dual-stacked clients prefer requesting                     details provided in a later section) from van-
                                content over IPv6 (RFC 8305, RFC 6724) rather                         tage points streaming the videos. In situa-
                                than IPv4, the amount of IPv6 traffic on the Inter-                   tions where GGC nodes were dual-stacked,
                                net is also increasing with these rollouts. ISPs such                 path lengths and latencies were comparable
                                as Comcast and Swisscom estimate IPv6 traffic                         over both address families. However, con-
                                within their network to be ~25 percent of the total                   trary to what is generally believed, shorter
                                traffic os of 2017 [6]. In terms of traffic volume,                   path lengths did not always correlate with
                                this amounts to more than 1 Tb/s of native IPv6                       lower latency. When the video was cached
Digital Object Identifier:
10.1109/MCOM.2018.1800132                                             The authors are with Technical University of Munich.

80                                       0163-6804/19/$25.00 © 2019 IEEE                                         IEEE Communications Magazine • January 2019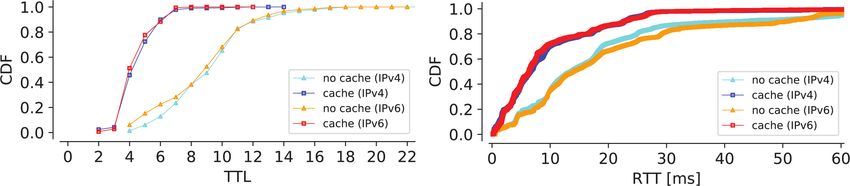
by a GGC node over IPv6 only, paths were
   almost always shorter over IPv6, yet latencies
   were still lower over IPv4.
• GGC nodes reduced IP path lengths and
   latency by up to a third over IPv4 and by
   up to a half over IPv6. As such, ISPs need
   to ensure their caches are dual-stacked to
   benefit from the reduced latency.
    To the best of our knowledge, this is the first
study to quantify the latency and path lengths
toward YouTube media servers while also consid-
ering disparities between address families along
with GGC node deployments and the quantifi-
cation of their benefits. To encourage reproduc-        Figure 1. Geographic distribution of ∼ 100 dual-stacked SamKnows probes as
ibility [7], the entire dataset and software (details      of June 2018. The metadata for each probe is available online:
provided in a later section) used in this study will       https://goo.gl/NN81ij; accessed 26-June-2018.
be made available to the community.

                 Methodology                            destinations had very low failure rates in terms
We have developed a youtube test [8] that               of reachability (0.5–2 percent failure over both
downloads and mimics the playing of YouTube             address families). However, the causality analysis
videos. The test runs twice, once for IPv4 and sub-     revealed different reasons for the failure with the
sequently for IPv6, and repeats every hour. We          highest contribution. For instance, for IPv4, loops
use the YouTube Data API to generate a list of          were the most common causes of failures, as
globally popular videos, which is refreshed every       opposed to unreachable destinations over ICMP
24 hours. This allows us to measure the same            for IPv6. In this way, due to overall low failure
video for the entire day, which allows for tempo-       rates, the rest of the analysis was performed for
ral analysis, while cycling videos on a daily basis     situations where traceroute was successful.
allows for larger coverage ( ~ 1865 videos as of
May 2018) with different characteristics in the                            Temporal View
longitudinal dataset. We refer the reader to our        Given the longitudinal nature of the dataset, we
previous work [8] for a more detailed description       wanted to know: have IP path lengths and laten-
of the youtube test.                                    cies toward YouTube destinations improved over
    We run scamper [9] immediately after the            the observation period? Toward this pursuit, we
youtube test completes. The scamper test                studied the distributions of maximum TTL (rep-
performs paris-traceroute [10] over ICMP                resenting path lengths) and RTT (representing
toward the media server destinations identified         latencies) values for all IPv4 and IPv6 measure-
by the youtube test (or GGC nodes in situa-             ments by month, shown in Fig. 2. As can be seen,
tions where the content was cached) both over           the interquartile ranges of both metrics appear
IPv4 and IPv6. The identification of GGC nodes          congruent over both address families across all
is performed offline and is not forced during the       months. Aggregations by days and hours deliv-
measurement phase. These measurements are               ered similar observations, indicating that there
run every hour to keep the load on the volun-           have been no substantial changes over the obser-
teers’ networks tolerable, while still allowing us      vation period. Additionally, we calculated the del-
to collect a representative dataset of captured         tas as the absolute difference between IPv4 and
latencies and path characteristics for the streamed     IPv6 TTL (and RTT) values for a measurement,
videos. The measurements are performed from             and observed that the deltas were consistently
~100 SamKnows [11] probes, whose locations are          located around zero for both path lengths and
shown in Fig. 1. These probes are connected in          latencies as well. Further analysis of individual van-
dual-stacked networks representing 74 different         tage points and their measurements added little
origin ASs. Most of these probes are connected          variance in the deltas over either address family.
within the RIPE (60 probes) and ARIN region (29         Takeaway: The longitudinal view of path lengths
probes), and are mainly hosted in home networks         and latency toward YouTube media server des-
(~75) with native IPv6 connectivity.                    tinations appeared congruent over both address
    The performance dataset collected by the            families over the duration of the dataset.
youtube test was reported in our previous study
[8]. In another recent study [12], we further inves-                        Spatial View
tigated the stability and load balancing behav-         For all discovered paths, which we defined as the
ior of paths toward YouTube, in particular with         distinct 3-item tuple of probe, source and des-
regards to interdomain links. In this article, we       tination addresses, we began by analyzing the
take this research forward by analyzing the lon-        distribution of the median IP path lengths and
gitudinal scamper dataset (05/2016–05/2018)             latencies. We witnessed a low fraction of outli-
to quantify the path lengths and latency toward         ers and applied median aggregates to avoid bias
YouTube destinations.                                   caused by limitations with traceroute mea-
                                                        surements. Figure 3a shows that paths over both
         Temporal and Spatial View                      address families are very similarly distributed.
We began the analysis by calculating the rate              We go further and compare IPv4 with IPv6
of successful executions of traceroute mea-             in terms of path lengths and latencies toward
surements within our dataset. We observed that          individual YouTube media servers to see which
traceroute measurements toward YouTube                  address family provides better performance. To

IEEE Communications Magazine • January 2019                                                                                      81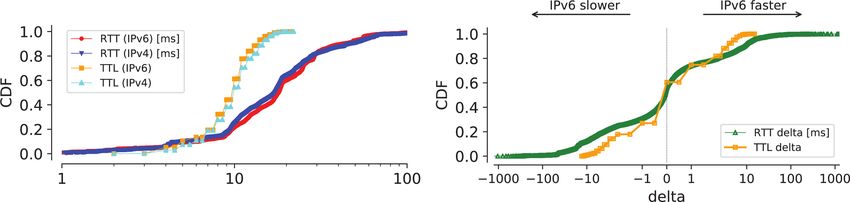
Our longitudinal dataset
 allowed us to carry out
 a quantitative compari-
 son of performance (in
     terms of path lengths
     and latency) benefits
 as witnessed when the
     video was streamed
 from a GGC deployed
 directly within the ISP’s
     network versus when     Figure 2. Boxplots of TTL (top) and RTT (bottom) values for IPv4 (left) and IPv6 (right) by month over the
 the video was streamed         entire duration of the dataset. During the grayed out area (08/2017–01/2018), data was filtered out
                                due to missing and faulty measurements. The path lengths and latencies towards YouTube destinations
 from a CDN outside the
                                appear congruent over both address families.
 ISP’s network boundary.
                             do so, we introduced the notion of destination             Toward this goal, we employed a heuristic for
                             pairs. A destination pair is a tuple of destination    both address families where we mapped the IP
                             endpoints over IPv4 and IPv6 that were streaming       endpoint of the YouTube media server destination
                             a specific video to the same vantage point within      to the ASs that announce the most specific prefix
                             an hourly window of each other, yielding ~43K          encompassing the IP endpoints. Given knowledge
                             distinct destination pairs.                            about the source ASs of the probes and consider-
                                 Figure 3b shows the median TTL (and RTT) del-      ing that ~75 percent of the probes are deployed
                             tas for such destination pairs. As can be seen, path   in home networks, a match in the source and
                             lengths and latencies toward the destinations fol-     destination ASs indicates that requests did not
                             low a very similar distribution. Approximately 27      leave the ISP boundary, revealing the presence of
                             percent of the destination pairs had longer path       a GGC delivering the YouTube video to the van-
                             lengths over IPv6 (with negative deltas) while ~40     tage point. For validation, we further performed
                             percent of the destination pairs had shorter path      reverse DNS lookups for each (~20K unique) des-
                             lengths over IPv6 (with positive deltas), meaning      tination IP endpoint. These reverse DNS entries
                             that more paths over IPv6 were shorter when com-       (such as cache.google.com, *.cache.goog-
                             pared to IPv4. The remaining ~33 percent of the        levideo.com) were used as additional identi-
                             destination pairs had equal path lengths over both     fiers for GGC nodes. Non-matching cases were
                             address families (exhibiting median deltas at zero).   labeled as no-cache scenarios. Note that the
                             Similarly, around half of the destination pairs had    goal here was not to exhaustively identify GGC
                             RTT deltas that were less than –0.05 ms, that is,      deployments, but to measure latency and path
                             less than roughly zero. As such, destination pairs     lengths for cases in which GGC nodes could be
                             for the latency distribution were split into almost    identified with reasonable certainty.
                             two equally-sized bins, where half of the destina-
                             tions could be reached faster over IPv6, while the          benefIts between dIfferent Address fAMIlIes
                             other half were reached more quickly over IPv4.        Using Fig. 3b as the baseline, we split the path
                             Also, ~12.5 percent of the destination pairs were      length and latency distribution of destination pairs
                             reached more than 10 ms faster over IPv4, while        into four situations based on whether the video
                             only ~8 percent of the destination pairs were more     was delivered by:
                             than 10 ms faster over IPv6. Interestingly, even       1. Cache over IPv4 but not over IPv6.
                             though more paths were shorter over IPv6, more         2. Cache over IPv6 but not over IPv4.
                             paths had lower latency over IPv4. Looking at the      3. Caches over both address families.
                             entire distribution, it can be seen that the major-    4. Caches over neither address family.
                             ity of the path lengths (~91 percent) differed by      In situations 1 and 2 where a cache was present
                             five IP hops and the majority of the latencies (~91    over only one address family, one would expect
                             percent) differed by 20 ms across address families.    to observe shorter path lengths and latency over
                             Takeaway: The path lengths and latency distribu-       the address family that had the video delivered
                             tions of YouTube destination pairs over IPv4 and       from a deployed cache. Figure 4 shows the quan-
                             IPv6 followed a very similar distribution.             tification of these benefits in terms of path lengths
                                                                                    and latency when a cache delivered the video.
                               how benefIcIAl Are content cAches?                   It can be seen that the distributions shift away
                             Content cache deployments bring performance            from zero (congruency) in situations when the
                             benefits by bringing content closer to the user.       cache was available on one address family (blue
                             However, these benefits have not been quantified       and red) only. The offset of the shift quantifies
                             in practice. Our longitudinal dataset allowed us       the benefit the video delivery from a cache brings
                             to carry out a quantitative comparison of perfor-      when compared to the no-cache deployment sce-
                             mance (in terms of path lengths and latency) ben-      nario over the other address family. It must also
                             efits as witnessed when the video was streamed         be noted that the offset (especially with latency)
                             from a GGC deployed directly within the ISP’s          is weaker when the cache was only available over
                             network versus when the video was streamed             IPv6; potential reasons for this observation are
                             from a CDN outside the ISP’s network boundary.         discussed later.

82                                                                                            IEEE Communications Magazine • January 2019
Figure 3. a) Distribution of median TTL and RTT values for paths. The distribution curves of each metric are largely overlapping for
both IPv4 and IPv6, suggesting a comparable performance considering the similar number of samples. b) Distribution of median
TTL and RTT deltas of destination pairs, indicating symmetry around zero. Around half of the pairs were faster over IPv4, whereas
the other half were faster over IPv6.
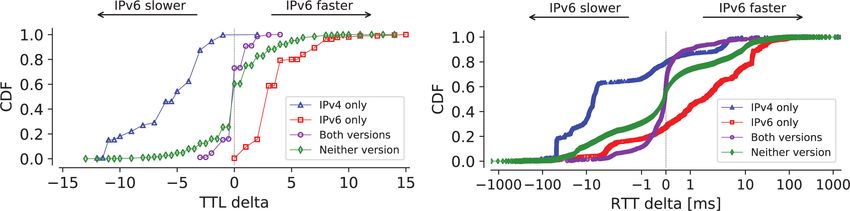
Figure 4. Distribution of deltas of TTL (left) and RTT (right) for destination pairs, classified by cache presence for IPv4 and IPv6: (1)
IPv4 only; (2) IPv6 only; (3) Cache present for both address families; (4) No cache present for either address family. Latency and
path length distributions shift away from congruency when a cache was available over one address family only. Latency and path
lengths are comparable between address families in situations when caches were dual-stacked.
In situations where both address families had Even though paths were shorter toward these
the video delivered over a cache (purple), the IPv6 caches, ~ 27 percent of the samples were
distribution converges toward zero (congruency), still slower over IPv6 when compared to IPv4.
indicating that the path lengths and latency were In these situations, streaming the video from a
comparable and exhibited less variation in the local cache over IPv6 was still slower than leav-
distribution. The green curve represents the situ- ing the ISP boundary over IPv4 to stream the
ation when the video was not delivered from an video. Overall, we witnessed several cases where
identified cache over either address family, with content was served from a cache over only one
the largest variation in path length and latency address family, hinting toward areas of improve-
distribution between address families. As such, the ment in dual-stacking content cache deployments.
path lengths and latencies were comparable and Takeaway: In situations where GGC nodes were
predictable when caches were involved in both dual-stacked, IP path lengths and latencies were
address families. comparable over both address families. Shorter IP
Nearly all caches over IPv4 ( ~ 99.7 percent) path lengths, however, did not always correlate
had path lengths that were at least one IP hop with lower latency as is generally believed. When
shorter than when IPv6 had no cache present. the video was cached by a GGC node over IPv6
Similarly, ~99.5 percent of the cases with an IPv6 only, paths were almost always shorter over IPv6,
cache had path lengths that were at least one IP yet latencies were still lower over IPv4.
hop shorter than when IPv4 had no cache pres-
ent. In situations where caches were present in Benefits Within the Same Address Family
both address families, ~60 percent of the samples We went further to quantify by how much the
were faster over IPv4, while ~40 percent of the path lengths and latencies were reduced due to
samples were faster over IPv6. However, in these GGC node deployments within the same address
situations, ~79 percent of the samples were with- family. Figure 5 shows the distribution of path
in 1 ms apart from each other, suggesting that lengths and latency for all the samples grouped
the difference in latency when caches were dual- by address family. It can be seen that almost all
stacked was usually marginally small. When cach- the samples reached the cache over IPv4 with-
es were only available over IPv4, we observed in seven IP hops. In ~90 percent of the samples,
that in ~80 percent of the samples the latency was caches were reached within six IP hops, while
lower over IPv4, with ~35 percent of the samples ~88.5 percent of the no-cache destinations were
being faster by even more than 10 ms over IPv4. reached in 12 hops. As such, caches reduced IPv4
The most interesting finding was for cases path lengths by up to one half. Regarding IPv6,
where caches were only available over IPv6. similar observations were made: nearly all caches
IEEE Communications Magazine • January 2019 83Figure 5. Comparison of path lengths (left) and latency (right) of individual IPv4 and IPv6 samples, split by cache and no-cache deploy-
ments. Caches reduce IP path lengths and latencies by up to ∼50 percent.
were reached in at most seven IP hops. In ~ 88 ther categorized by Transit/Access and Content
percent of the samples, caches could be reached AS (the number of intermediate IP endpoints
within six IP hops, while ~89 percent of no-cache assigned to Enterprise ASs was negligible). It can
servers were reached in 12 IP hops, leading to the be seen that more than ~ 93 percent of the IP
same observation that a cache reduced IP path endpoints belonging to Transit/Access type ASs
lengths by up to one half for IPv6. Considering had a path length of at most seven IP hops from
latencies, the majority of samples were able to the probe over both address families. In contrast,
reach a cache within 20 ms over both IPv4 and ~85 percent of the IP endpoints assigned to Con-
IPv6 (~87 percent for each address family). Inter- tent type ASs had a path length of at least seven
estingly, when quantifying the improvements in IP hops from the probe over both IPv4 and IPv6.
latency, we observed that over IPv4, differences As such, seven IP hops can serve as a heuris-
between caches and no-cache deployments were tic to identify the boundary between ISP and
smaller than over IPv6. In particular, over IPv6, CDN providers. Figure 6b visualizes this trend. It
latencies could be reduced by up to about one shows the correlation of latency with increasing
half (from ~29 ms to ~16 ms for ~80 percent of path lengths and uses the heuristic of seven IP
the samples), while over IPv4, latencies could only hops to delineate the boundary of ISP and con-
be reduced by up to roughly one third (from ~25 tent providers. The spike from the first to the sec-
ms to ~17 ms) for a similar amount of samples. ond IP hop are last-mile latencies within the ISP’s
Previously, we observed that for cases in network. The shorter path lengths (blue region)
which a video was only streamed from a local represent caches (and their subsequent laten-
IPv6 cache but was streamed from outside the cy) in ISP networks, while longer path lengths
ISP network over IPv4, the IPv6 cache brought (red region) represent CDNs. This analysis also
less latency benefits than seen for the reverse supports our previous findings where we demon-
case. We also showed that even though more strated that most caches were reachable within
destination pairs had shorter path lengths over a path length of seven IP hops. Takeaway: Path
IPv6, more pairs still had lower latencies over lengths of up to seven IP hops can serve as a heu-
IPv4. When comparing cache benefits within the ristic to delineate the boundary of ISP networks
same address family, we observe that deploying and CDN providers.
caches over IPv6 brings more benefits in terms
of reducing IP path lengths and latency than the Related Work
cache deployments over IPv4. We speculate this Chiu et al. [3] (2015) run traceroute from
observation could be either due to IPv4 optimi- Planetlab vantage points to measure the aver-
zation or due to router bufferbloat. However, the age path of high traffic routes on the Internet.
dataset does not have the information to provide They find that most paths from a large content
direct evidence for these assumptions. Takeaway: provider, Google, go directly from Google’s
Cache deployments over either address family network into the client’s network, as opposed
were able to reduce IP path lengths by up to one to average paths that traverse one or two inter-
half (six IP hops). However, latency was halved mediate transit ASs. They also show that from
over IPv6 but only reduced by one third over IPv4 the same content provider, popular paths serv-
(up to about 13 ms, respectively 8 ms, of differ- ing high-volume client networks tend to be
ence), highlighting the importance of IPv6 cache shorter than paths to other networks, observ-
deployments. ing that some content providers even host serv-
ers in other networks, which in effect shortens
How Far are the Content Caches? paths further. Livadariu et al. [13] (2016) show
We further analyzed the intermediate IP hops that IPv6 exhibits less stability than IPv4 in the
on the entire path from source (vantage points) control and data planes. The reason for worse
to destination. We mapped each intermediate performance in the control plane was that
IP endpoint to its corresponding ASN over both most routing dynamics were generated by a
address families. Further, we augmented the ASN small fraction of pathological unstable prefixes,
by using the CAIDA’s AS classification dataset to whereas in the data-plane, episodes of unavail-
classify each AS by its network type, such as Tran- ability were longer on IPv6 than on IPv4. Basu
sit/Access, Enterprise and Content ASs. et al. [14] (2018) propose two TTL-based cach-
Figure 6a shows the distribution of path ing algorithms that are able to handle non-sta-
length toward intermediate IP endpoints, fur- tionary request traffic for CDNs. The algorithms
84 IEEE Communications Magazine • January 2019are able to adapt to the traffic automatically
and can simultaneously achieve target hit rates
with high accuracy, evaluated on the basis of a
high volume dataset from a production CDN.
lIMItAtIons
The observations are biased by the number and
location of the vantage points, which largely
cover the U.S., EU and JP regions. However, a
large fraction of IPv6 deployment is also centered
in these regions, but we acknowledge that the
state of IPv6 adoption may change in the future.
traceroute is also known to have several
limitations [15]. For instance, ICMP packets may
encounter issues with non-cooperative routers on
the path and thus be highly variable in response
times, even in unloaded networks. The dataset,
however, does not have information about the
network load to allow filtering such outliers. It is
assumed that in traceroute measurements,
ICMP responses are generated from the ingress
interface of each router on the forwarding path.
However, studies have shown that some routers
also send ICMP responses using their egress inter-
face. As such, routers that are located on the bor-
der of two ASs can be mapped to either of the
ASs in such scenarios.
We did not perform region-based analysis
of our results for two reasons. First, studies [5]
have shown that the AS-based network topology Figure 6. a) Distribution of path lengths towards intermediate IP endpoints
(as revealed by traceroute) does not repre- classified by AS types. Path lengths up to 7 IP hops can serve as a heuristic
sent the geographical topology of the traversed to delineate the boundary of ISP networks and CDN providers. b) Boxplots
paths. Second, even with ground-truth informa- of latency by path lengths over IPv4 (top) and over IPv6 (bottom) as seen
tion of probe locations, grouping probes by their from residential vantage points. The blue tone represents caches in ISP net-
geographic regions results in a very low sample works, while the red tone represents CDNs.
size per group. As such, it becomes infeasible to
reasonably analyze and discuss IP path lengths
and latencies taking the regional information into reproducIbIlIty consIderAtIons
account for this study. The dataset collected by running scamper from Sam-
Knows probes is stored as a SQLite database (along
conclusIon with the SQL schema) and is made publicly available
We presented the benefits of content cache (https://github.com/tv-doan/youtube-traceroutes), together
deployments in ISP networks with path length with the Jupyter notebooks used in the analysis to gen-
and latency comparisons over both address fam- erate the plots. Guidance on how to reproduce these
ilies. When streaming YouTube, we identified results is provided, and reproducers are encouraged to
that streaming from a GGC node reduced path contact the authors for further details and questions.
lengths and latencies to reach the content within
approximately six IP hops and within 20 ms. How- references
ever, cache deployments were seen to have more [1] S. Sundaresan et al., “Measuring and Mitigating Web Per-
benefit for IPv6, as IPv6 caches reduced laten- formance Bottlenecks in Broadband Access Networks,”
Proc. 2013 Internet Measurement Conference, IMC, 2013;
cies by up to roughly 50 percent, whereas IPv4 available: http://doi.acm.org/10.1145/2504730.2504741
caches only improved latencies by up to around [2] X. Fan, E. Katz-Bassett, and J. S. Heidemann, “Assessing Affin-
33 percent. As such, ISPs can improve latencies ity Between Users and CDN Sites,” Proc. Traffic Monitoring
significantly by deploying GGC nodes within their and Analysis — 7th Int’l. Workshop, TMA, 2015; available:
https://doi.org/10.1007/978-3-319-17172-2_7
network. Further, we observed that in situations [3] Y. Chiu et al., “Are We One Hop Away from a Better Internet?”
when GGC nodes were dual-stacked, path lengths Proc. 2015 ACM Internet Measurement Conference, IMC, 2015;
and latencies were comparable over both address available: http://doi.acm.org/10.1145/2815675.2815719
families. Therefore, we recommend ISPs who are [4] F. Chen, R. K. Sitaraman, and M. Torres, “End-User Mapping:
Next Generation Request Routing for Content Delivery,”
either in the process of or are in the early stages Proc. 2015 ACM Conference on Special Interest Group on
of IPv6 deployment to ensure that their existing Data Communication, SIGCOMM, 2015; available: http: //
GGC nodes are dual-stacked. We also showed doi.acm.org/10.1145/2785956.2787500
that when the video was cached by a GGC node [5] M. Calder et al., “Mapping the Expansion of Google’s Serving
Infrastructure,” Proc. 2013 Internet Measurement Conf., IMC,
over IPv6 only, paths were almost always shorter 2013; available: http://doi.acm.org/10.1145/2504730.2504754
over IPv6. However, latencies were still higher [6] Internet Society, “State of IPv6 Deployment 2017,” accessed
when compared to an IPv4 no-cache deployment, 26-June-2018; available: https://goo.gl/u1tiGK.
indicating room for improvement regarding rout- [7] V. Bajpai et al., “Challenges with Reproducibility,” Proc. Repro-
ducibility Workshop, Reproducibility@SIGCOMM, 2017;
ing and processing over IPv6. We hope these available: http://doi.acm.org/10.1145/3097766.3097767
insights will help both ISPs and CDN providers to [8] V. Bajpai et al., “Measuring YouTube Content Delivery over
optimize their content delivery over IPv6 to the IPv6,” Computer Communication Review, 2017; available:
benefit of user QoE. http://doi.acm.org/10.1145/3155055.3155057
IEEE Communications Magazine • January 2019 85[9] M. J. Luckie, “Scamper: A Scalable and Extensible Packet Master’s degree in informatics (2017). His research interests
Prober for Active Measurement of the Internet,” Proc. 10th include Internet measurements and decentralized Internet infra-
ACM SIGCOMM Internet Measurement Conf., IMC, 2010; structures.
available: http://doi.acm.org/10.1145/1879141.1879171
[10] B. Augustin, T. Friedman, and R. Teixeira, “Measuring Ljubica Pajevic is a research assistant at the Chair of Connected
Load-Balanced Paths in the Internet,” Proc. 7th ACM SIG- Mobility at TUM. She holds a Licentiate degree in electrical
COMM Internet Measurement Conference, IMC, 2007; avail- engineering from the KTH Royal Institute of Technology (2013)
able: http://doi.acm.org/10.1145/1298306.1298329 and an M.Sc. degree in systems engineering and wireless com-
[11] V. Bajpai and J. Schönwälder, “A Survey on Internet Perfor- munications from the School of Electrical Engineering, University
mance Measurement Platforms and Related Standardization of Belgrade, Serbia (2009). Her research interests are modeling
Efforts,” IEEE Commun. Surveys and Tutorials, 2015; avail- and performance evaluation of opportunistic mobile networks,
able: https://doi.org/10.1109/COMST.2015.2418435 and data mining in wireless networks.
[12] R. K. P. Mok et al., “Revealing the Load-Balancing Behavior
of YouTube Traffic on Interdomain Links,” Proc. 19th Int’l. V aibhav B ajpai is a postdoctoral fellow at TUM. He works
Conf. Passive and Active Measurement, PAM, 2018; avail- with Prof. Jörg Ott. He received his Ph.D. (2016) and Master’s
able: https://doi.org/10.1007/978-3-319-76481-8_17 (2012) degrees in computer science from Jacobs University Bre-
[13] I. Livadariu, A. Elmokashfi, and A. Dhamdhere, “Characteriz- men, Germany, where he was advised by Prof. Jürgen Schön-
ing IPv6 Control and Data Plane Stability,” Proc. 35th Annual wälder. He is the recipient of the IEEE ComSoc award for the
IEEE Int’l. Conf. Computer Commun., INFOCOM, 2016; avail- best dissertation in network and service management in 2017.
able: https://doi.org/10.1109/INFOCOM.2016.7524465 He is interested in Internet measurements, network manage-
[14] S. Basu et al., “Adaptive TTL-Based Caching for Content ment and reproducibility of scientific research.
Delivery,” IEEE/ACM Trans. Netw., vol. 26, no. 3, 2018, pp.
1063–77; available: https://doi.org/10.1109/TNET.2018.2818468 Jörg Ott holds the Chair of Connected Mobility in the Depart-
[15] B. Donnet and T. Friedman, “Internet Topology Discovery: ment of Informatics at TUM. He is also an adjunct professor
A Survey,” IEEE Commun. Surveys and Tutorials, 2007; avail for networking technology at Aalto University. He received his
able: https://doi.org/10.1109/COMST.2007.4444750 diploma and doctoral (Dr.-Ing.) degree in computer science
from TU Berlin (1991 and 1997, respectively), and his diploma
Biographies in industrial engineering from TFH Berlin (1995). His research
Trinh Viet Doan is a research assistant and Ph.D. student at interests are in network architecture, Internet protocol design,
the Chair of Connected Mobility at the Technical University and networked systems, with a focus on mobile decentralized
of Munich (TUM), Germany, from which he also received his services.
86 IEEE Communications Magazine • January 2019You can also read