TRADE AND POVERTY IN EU REGIONS - JOSÉ SIGNORET ALEN MULABDIC LUDMILA CIESZKOWSKY - World Bank Group
←
→
Page content transcription
If your browser does not render page correctly, please read the page content below
Public Disclosure Authorized Public Disclosure Authorized Public Disclosure Authorized Public Disclosure Authorized
REPAP GNIKROW

 An Empirical Analysis
 TRADE AND
 EU REGIONS
 POVERTY IN

JANUARY | 2020
 LUDMILA CIESZKOWSKY
 ALEN MULABDIC
 JOSÉ SIGNORET
© 2020 International Bank for Reconstruction and Development / The World Bank
1818 H Street NW
Washington DC 20433
Telephone: 202-473-1000
Internet: www.worldbank.org

This work is a product of the staff of The World Bank with external contributions. The findings,
interpretations, and conclusions expressed in this work do not necessarily reflect the views of
The World Bank, its Board of Executive Directors, or the governments they represent.

The World Bank does not guarantee the accuracy of the data included in this work. The
boundaries, colors, denominations, and other information shown on any map in this work do
not imply any judgment on the part of The World Bank concerning the legal status of any
territory or the endorsement or acceptance of such boundaries.
Table of Contents
Acknowledgements .......................................................................................................................... ii
Executive Summary ......................................................................................................................... 1
Introduction ..................................................................................................................................... 3
Trade and Poverty: A Review of the Literature ............................................................................... 4
 Trade and economic performance .............................................................................................. 4
 Firm-level evidence on trade and productivity ........................................................................... 6
 Effects on labor market outcomes .............................................................................................. 8
 Policy responses: The case of trade adjustment programs....................................................... 10
Trade and Poverty in EU Regions: A Regression Analysis.............................................................. 16
 Main data used .......................................................................................................................... 16
 Poverty estimates .................................................................................................................. 16
 Subnational trade data .......................................................................................................... 19
 Descriptive statistics .................................................................................................................. 22
 Cross-sectional analysis ............................................................................................................. 24
 Baseline ................................................................................................................................. 24
 Heterogenous effects ............................................................................................................ 27
 Panel data analysis .................................................................................................................... 30
Conclusions.................................................................................................................................... 32
Bibliography................................................................................................................................... 33
Annexes ......................................................................................................................................... 38
 Geospatial merge ...................................................................................................................... 38
 Regional openness to trade....................................................................................................... 39
 General correlation of trade openness by region ..................................................................... 40
 Alternate estimates by education level..................................................................................... 41
 Additional robustness................................................................................................................ 42
 Alternate correlations of poverty rates and openness to different lags on trade years .......... 43
 Summary of poverty estimates by aggregate NUTS.................................................................. 44
 Additional information on the EGF program............................................................................. 46
 Main criticisms....................................................................................................................... 47
 Discussion and proposal for 2021-2027 ................................................................................ 47

 i
Acknowledgements
This study was prepared by a team lead by José Signoret (Senior Economist, ETIRI) and comprising
Alen Mulabdic (Analyst) and Ludmila Cieszkowsky (Consultant). The team also acknowledges
comments and inputs provided by World Bank Group colleagues, including Reena Badiani-
Magnusson (Senior Economist, EECPV), Paul Brenton (Lead Economist, ETIRI), Alexandru Cojocaru
(Senior Economist, EPVGE), Paul Andres Corral Rodas (Data Scientist, EPVGE), Jakob Engel
(Economist, ETIRI), and Deeksha Kokas (E T Consultant, EPVGE). The team benefited from helpful
discussions with the staff at the Chief Economist and Trade Analysis Unit of the Directorate
General for Trade European Commission, including Lucian Cernat, Lars Nilsson, Nuno Sousa, and
Alessandra Tucci. The team acknowledges the support of the World Bank management team,
including Arup Banerji (Country Director, ECCEU), Emilia Skrok (Program Leader, EECDR), Rogier
van den Brink (Lead Economist, EMFDR), and Antonio Nucifora (Practice Manager, ETIRI),
throughout the process of preparation. This activity was funded by the Europe 2020
Programmatic Trust Fund financed with a grant from the European Commission

 ii
Executive Summary
This study investigates the relationship between international trade and poverty in the EU at the
regional level so to shed light on specific local impacts that can be masked by the country
aggregates.

By taking a closer look at EU regions, this study lowers the unit of analysis to more than 200
geographic subnational areas to focus on the links between trade and poverty outcomes. This
contributes to a growing body of literature that looks at the effects of a specific shock on localized
labor markets. This literature, however, has largely focused on the United States, on the so-called
“China shock”, on the import-side of trade, and on employment outcomes. A more
comprehensive analysis of poverty and trade in other developed countries and with a detail on
subnational effects, is largely missing.

Economic transformation brought about by trade can have different effects in the short, medium,
and long terms, especially in relation to poverty outcomes. Trade could have (direct) negative
effects on the poor in the short run as they typically have significantly lower labor mobility than
other workers. This means that adjustments to trade occur through changes in wages,
unemployment, and movement to informal sector rather than labor reallocation across firms,
industries, and geographical space. This is not accounted for in trade models that assume
instantaneous and free factor mobility across sectors. Evidence suggests that efficiency gains
accompanied by transition costs are prevalent enough to sustain regional or localized effects on
labor markets beyond the short term (that is, to the point that regional arbitrage of effects no
longer takes place).

Transitory effects of trade can be softened in the presence of socioeconomic safety nets that
facilitate transitions and mitigate their costs. While certain economic agents do not require any
help to enjoy the new opportunities created by trade, others may require assistance to benefit
(for example, transitioning into expanding activities). National governments and regional entities,
primarily in developed countries, have implemented assistance measures to deal with trade
adjustments. While useful, the evidence so far is that these programs remain seriously
underutilized.

This study builds on recent efforts by the World Bank and the European Commission in generating
detailed poverty estimates at detailed subnational levels (the EU Poverty Map). This information
is combined with estimates of subnational trade flow data for subnational regions between 2000-
2010, as well as information on country and regional characteristics. Poverty estimates from the
EU Poverty Map refers to a relative concept of poverty, measuring the share of population below
a country-specific low-income threshold. This notion of relative poverty can be informative of
disparities in welfare gains within countries often associated with trade, especially given the
current backlash on globalization from the perception that it may leave some segments of the
population behind.

 1
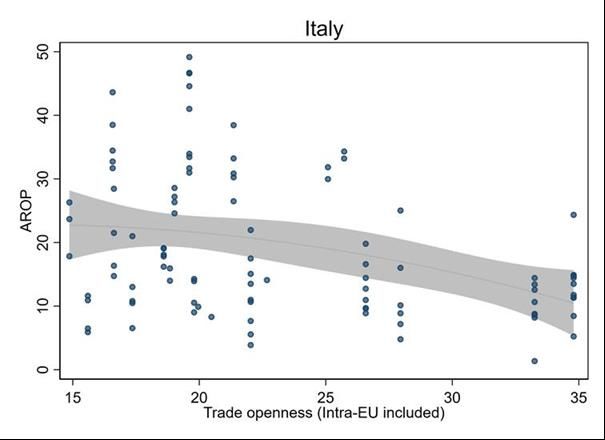
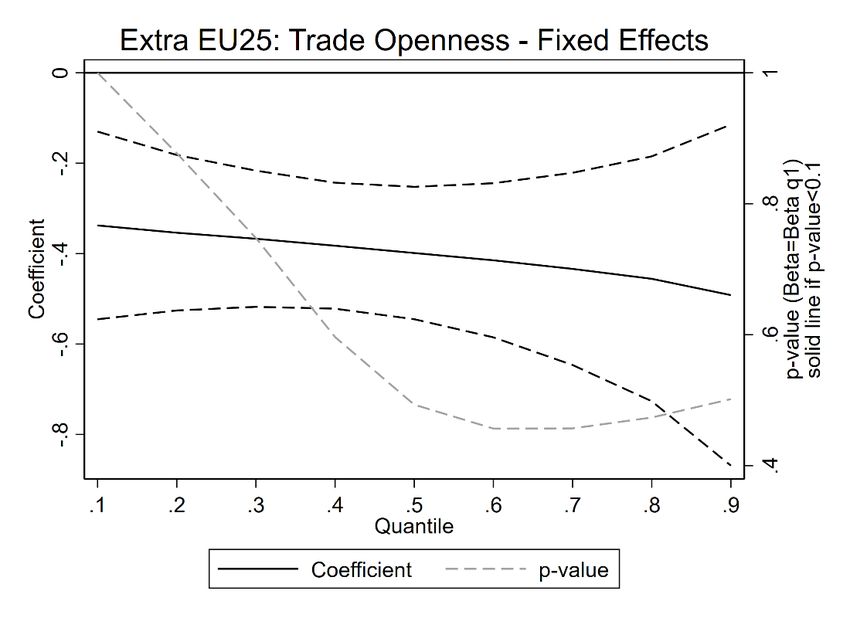
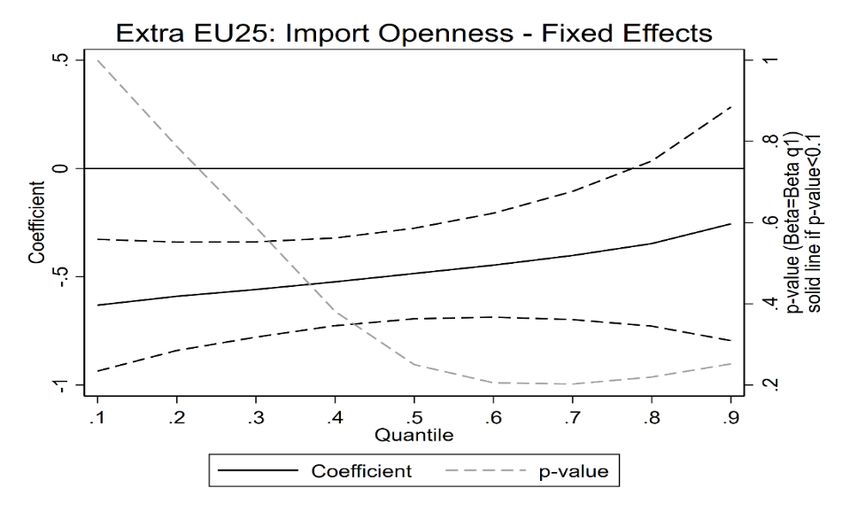
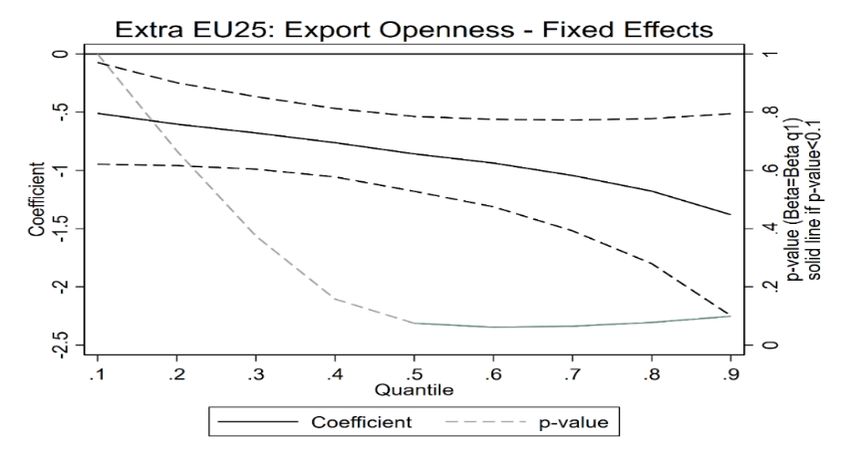
The results tend to confirm that regions more open to international trade have lower relative
poverty rates, suggesting that a one percentage point increase in trade with extra-EU countries is
associated with around 0.4 percentage points lower poverty rates. The negative relationship
between trade openness and poverty is roughly similar when estimated at different points of the
poverty rate distribution (i.e., from region with the lowest poverty rates to the highest poverty
rates).

The negative relationship between poverty and trade is observed when both import and export
openness are considered individually, but it arises more clearly in the case of export orientation.
Export orientation can be associated with lower levels of poverty particularly in the poorest
regions. The relationship between import exposure and poverty rates is not significant. Additional
analyses show that export openness is more strongly linked to lower poverty in regions where
production tends to be more “low-tech”. All together, these results suggest that both exports and
imports are associated to lower poverty, but especially when it relates to higher export
opportunities in poorer regions and where production is concentrated in relatively labor-intensive
goods. While this analysis does not consider micro-level effects such as at the enterprise or
household level that could possibly show greater heterogeneity, the results suggest that cross-
country estimates in the literature that show a positive effect of trade openness on economic
performance tend to hold at subnational regional levels in the EU.

Overall, this study shows that poverty and the relative concentrations of poor people in the EU is
an issue that policymakers should put high on the agenda. Opening markets and creating a more
level playing field in global markets for export opportunities is critical for regional development.
For certain regions however, policies to support the transition and the mitigation of transition
costs may be necessary. While the empirical evidence is still building up, whether this assistance
should be industry-based, versus locality based, is an important distinction, as trade shock effects
seems to matter more by locality than by industry.

 2
Introduction
This study aims to explore the nexus of trade and poverty in EU regions, of which little is known
to date. Recently, a growing body of literature that looks at the effects of a specific shock on
localized labor markets has emerged. The current literature focuses largely on the United States,
on the China shock, on the import side and on employment outcomes. An analysis of poverty and
trade in developed countries, with a detail to subnational effects including also exports, however,
is largely missing. The current analysis contributes to this area by looking at the relationship
between trade openness and poverty outcomes in EU regions. It exploits the recent efforts by the
World Bank and the European Commission in generating detailed poverty estimates at
subnational levels (EU Poverty Map), combined with estimates of trade flows by EU regions.

By looking at regions the study lowers the unit of analysis from the country level to geographic
subnational areas. These units (or NUTS) divide the EU into more than 200 regions (at NUTS2) or
more than 1,000 subregions (at NUTS3). With these data, this study conducts correlation analyses
of regional trade exposure and poverty status. Such correlations, however, cannot identify the
direction of causation. For this reason, the provided results are described as associations and
styled facts of interest. Empirical analyses attempting to control for the endogeneity of trade and
income at the country level have found a positive link between openness and economic
performance. Furthermore, these studies suggest that results from ordinary least-squares
estimates do not overstate the effects of trade on income, and that the association is robust to
treating trade as endogenous and instrumenting for potential endogeneity biases (Frankel and
Romer, 1999; Feyrer, 2019).

One main channel through which trade openness can affect economic performance is by
reallocation effects. This occurs when economic resources, such as labor and capital, are
reallocated from less productive to more productive firms, or even within firms, from less efficient
to more efficient productions, causing aggregate productivity to increase. Beyond reallocations,
there can be productivity gains by other efficiency channels related to trade openness, including
the role of intermediate inputs, knowledge spillovers, and trade-induced innovation. Evidence on
these effects on economic performance has been documented extensively over the last decade
using detailed firm-level data, where the focus has turned from the macro level to within country
effects of trade openness.

Trade, like technological change, may have labor market outcome effects along several
dimensions, such as employment and wages. This is important from a poverty perspective as, for
the poor, returns to labor are a primary source of wellbeing. In advanced economies, trade is likely
to increase the relative demand for high-skilled workers, especially in non-routine occupations.
This can lead to a skill premium in many ways similar to the one generated by skill-biased
technological change in labor markets independently of trade (e.g., advances in information
technologies). While this does not necessarily imply lower real income for unskilled workers—
since real consumption may still increase thanks to the new, lower prices—it can lead to a
divergence affecting the relative measures of poverty, as those used in the EU context. By many
accounts, however, trade adjustments are believed to be smaller than those induced by

 3
technological change. While estimates are still evolving, Acemoglu et al. (2016) found that, in the
case of the U.S., only 10-20 percent of jobs lost between 1999 and 2013 can be attributed to trade,
leaving most of the variation to be accounted by other explanations such as automation and
innovation. Similarly, Hicks and Devaraj (2017) found that only 13.4 percent of manufacturing jobs
lost in the U.S between 2000-2010 were due to direct imports and import substitution.

The remainder of this study will first review the extant literature on Trade and Poverty and also
present an overview of the policy responses to the issue of adjustment costs. It will then describe
the results of the regressions using regional trade and poverty data.

Trade and Poverty: A Review of the Literature
A comprehensive review of the literature on trade and poverty identified four main channels
through which trade can have an effect on poverty. Winter, McCulloch and McKay (2004) identify
income level and GDP growth, relative price changes, changes in employment outcomes
(employment and/or wages), and changes in government revenues as main channels. The latter,
government revenues, is of particular concern in developing countries where tariffs can be an
important source of revenue and therefore play a more central role in terms of redistribution and
provision of basic public goods. While this channel is likely to be less important for developed and
already relatively open economies, the other 3 avenues can still be relevant in terms of creating
efficiency gains, economic opportunities and increasing the purchasing power of the poor.

Regional disparities in the EU start with the fact that the EU comprises various diverse countries
so that cross-country evidence is still relevant to the question at hand, as well as possible
subnational differences. As such, important effects for differential outcomes in the EU at large
may well refer to country level disparities. Furthermore, the economic mechanisms for inter-
country disparities in the EU as they relate to trade are likely to be similar in nature to those
operating at a subnational level. Therefore, for an initial insight, this review turns to a well
establish literature on the linkages between trade and economic outcomes based on cross-
country evidence.

Trade and economic performance

An important strand of the literature on trade and higher wellbeing has examined the effects
of trade openness on economic growth. This body of literature, mostly based on cross-country
regressions, was summarized by Harrison and Rodríguez-Clare (2010). The empirical evidence on
the relationship between openness and growth in early studies was deemed relatively fragile.
While correlations between trade shares (X+M/GDP, as an empirical measure openness) and
growth are more robust, the relationship between trade policy measures per se (e.g., tariff levels)
and long-term growth can be weaker. The lack of good data on trade policies across countries and
over time, both on tariff and non-tariff measures, is arguably one of the major reasons behind this

 4
fragility (Harrison and Hanson, 1999). Other estimation concerns in this literature refer to possible
endogeneity biases, which the literature has attempted to control for in a number of ways.1

Empirical analyses attempting to control for the endogeneity of trade and income have found
a positive link between openness and economic performance. In a well cited article, Frankel and
Romer (1999) provide an examination of the causal link between trade openness and growth.
Their results, using geographic instruments, suggest that openness has a large positive effect on
income per capita with an elasticity with respect to trade of 1 or higher.

The effect of trade openness on growth can be enhanced or limited by existing regulation—thus
increasing or decreasing the gains from the opportunities created by trade. In terms of work on
institutions, other research show that certain policies can complement the link between trade
and economic outcomes. Bolaky and Freund (2004) examine the role of domestic regulations and
find that regulatory reform enhances the benefits of trade liberalization, both in levels and
changes. In highly regulated countries increased openness, if anything, would be associated with
lower living standards. Their reasoning is that excessive regulation can prevent resources from
moving into more efficient sectors (or firms within a sector) as well as encourage trade in goods
with no comparative advantage. Freund and Bolaky (2008) and Chang, Kaltani, and Loayza (2009)
show that the positive effect of trade on per capita income can be significantly enhanced if
complementary regulation reforms—especially those related to increasing labor market flexibility
and to easing firm entry and exit—are undertaken.2

Despite econometric and data concerns in earlier studies, most recent analyses and the balance
of the evidence in general suggest a positive relationship between trade openness and better
economic outcomes. More recent studies in the relationship between trade openness and
economic performance provide strong empirical support for a positive causal link. For example,
using panel data and geographic instruments that vary over time (by exploiting advances in
transport technology), Feyrer (2019) provides an identification strategy more robust than that of
earlier studies. He finds that trade is found to have a significant effect on countries’ income with
an elasticity of about one half, which is smaller than in previous cross-sectional analyses, but still
consistent with them, given standard errors. The results are robust to controlling for differential
growth rates across regions and initial industrial structure. A still unpublished paper by Irwin and
Feyrer (2019) finds that opening to trade can increase by 10-20 percent the GDP per capita of
closed economies.

1
 Two potential sources of bias relate to reverse causality (i.e., that trade reform may as well be determined
by income levels) and omitted variables (i.e., other determinants of growth that may correlate with
openness).
2
 Bolaky and Freund (2008), for example, use indices on labor and business entry regulations and property
rights obtained from the “Doing Business” database. The index of entry regulations is the number of
procedures it takes to start a business. The labor regulations index is an average of three indices covering
flexibility of hiring, conditions of employment, and flexibility of firing, which are based on an examination
of detailed provisions in the labor laws of each country. Property rights are measured as the number of
procedures involved in registering commercial property.

 5
Firm-level evidence on trade and productivity

One limitation of trade-growth estimates is that they do not specifically identify the different
channels through which openness to trade can affect growth. Inspired by theories of firm
heterogeneity and the increased availability of micro-level data, growing empirical literature at
the firm level is providing useful insights on these mechanisms. Such research provides strong
evidence on intra-country mechanisms for productivity enhancement as well as for reallocation
effects that can create transition effects.

One way that trade openness can affect productivity is by inducing shifts in resources from low-
to high-productivity firms, causing aggregate productivity to increase. Heterogeneous-firm trade
theory, such as the model in Melitz (2003), illustrates this “reallocation” result in which trade
liberalization can increase industry productivity as less productive firms are forced out and only
the more productive firms remain. In the Melitz model, firms differ in their productivity and each
firm produces a variety of a differentiated good. Fixed costs in production imply that firms with
productivity below a low (“domestic”) threshold cannot profitably produce in the domestic
market. In turn, trade costs imply that only firms with productivity above a higher (“export”)
threshold would export. Reductions in trade barriers abroad lower the export threshold, causing
existing exporters to expand because of higher profits, and allowing new firms to become
exporters. These expansions along the intensive and extensive margins raise wages and increase
the domestic threshold, thus prompting less productive firms to exit. Liberalization at home can
cause similar industry reallocations and productivity changes (Melitz and Ottaviano, 2008).
Increased import competition lowers domestic prices and profits, forcing less productive firms to
exit the market.

This prediction of trade openness on industry productivity has been confirmed in several
countries using firm-level data. Using manufacturing plant-level data for Chile from 1979 to 1986,
Pavcnik (2002) finds a 19 percent increase in total factor productivity (TFP) following liberalization.
Most of the improvement in manufacturing TFP resulted from the reallocation of resources and
market share from the less to more productive plants. Bernard, Jensen, and Schott (2006) obtain
similar results with U.S. census data from 1977 to 2001. They find that industries with relatively
high reductions in trade costs experienced relatively high gains in aggregate TFP because of the
reallocation of activity toward more productive plants within industries.

Beyond firm reallocations within industries, there can be productivity gains on the within-firm
product offering. Both Pavcnik and Bernard et al. find evidence of productivity gains from trade
liberalization at the firm level. This is a finding beyond the predictions of the Melitz model, where
firms receive productivity draws that do not change over time. This simplifying assumption has
been relaxed in more recent models of multi-product firms that respond to trade policy in terms
of their product scope and mix (Bernard, Redding, and Schott, 2011; Mayer, Melitz, and Ottaviano,
2014). These models lead to firm-level productivity gains from trade arising from reallocations
similar to those in the Melitz model, but along the firm’s product offering: firms reduce the
number of products they produce and skew production toward their better performing products.
Bernard et al. (2011) find support for this result from tariff changes in the context of the Canada-

 6
U.S. Free Trade Agreement, in that U.S. firms more exposed to tariff reductions lowered their
number of products relative to firms less exposed to tariff changes.

Several empirical papers have looked at other efficiency channels related to trade openness,
including the role of intermediate inputs, exporting, and innovation. An insight from trade
theory is that opening to trade expands the range of available varieties. Just as consumer’s utility
rises with increased product variety, firms that import intermediates can derive greater benefit
from increased input variety. Studies have looked at the effects of increased trade openness on
productivity due to cheaper intermediates and a wider range of input varieties. Kasahara and
Rodrigue (2008) examine whether importing intermediates improve plant performance using
Chilean manufacturing data. They find that, by switching from being a non-importer to an
importer of foreign intermediates, a plant can immediately improve productivity by 2.6–22
percent (with the range determined by the econometric estimator). A number of analyses using
firm-level data in developing countries also corroborate this prediction.3

By entering the export market, firms may gain new knowledge and expertise (“learning by
exporting”). While earlier studies found little evidence of learning by exporting (Clerides, Lach,
and Tybout, 1998), newer research tends to support this hypothesis. De Loecker (2007) finds that
Slovenian manufacturing firms during the years 1994–2000 increased their productivity
advantage after becoming exporters. De Loecker also finds that the productivity gains from
exporting are higher for firms selling to high-income markets, possibly supporting a “learning”
story.4

As for research on exporting and learning, there is a recent study on the connection between
exporting and the firms’ incentives to innovate. Using plant-level data from Taiwan, Aw, Roberts,
and Xu (2011) show empirically that there is a complex, dynamic interplay between exporting and
innovating. Their dynamic model of exporting and R&D shows that a firm’s decisions about
exporting affect its future investment in R&D (with higher rate of return under trade). In turn, a
firm’s decisions about R&D affect future propensity to export. These results suggest that a policy
change in one area, such as a reduction in trade barriers, would have effects on both activities,
with induced productivity feedbacks over time.

3
 Using manufacturing census data for Indonesia, including plant-level information on imported inputs,
Amiti and Konings (2007) examine the productivity gains that arise from reducing tariffs on final and
intermediate goods. They find large productivity gains from reductions of input tariffs (a 12 percent increase
in TFP from a 10 percentage-point decrease in tariffs). They also find that gains are at least twice as high as
the TFP gains from the competitive forces of reducing output tariffs. Topalova and Khandelwal (2011) find
similar results using Indian data in the context of the rapid and externally imposed trade reform in the early
1990s.
4
 Similar results are found for developing countries that show this “export learning” channel. Van
Biesebroeck (2005), in particular, provides evidence for manufacturing exporters in nine sub-Saharan
countries.

 7
Effects on labor market outcomes

Theoretically, it is suspected that trade openness can cause higher unemployment in the short-
and medium terms. Empirically, little was known about this until recently, except in the U.S.,
where there is evidence that import competition contributes to unemployment in exposed
industries (Goldberg and Pavcnik, 2004).5 In recent years, this stream of the literature on import
competition dominates the empirical literature, with a newer emphasis on localized effects.

In regions with high exposure to an “import shock” employment can be negatively affected.
Many studies that look at regional effects have concentrated in the exposure of different regions
to import competition. Hakobyan and Mclaren (2010) examine the effects of U.S. tariff reductions
induced by NAFTA on U.S. labor market (vis-à-vis Mexican products) and look at the different
levels of vulnerability by industry and geographic areas. This follows the empirical strategy by
Topalova (2010), which looks at the effects of trade openness in India in the early 1990s on the
poverty trends by Indian states.6 The study by Hakobyan and Mclaren finds that NAFTA
significantly lowered wage growth for blue-collar workers in the United States in industries most
exposed to NAFTA changes. They also document negative localized effects, although the
estimated effect of the agreement in terms of local wages was only modest.

Studies focusing on the potential effects of China’s rapid rise as a global exporter after its
accession to the WTO have generated considerable attention, given the attributable decline in
manufacturing jobs in advanced economies. Studies addressing the “China shock” have been
conducted for several countries, including the United States and certain European countries.
Among the works for the United States, Autor, Dorn, and Hanson (2013) find that rising imports
cause higher unemployment, lower labor force participation, and reduced wages in local labor
markets that house import-competing manufacturing industries. Their analysis suggests that this
sort of import competition could explain one-quarter of the aggregate decline in U.S.
manufacturing employment. However, they find no statistical evidence in a wage differential
across local labor markets and argue for the possibility of technological adoptions as a wage-
boosting reaction to trade pressures. The result, however, is still surprising.

Subsequent studies around this debate have provided additional insights noting that the
employment effects are likely to be modest, but still noticing the possible differential effects by
regions. Feenstra and Sasahara (2018) remarked that looking only at the import side misses
substantial employment demand increases from expanding export activities. Using global input-

5
 Similar insights were found by Trefler (2004) looking at the U.S.-Canada FTA agreement of 1989 on
Canadian manufacturing industries, by looking at firm-level data. He finds negative employment effects of
about 5 percent in the short term, while labor productivity in the longer term, likely from reallocations from
lower to higher productivity firms, increased by several times more.
6
 Topalova (2010) weights tariff changes by the employment shares in each industry to calculate a measure
of liberalization exposure by Indian states. She finds that Indian states with more rigid labor markets
experienced slower declines in poverty during trade liberalization of 1990s. There was very little labor
mobility and adjustment was through wages and prices. This result emphasizes the importance of factor
mobility and institutions that encourage it.

 8
output matrixes (WIOD data), they show that negative effects of import competition on US
employment are largely balanced out once the jobs effects of export expansion are taken into
account. In a subsequent work, Feenstra, Ma, and Xu (2019) use labor data by industry and
commuting zones and find that the net job effect of import and export exposure is roughly
balanced at the commuting zone level. Similarly, Caliendo, Dvorkin, and Parro (2019) develop a
general-equilibrium model with labor mobility frictions and distinct geographic labor market with
different exposure to trade. Calibrating this model to data that allows them to identify about
1,200 separate U.S. labor markets distinguished by sector and state, the authors show that the
early results of the “China shock” by reduced-form econometrics are largely exaggerated. Yet, the
model estimates confirm that, although the effect is significantly smaller than those of earlier
studies (about three-quarters smaller), given trade and migration frictions trade shocks can lead
to welfare and employment effects that vary across U.S. labor markets.

Similarly, in the European context, a few analyses have emerged that look at the labor outcome
of import shocks in localized markets, but the literature remains scant. Dauth, Findeisen, and
Suedekum (2014) examined both the German experience of the collapse of the Iron Curtain (and
the subsequent transformation of the former socialist countries into market economies of Eastern
Europe) and the later shock of the China rise. Using detailed administrative data, the authors find
that in regions where import-competing sectors are relatively important, manufacturing
employment declined due to trade increase.

The few empirical studies available show that there could be very different labor market effects
from even a common trade shock, so that more evidence is necessary to understand the
mechanisms at play. Dauth, Findeisen, and Suedekum also look at the effects of integration with
Eastern Europe and China on regions that are export-oriented, where integration with these
foreign markets led to expansions in employment so that aggregate manufacturing jobs increased
in Germany but not in the United States. Yet, the regions’ different exposure to trade and their
differentiated labor effects are a clear result of Dauth, Findeisen, and Suedekum. By looking at
subsamples of workers with different characteristics, they find that trade integration has no
differentiated effect in terms of age (below or above the median age) or gender. Low-skilled
workers, however, are more responsive to trade exposure when it comes to job churning across
plants and industries. Branstteter, Kovak, Mauro, and Venancio (2019) examined the China shock
using detailed firm-level data for Portugal. Their focus is not on local labor markets, but on firm
employment outcomes. They look at the rise of China in terms of direct competition in the
Portuguese market and indirect competition in five of Portugal’s largest export markets in
Western Europe. Firms that face a higher degree of indirect competition from China in export
markets in Europe experience significant employment declines. But the direct competition of
Chinese imports in Portugal had no significant effects. This shows the possible heterogeneity of
outcomes from a common shock in the EU where Portugal, with a relatively labor-intensive
manufacturing base, is likely to compete more directly with Chinese products in export markets.

Beyond employment effects, trade is likely to increase the relative demand for high-skilled
workers in advanced economies, thus influencing the relative measures of poverty. The higher

 9
relative demand for skilled workers would increase their relative wage, creating a skill premium.
This can lead to a divergence affecting relative measures of poverty.

There is evidence that trade could increase wage inequality, caused by the increased demand
for skilled workers (Helpman, Itskhoki, Muendler, and Redding, 2012). There are several reasons
why trade openness can increase the skill premium:

 • Unskilled labor-intensive sectors typically have the highest protection before reforms and
 experience the largest tariff reductions.7 In the Heckscher-Ohlin model this leads to these
 sectors experiencing the highest price declines, which in turn leads to falling relative
 wages of unskilled workers. This is a Rybczynski effect.
 • Trade may lead to skill-biased technological change (SBTC).8 There are several possible
 mechanisms through which trade can bring skilled-biased technological change,
 including: higher imports of machinery and equipment, which are complimentary to
 skilled labor (Acemoglu, 2003); more productive firms innovate in order to fight off
 foreign competitors and their innovations are skill-biased (Aghion, Burgess, Redding, and
 Zilibotti, 2008), and increases in exports are driven by firms that employ more skilled
 workers (Goldberg and Pavcnik, 2004).

Policy responses: The case of trade adjustment programs

Several countries have put in place socioeconomic safety nets to assist workers or firms
experiencing economic distress, in some cases specifically designed to assist with trade-induced
shocks. The first of such programs was the U.S. Trade Adjustment Assistance (TAA) program,
introduced by the Kennedy administration in 1962. Since then, the TAA has undergone several
reforms to adjust to changes. Other countries have followed suit enacting their own variants of
the TAA, some with more focus on firms, others on workers. They also differ in terms of trade-
specificity, rules of eligibility, allocated budget and, of course, different results. Most countries
readjust their program rules every few years as they learn from previous mistakes and/or keep
up with the market adjustments. For this review the focus is on the experience in the United
States, the EU, and South Korea.9

7
 This is the case for many countries, developed and developing countries alike, and more surprising for
developing countries, which could be described as abundant in unskilled labor.
8
 Skill-Biased Technological Change is a change in the production technology that favors skilled over
unskilled labor. The productivity of skilled labor and demand for it grow faster than the productivity and
demand for unskilled labor.
9
 Cutler and Bell (2018), distribute trade assistance programs in three categories. The first category refers
to countries such as the U.S. and the EU, which created programs specifically to assist firms and workers
negatively impacted by increases in trade. The second category refers to countries such as Japan and
Australia, which offer fixed-term assistance programs to firms and workers affected by various specific
economic shocks—trade-related events included. The third category, refers to countries with broader social
and welfare programs that treat workers made redundant by increased trade as any other worker, offering

 10
Relative to the U.S. program, the program for the EU and Korea are more recent. The European
Globalisation Adjustment Fund (EGF) became operational in 1 January 2007, concurrent with the
2007-2013 European Multiannual Financial Framework (MFF)—the seven-year programming
cycle of the EU budget. Four months later, South Korea’s Trade Assistance Program (KTAA) also
comes into effect. Korea’s first FTA signed with Chile in 2004 was not well received domestically,
therefore, in order to garner support for the much larger upcoming agreements that were being
negotiated with the US and the EU, it introduced the KTAA.

The late introduction of the EGF, relative to the TAA, could be attributed to other existing
welfare programs in Europe at the national and EU level. The EU Member States typically
maintain extensive welfare programs and the European Social Fund (ESF) also aims to facilitate
employment within the EU. However, the need for an EU-level program that specifically targeted
workers affected by the increase in imports grew more evident as it became clear that the scope
of the ESF was leaving out a rising number of unemployed workers. The ESF was designed to
provide assistance mainly for workers in relatively low-income regions, whereas globalization was
creating large-scale mass redundancies in regions that were actually experiencing economic
growth thanks to increased trade. The EGF was then created with the aim of “providing support
for workers made redundant as a result of major structural changes in world trade patterns due
to globalization”.

Since 2009 the EGF has been expanded to cover cases of both trade and financial crisis-related
unemployment. This support is not in the form of financial aid supplied directly to workers but
in the form of financial assistance for Member States to create personalized service packages
designed to reintegrate redundant workers into the labor force. In 2009, the EGF scope was
extended so that the measures created through its financing would also address the re-
employment of workers who lost their jobs due to the financial crisis.

Contrary to the U.S. TAA and the EU EGF, which focus on displaced workers, the Korean TAA
focuses on firms. The Korean TAA had, in its first iteration, two official objectives: to support firms
so that the industrial restructuring resulting from trade liberalization would lead to a new wave
of industrial development; and to create a “social infrastructure” so that anti-FTA groups would
change their stance. It was only in 2016—almost ten years into the program—that the KTAA was
expanded and began providing assistance to some workers, such as the former employees of firms
that were already designated TAA beneficiaries or a supplier thereof. 10

the same unemployment package to all. The programs in the United States, the EU, and South Korea belong
to the first category.
10
 As of 2016, to be eligible for KTAA benefits workers must meet all the following requirements: (1) they
must have been either laid off or have had a reduction in their working hours by 30 percent for an average
of two months when compared with the previous six months, including its possibilities; and (2) they must
be employed with a firm that is designated as TAA, a firm supplying goods to firm designated as TAA or a
firm [which] transferred its production facilities overseas due to an increase in imports as a result of
implemented FTAs. Song (2013), p. 98.

 11
All three programs considered have had several iterations since their implementation to
improve their utilization. The TAA and the KTAA, in particular, had serious initial challenges
before they began to meet their goals. In the U.S., from its inception in 1963 until 1969, not a
single worker or firm received assistance as none of the 18 filed applications were able to meet
the tough eligibility requirements11. It was not until the Trade Act of 1974 (which greatly relaxed
the eligibility rules) that the program finally took off. From virtually not used in the first ten years,
the number of certified workers jumped to nearly 600,000 in 1980.12 Korea had a similarly difficult
beginning. By 2011, that is, 5 years into the program, only 8 applications had been filed, of which
7 were approved. In addition to strict eligibility requirements, the Korean TAA also suffered from
lack of visibility. More than two years after the program’s inception, 64.5 percent of 2,000
surveyed respondents from 495 businesses affirmed they had “never heard of the KTAA
program.”13 Though the EGF rules are still being adjusted every few years (see Annex for more
details), it had by far the most successful start among the three programs: in its first 10 years it
received 147 applications and distributed funds to 20 Member States for the subsidization of
measures that covered 137,601 workers in 34 sectors.

Despite the occasional criticism that trade-assistance programs are underfunded, to this date
the total funds used yearly has been far below their annual caps, with the main reason for the
low use of funds in the three countries being the lack of beneficiaries. In the EU, for example,
where the annual allocated funds for the EGF were initially set at EUR 500 million per year (of
unused ESF funds), the total funds used in the 8-year period between 2007 and 2014 were EUR
542.4 million14 (that is, an average of EUR 67.8 million per year). Since the maximum amount of
EGF funds used in a single year was EUR 132 million in 2010, the budget for the 2014-20 cycle was
lowered from EUR 500 million to EUR 150 million per year. For the 2021-27 period the European
Commission proposed a maximum amount of EUR 1.578 billion, with an average of EUR 225
million per year.15 In terms of the co-funding shares, the EGF share was initially set at 50 percent,
with member states contributing the other half. During the financial crisis the EGF share rose to
65 percent until 2011 and has been kept at a maximum of 60 percent since 2014. The initial budget
allocated for the KTAA was 1.575 trillion won (US$1.324 billion at the time of writing), and further
5.8 trillion won (US$4.975 billion) were later added by the Department of Labor once the program
was extended to cover workers as well.16 As with the EGF, funds allocated were never fully used.
From 2008 to 2014, 21.854 billion won (about US$18.5 million) were provided as discounted loans
for firms and 806 billion won (US$682 million) in counseling/consulting hours. The current U.S.
TAA budget is $790 million per year, with unused funds returning to the treasury. In 2016, 126,844
workers became eligible to apply for TAA benefits and services, but only 45,814 (or 36.12 percent)

11
 Hornbeck (2012), p. 8.
12
 Collins (2018).
13
 Cheong and Cho (2011), p. 45.
14
 Reynolds (2016).
15
 European Commission (2019b), p. 30.
16
 Pyo, Wood, and Kim (2016), p. 219.

 12
received services amounting to a total of $626.8 million.17 The reasons for such low participation
in the United States are not fully clear, but D’Amico (2007) and Rosen (2008) cite two
explanations: 1) lack of awareness of the program and 2) the program’s conditioning the reception
of certain benefits to the participation in a training program, which they propose may discourage
workers who want to rejoin the labor market faster.

The exact reasons why programs are having difficulty reaching beneficiaries can vary but include
hard-to-meet eligibility criteria as well as lengthy or costly application processes. Other reason
may include lack of program visibility, alternative forms of support (such as unemployment
compensation, ESF, etc.), firm call-backs, and workers finding jobs on their own. One factor
commonly used as a requirement in trade-adjustment programs that is time-consuming and
difficult to meet is the need to demonstrate that a wage and/or hours reduction or job losses are
the result of a trade expansion. The EGF, having the most flexible requirements (especially going
forward), has proposed to eliminate this requirement for 2021-2027. Box 1 compares the
eligibility and application for these countries.

Additional information on the EGF is summarized in an annex.

17
 U.S. Department of Labor (2016), pp. 49-50.

 13
Box 1: Eligibility and application to trade assistance programs in selected countries
 In the US, in order to qualify for TAA benefits, a group of trade-affected workers must first submit a
 petition the Department of Labor (DOL), which then initiates an investigation to verify the role of
 increased foreign trade in the workers’ job losses. Only after the petition is certified by the DOL can
 covered workers apply for state-administered individual benefits.
 The application for TAA benefits in the US is a two-stage process. First, a group of trade-affected workers
 (or their representative, such as a firm, union or state) must submit a petition the Department of Labor
 (DOL), which then initiates an investigation to verify if the job losses were attributable to foreign trade
 (or to other factors). Only after the group has been certified by the DOL can individual workers under
 the petition apply for state-administered benefits at local American Job Centers (AJCs; also known as
 One-Stop Career Centers).18 There is no information on the DOL website regarding the maximum time
 allowed for the investigation, which may take months. The website mentions only that “petitions are
 investigated as quickly as possible, in the order in which they were received.” 19
 Korea’s most criticized initial eligibility criterion was the requirement that applying firms demonstrate a
 25 percent decline in sales or production as a result of the increase of imports from an FTA partner
 country, for a period of six months. Two private Korea consulting firms, in studies related to bankruptcy
 in 2007 and 2008, had shown that the average loss of sales in the months preceding a firm going bankrupt
 was 26 percent, and that a firm with a reduction of 25 percent in sales or production was very likely to
 go bankrupt.20 These findings sparked the criticism that, by the time Korean firms would finally become
 eligible to apply for and receive assistance, the KTAA would be what Cheong and Cho (2011) defined as
 “a prescription after death.” Firms would be so injured that they would probably be unlikely to be saved,
 and the KTAA aid would be money thrown away. The eligibility requirement was decreased to a 20
 percent reduction in 2011. As of the 2012 reform, a firm is eligible for KTAA assistance if it has
 experienced “more than a 10 percent reduction in sales or production, over the previous 6 months, as a
 direct result of drastically increased imports from FTA partner countries.” 21 It is important to note that
 the KTAA wording specifies the reduction in sales or production to be a direct result of an increase in
 imports from “FTA partner countries.” As such, Korean firms that are struggling as a result of a high level
 of imports from Brazil, for example, are not eligible for KTAA benefits because Brazil (or Mercosur) do
 not yet have a signed FTA with Korea.22 The KTAA 2012 reform also introduced assistance for affected
 firms in the form of counseling, for which a 5 percent reduction in sales or production suffices to meet
 the eligibility requirement. Firms must pay upfront 20 percent of the total estimated consulting costs
 and the KTAA covers the remaining 80 percent. Also in 2012, the assistance was extended to include
 coverage of sole-proprietors. As of 2016, former workers of KTAA-designated firms, as well as workers
 of firms that supply goods or services to KTAA-designated firms and workers of firms whose production
 facilities were relocated overseas are eligible for KTAA assistance—provided they demonstrate that their
 number of weekly working hours decreased a minimum of 30 percent in the past 2 months.
 Contrary to the U.S. TAA, which relies on the Economic Development Administration for verifying
 industries and markets’ financial health, the Korean TAA places on the applicant the burden of proving

18
 Collins (2018), p. 5.
19
 The United States Department of Labor website, accessed on 28 Nov, 2019.
https://www.doleta.gov/tradeact/petitioners/FAQ_Answers.cfm#G10
20
 Cheong and Cho (2011), p. 47.
21
 Pyo, Wood, and Kim (2016), p. 219-20.
22
 Heo (2013).

 14
the industry’s material injury due to a rise in imports from an FTA partner. After the first 4 years of
 virtually no success, Korean policymakers tried to streamline the application process in the 2012 reform.
 The number of required documents cropped from 4 to 2, and the Trade Adjustment Support Center
 started to offer document preparation support23. The most recent information found regarding the
 length of the application-decision process is from 2013 and at the time it was 3 months. The period of
 trade-related damage must not exceed 2 years, and firms have 5 years to implement a trade adjustment
 plan after certification.24
 In the EU, petitioners still need to demonstrate the cause of unemployment (at the time of writing). For
 the first two years (2007-08), applicants had to demonstrate that unemployment was caused by
 globalization.25 Since 2009, applicants must demonstrate that unemployment is the result of
 globalization or the financial and economic crisis. However, in response to strong criticism on the
 extremely long lag between application and transfer of funds, the proposal for 2021-2027 is to extend
 the scope of the fund to any type of crisis, thus eliminating the extremely time-consuming
 “demonstration” requirement. In the EU, for the 2014-20 spending period, the EGF scope was expanded
 to include formerly self-employed individuals. Additionally, EGF funds can now be used to co-finance
 services to young NEETS (Not in Employment, Education or Training) in eligible regions under the Youth
 Employment Initiative. Finally, since 2014 EGF funds can also be used to create measures that promote
 entrepreneurship.
 Application for EGF funds can be made by region employers or industry organizations through their
 national governments. One of the criticisms of the first iteration of the EGF was the long wait between
 application, approval and transfer of funds. The average approval period in the first cycle was 303 days
 (about 10 months), varying from 128 to 904 days. In response to this criticism, for the 2014-2020 cycle
 the Commission specified time-limits for every step of the application process as follows: Member States
 must submit an application to the EC within 12 weeks of the announcement of redundancies. The
 Commission then has 2 weeks to acknowledge receipt and request more information, if needed. The
 Member State will have 6 weeks (from the date of the request) to respond and, the Commission, in turn,
 will have 12 weeks to make a final determination. Finally, if approved by the EC, each case must be
 individually approved by the Council of the EU and the European Parliament, given that the EGF is not
 part of the MFF process.
 Source: Authors’ review of the literature.

23
 Pyo, Wood, and Kim (2016), p. 221.
24
 Heo (2013), pp. 4-5.
25
 For EGF purposes, “globalization” is defined as being a substantial increase in imports into the EU, a
serious shift in EU trade in goods of services, a rapid decline of the EU’s market share in a given sector, or
the offshoring of activities to non-EU countries.

 15
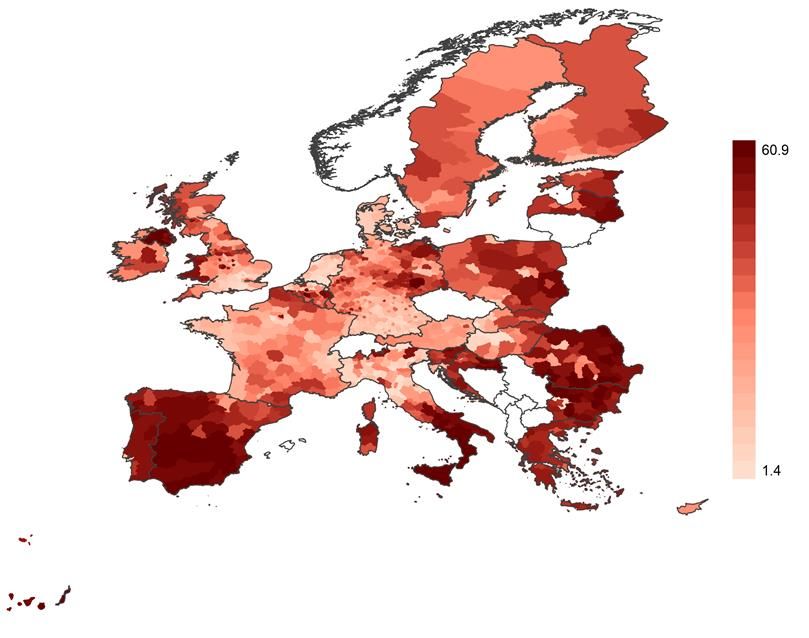
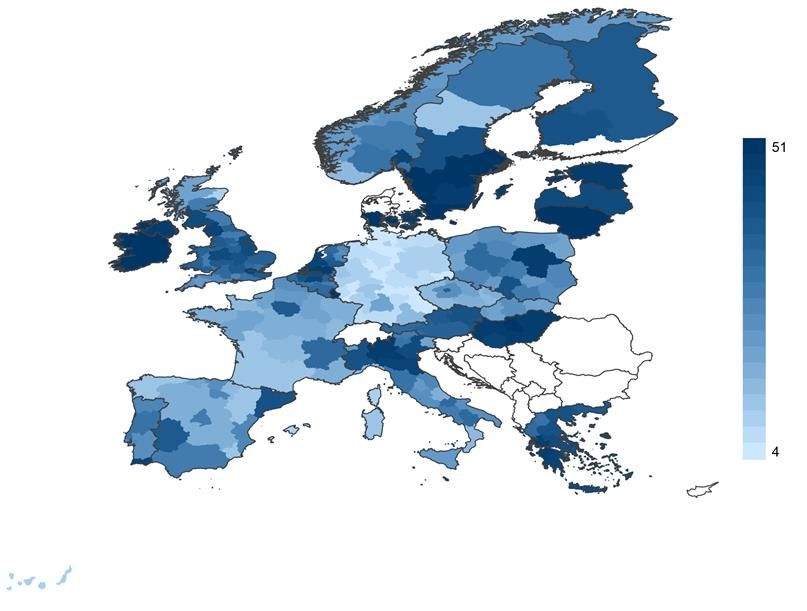
Trade and Poverty in EU Regions: A Regression Analysis
This section describes and uses the trade and poverty data at the regional level to investigate the
relationship between openness to trade and relative poverty rates in the EU regions using cross-
sectional and panel data analyses. The preferred econometric approaches in this section
incorporate country fixed effects that take into account different historical determinants at the
country level, as well as its facilitates the interpretation of poverty prediction in a context where
poverty definitions are country-specific. The section includes a textbox (Box 2) on the concept of
at-risk-of-poverty, which is the relative poverty measure widely use in the EU context.

Main data used

This section provides details on data sources and definitions of variables used in the empirical
analysis. To study the relationship between poverty and trade in EU regions, we combine data on
regional poverty rates at the NUTS 3 level with trade data for NUTS 2 regions as well as
information on country characteristics.

Poverty estimates

There are different ways to measure and define poverty, this study uses a relative measure of
poverty based on country specific thresholds. The indicator chosen for the analysis is a measure
of relative poverty.26 The at-risk-of-poverty rate captures the share of population with low income
in comparison to other residents in a country, which does not necessarily imply a low standard of
living as the severe material deprivation indicator.

According to the latest data from Eurostat, 16.9 percent of EU citizens are at risk of poverty in
2017.27 This study defines poverty in terms of share of population at risk of poverty after social
transfers. The data capture the share of people with an equivalized disposable income (after social

26
 In the context of the European Union, there are three more indicators of poverty and social exclusion.
The first indicator is about the exclusion from labor markets. It captures the number of people living in
households where over the previous year working-age adults worked less than 20 percent of their total
work potential (a working-age person is a person aged 18-59 years, with the exclusion of students in the
age group between 18 and 24 years). The second indicator, severe material deprivation, is an absolute
measure of poverty. People who suffer from severe material deprivation have living conditions that are
severely constrained by a lack of resources and cannot afford some items considered by most people to be
desirable or even necessary to lead an adequate life. The indicator considers individuals who experience at
least 3 out of the 9 following deprivations items. They cannot afford: i) to pay rent or utility bills; ii) keep
home adequately warm; iii) face unexpected expenses; iv) eat meat, fish or a protein equivalent every
second day; v) a week holiday away from home; vi) a car; vii) a washing machine; viii) a color TV; or ix) a
telephone. https://ec.europa.eu/eurostat/statistics-explained/index.php/Glossary:Material_deprivation.
The fourth indicator, at risk of poverty or social exclusion (AROPE), corresponds to the sum of persons who
are either at risk of poverty, or severely materially deprived or living in a household with a very low work
intensity (Persons are only counted once even if they are present in several sub-indicators.).
27
 Eurostat Data Explorer, (accessed on November 30, 2019). https://ec.europa.eu/eurostat/statistics-
explained/index.php/People_at_risk_of_poverty_or_social_exclusion.

 16
You can also read