Trans-Tasman comparison report on performance of selected broadband services
←
→
Page content transcription
If your browser does not render page correctly, please read the page content below

June 2022

Trans-Tasman comparison report on
performance of selected broadband services
In 2017, the Australian Competition and Consumer Commission (ACCC) launched its project to measure
internet performance. SamKnows was appointed to supply their Whiteboxes to internet users in Australia
to measure the performance of NBN fixed-line internet.

In 2018, the New Zealand Commerce Commission (NZCC) appointed SamKnows to measure New
Zealand’s internet performance as part of a programme called Measuring Broadband New Zealand.

This is the first joint report that aims to present performance data for selected comparable broadband
services offered in Australia and New Zealand. The findings presented in this report are derived from
data collected between 1st September and 30th September 2021.

                        Prepared by SamKnows | June 2022                                                 1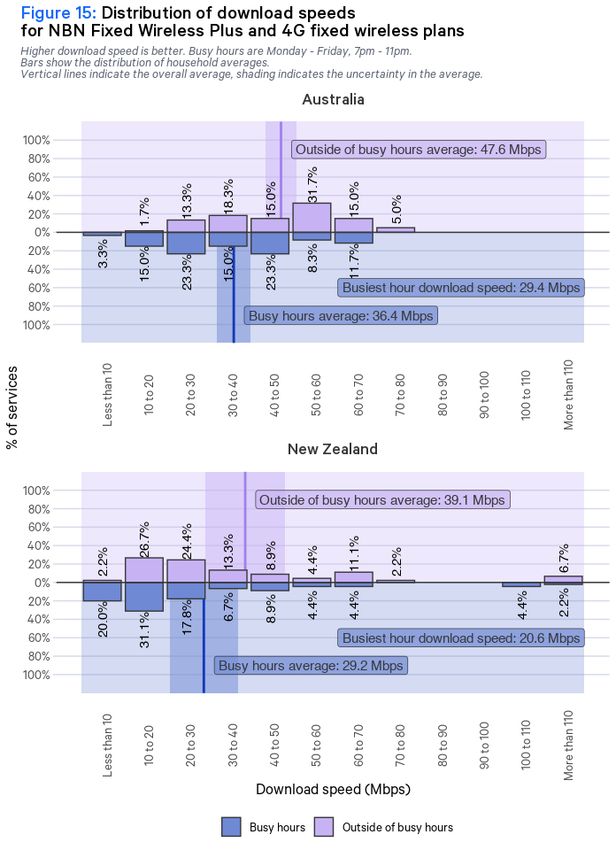
Contents

Overview ........................................................................................................................................................................................ 3

Key results .................................................................................................................................................................................... 6

Fixed-line 100/20 Mbps plans ........................................................................................................................................... 7

Very high speed fibre plans .............................................................................................................................................. 21

Fixed wireless plans .............................................................................................................................................................. 32

Data tables ................................................................................................................................................................................. 46

Glossary ....................................................................................................................................................................................... 48

                                          Prepared by SamKnows | June 2022                                                                                                                            2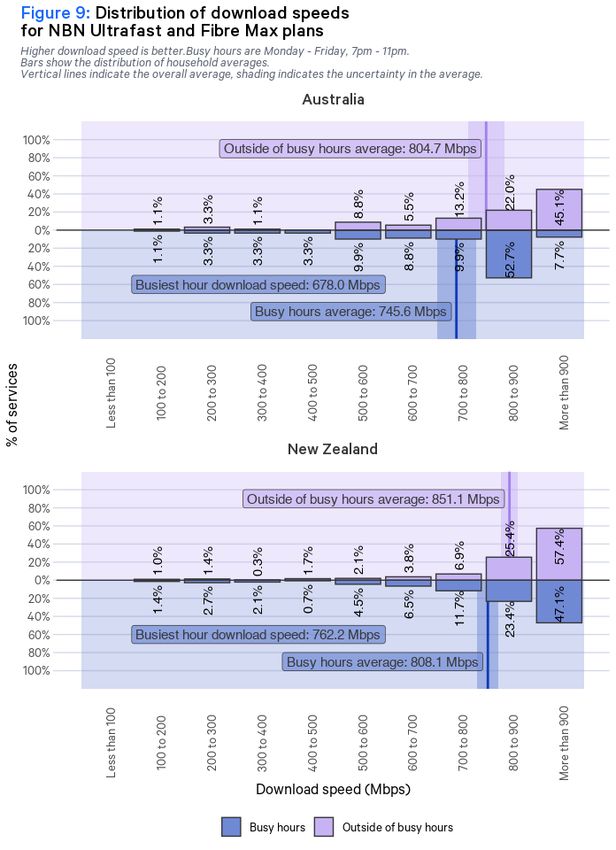
Overview
     The purpose of this report is to present performance data for three selected comparable broadband
     products between Australia and New Zealand in terms of broadband speed and access technology. This
     report analyses and compares measurement data recorded in the two countries during September 2021.

     The first type of product included in this report are 100/20 megabits per second (Mbps) fixed-line plans:
     Australia’s NBN 100/20 over fibre to the premises (FTTP) and hybrid fibre coaxial (HFC) connections and
     New Zealand’s Fibre 100 (offered over FTTP connections only).1

     The second type of product included in this report are very high speed plans: Australia’s NBN Ultrafast
     plan over FTTP and New Zealand’s Fibre Max plan, which are the fastest plans tested in both countries. It
     is noted that NBN Ultrafast plans are also available over HFC, whose New Zealand equivalent would be
     the HFC Max plan. However, cable coverage in New Zealand is limited to certain areas only2, and in
     September this service was subject to network performance issues. Because of this, a comparison of very
     high speed HFC plans is not included in this report.3

     The third type of product included in this report are fixed wireless plans: Australia’s NBN Fixed Wireless
     Plus plan, offered over NBN’s Fixed Wireless Access Services, and New Zealand’s fixed wireless plans
     offered over their 4G Fixed Wireless Access Service.

     In both Australia and New Zealand, broadband is also offered over copper (ADSL and VDSL), and fixed
     wireless broadband over 5G. These were not chosen to be compared in this report for a variety of
     reasons: some products differed in how they were offered in each country (‘best efforts’ vs speed tiers),
     were not within the scope of both countries’ programs, or the data collected in the September testing
     window was insufficient for a comparison.

1 While New Zealand has HFC available in some areas, there are no HFC plans in New Zealand that offer speeds of 100/20 Mbps. It is also noted that since September

2021, the majority of New Zealand services on the Fibre 100 plan have been upgraded to a 300/100 Mbps plan.
2 As at September 2021, areas where HFC is available are Wellington, Upper & Lower Hutt, the Kapiti Coast and parts of Christchurch.
3 Measuring Broadband New Zealand Spring Report 2021, https://comcom.govt.nz/__data/assets/pdf_file/0026/271961/MBNZ-Spring-Report-2021-01-December-

2021.pdf.

                                         Prepared by SamKnows | June 2022                                                                                            3
Market structure
Australia
     In Australia, the National Broadband Network (NBN) is a government initiative to upgrade Australia’s
     broadband infrastructure to provide consumers with fast broadband connections. NBN Co is responsible
     for building and maintaining the NBN.

     The current model for the NBN incorporates a variety of broadband technologies. As at September 2021,
     1.6 million premises were connected via NBN FTTP with 2.4% on Home Ultrafast, and 2 million premises
     were connected via NBN HFC. Around 18% of FTTP and HFC subscribers had download speeds of 100
     Mbps in September 2021. Fixed wireless technology served 373,000 premises. The remaining 4.4 million
     premises were connected via copper-based technologies.4 NBN Co is progressively offering consumers
     on copper-based technologies the option to upgrade to FTTP.5

New Zealand
     New Zealand’s Ultra-Fast Broadband (UFB) initiative is a New Zealand Government policy to provide New
     Zealand consumers with access to fibre broadband. The programme established several local fibre
     companies, of which Chorus is the largest.

     New Zealand consumers have the choice of fibre, fixed wireless, HFC or copper-based connections
     (ADSL & VDSL), with the number of copper connections declining rapidly. Following the extension of the
     UFB programme, more than 1.8 million households and businesses, or 87% of New Zealanders should have
     the ability to connect to fibre by the end of 2022.6 As at 30 September 2021, 1,180,766 households and
     businesses were connected to fibre, with 67% of those on 100 Mbps connections, and 19% on Fibre Max
     connections.7

     As at 30 September 2021, 308,000, or 17% of New Zealand premises were connected to the internet via
     copper technologies and 276,493, or 15% of New Zealand premises were connected to fixed wireless.

4 ACCC NBN Wholesale market indicators report, September 2021, available at: https://www.accc.gov.au/regulated-infrastructure/communications/national-broadband-

network-nbn/nbn-wholesale-market-indicators-report/september-quarter-2021-report.
5 NBN Co media release: https://www.nbnco.com.au/corporate-information/media-centre/media-statements/nbn-co-offers-further-fibre-upgrades-as-part-of-four-and-

half-billion-plan
6 Commerce Commission New Zealand, Annual Telecommunications Monitoring Report 2021, 17 March 2022, available at:

https://comcom.govt.nz/__data/assets/pdf_file/0019/279100/2021-Annual-Telecommunications-Monitoring-Report-17-March-2022.pdf, page 5.
7 Crown Infrastructure Partners, Connectivity Quarterly Update September, available at: https://www.crowninfrastructure.govt.nz/wp-content/uploads/CIP-Connectivity-

Quarterly-Update-September-2021_FINAL.pdf.

                                        Prepared by SamKnows | June 2022                                                                                               4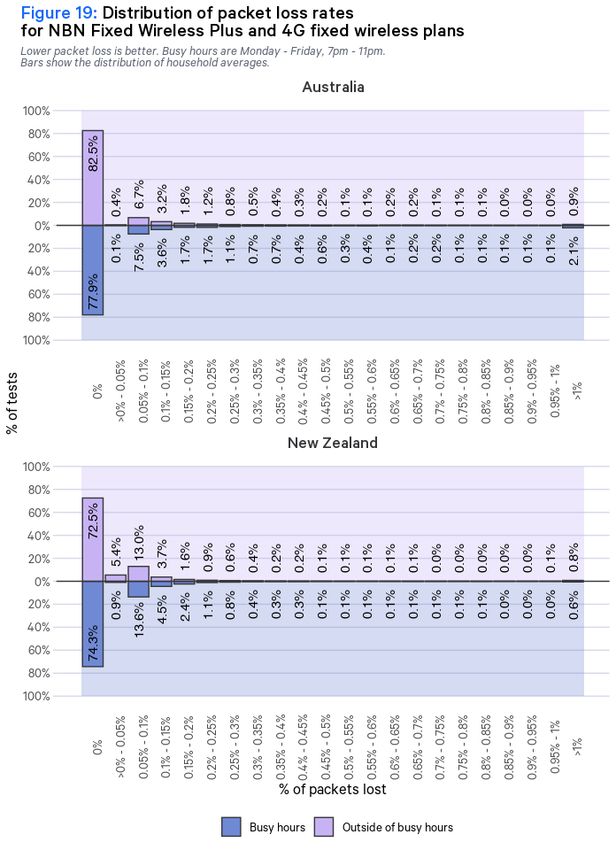
Metrics used in this report
This report compares New Zealand and Australia across a number of metrics. A summary of what these
metrics are and how they are calculated is provided in the table below.

         Test                                                  Definition

                     The speed at which data can be transferred from the SamKnows test server to your
   Download
                     computer, measured in megabits per second (Mbps).

                     The speed at which information is transferred from your computer to the SamKnows test
   Upload
                     server, measured in megabits per second (Mbps).

                     How long it takes a data packet to go from your device to our test server and back to your
   Latency
                     device, measured in milliseconds (ms). The shorter the latency, the better.

                     Packet loss counts packets that are sent over a network and don’t make it to their
   Packet loss
                     destination, measured as a percentage of packets lost out of all packets sent.

                     The outages metric tracks how many times per day your broadband connection goes offline
   Outages           for at least 30 seconds. Outages between 12am and 5am are excluded from this metric as
                     this is when network maintenance typically occurs.

   Video             Measures the highest bitrate (in Mbps), and therefore quality level, you can reliably stream
   streaming         from real content servers.

                        Prepared by SamKnows | June 2022                                                            5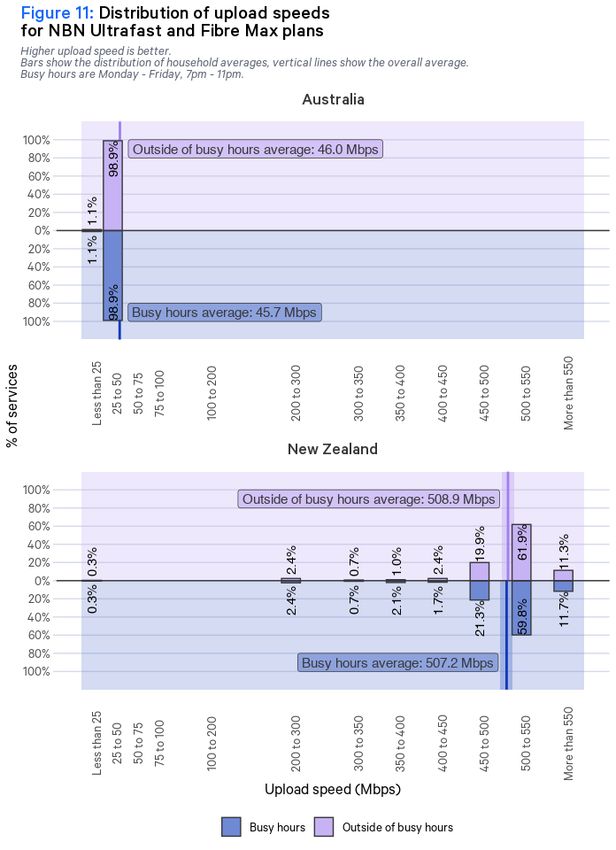
Key results8
       Fixed-line 100/20 Mbps plans
       Australian NBN 100/20 Mbps plans over FTTP + HFC compared to NZ Fibre 100/20 Mbps plans.

       Very high speed fibre plans
       Australian NBN Ultrafast over FTTP compared to NZ Fibre Max plans.

       Fixed wireless plans
       Australian NBN Fixed Wireless plus over 4G compared to NZ Fixed Wireless over 4G.

8   Download and upload speeds measured during busy hours (7pm-11pm Monday-Friday), outage rates measured during all hours.

                                          Prepared by SamKnows | June 2022                                                    6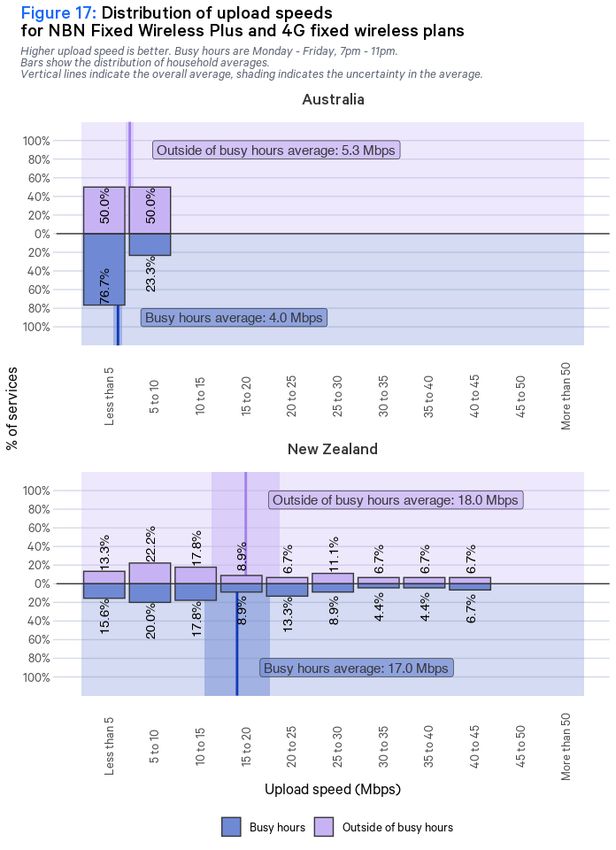
Fixed-line 100/20 Mbps plans
     In this section we compare the performance of two 100/20 Mbps plans: the Fibre 100 plan of New
     Zealand and the NBN 100/20 plan of Australia over FTTP and HFC connections. As noted above, there is
     not a 100 Mbps HFC service in New Zealand, so it was not chosen for this comparison.

     It is important to note that although these services are each specified with a download speed of 100
     Mbps, over-provisioning the downlink is permitted in each of Australia and New Zealand. This practice
     recognises that a certain proportion of a customer’s plan speed is given over to protocol overhead, which
     is key to ensuring that communications are delivered to the right place. The overprovisioning of the
     download and the upload component means that consumers can more reliably experience speeds that
     are closer to the maximum set download speed of their chosen retail plan speed. Although 100/20 plans
     are overprovisioned in both countries, the level of overprovisioning is different. Australia’s NBN Co
     overprovisions the downlink by 10-15%, meaning that the theoretically attainable maximum download
     speed is 115 Mbps in Australia. However, NBN Co does not overprovision the uplink. In contrast, while
     New Zealand’s services are generally overprovisioned on both the downlink and the uplink, the amount of
     overprovisioning is up to the individual RSPs rather than a fixed percentage as is done in Australia.

     Download speeds
     Figure 1 compares the download speeds attained by services on Australia’s NBN 100/20 plans (over
     FTTP and HFC connections) and New Zealand’s Fibre 100 plans.

     Data collected during busy hours (defined as 7-11 pm on Monday-Friday in both countries) and outside of
     busy hours is presented separately.

     Figure 1 also includes the “busiest hour” download speed for both plans. This metric aims to capture the
     extent to which performance is affected when the network is under the highest levels of stress, and is
     calculated as the fifth-lowest hourly average download speed across busy hours in September 2021.

     Figure 2 shows the smoothed hourly download speeds averaged across the month for every hour when
     measurements are scheduled.9 Missing data points indicate that measurements are not scheduled to take
     place in that hour.

9 In Australia, download tests are scheduled to take place once every 6 hours between midnight and 6pm, and hourly between 6pm and midnight. In New Zealand,

download tests are scheduled to take place once every 6 hours between midnight and 6pm, and hourly between 7pm and 11 pm - thus there are no download tests
scheduled to take place between 6pm-7pm and 11pm-midnight in New Zealand.

                                        Prepared by SamKnows | June 2022                                                                                       7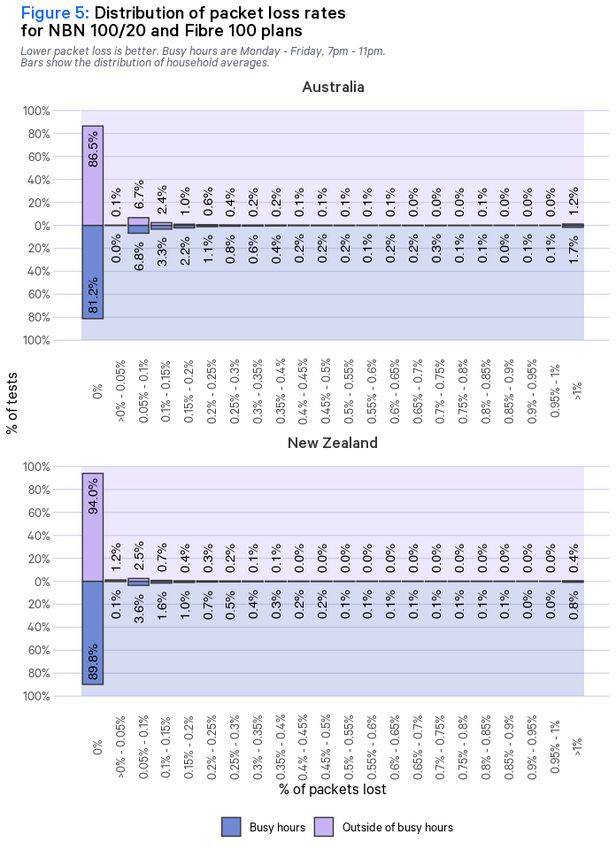
Figure 1:

            Prepared by SamKnows | June 2022   8
Figure 2:

             Key observations
   •        Comparing Australia’s NBN 100/20 Mbps plans supplied over FTTP and HFC to New Zealand’s Fibre 100 plan, average
            download speeds are similar (see Figure 1).

   •        Despite the higher level of overprovisioning in Australia for download speeds (15% against New Zealand’s approximately
            10%), the percentage of households attaining average download speeds above 100 Mbps is higher in New Zealand than
            in Australia both during and outside of busy hours (see Figure 1).

   •        The hourly results for both countries show a decrease during 7pm - 11pm (see Figure 2). This decrease is driven by the
            increased traffic during busy hours (7pm - 11pm on Monday Friday).

   •        The busiest hour download speed (quoted in Figure 1) in both countries is slightly lower than the average download
            speed during busy hours. This indicates that there were periods of higher-than-usual demand in both countries that had
            a small effect on download performance.

   •        The lowest speeds are measured during 8pm - 9pm in both countries (see Figure 2). The NBN 100/20 plan shows a
            greater variation in download speeds during the day than Fibre 100.

Upload speeds
Figure 3 compares the upload speeds attained by services on Australia’s NBN 100/20 plans (over FTTP
and HFC connections) and New Zealand’s Fibre 100 plans.

Data collected during busy hours and outside of busy hours is presented separately.

                                   Prepared by SamKnows | June 2022                                                                  9
Figure 3:

            Prepared by SamKnows | June 2022   10
Key observations
• Australia’s NBN 100/20 Mbps plans are not overprovisioned on the uplink. As a result, the measured average upload
speeds remain under 20 Mbps. In contrast, almost all households on New Zealand’s Fibre 100 attain average upload
speeds that exceed the nominal 20 Mbps due to overprovisioning on the uplink.
Latency
Average round trip latency is the average time required to send a packet of data to the test server and
back. Lower latency will result in more responsive behaviour from real-time applications such as video
conferencing and online gaming.
Figure 4 compares round trip latencies of Australia’s NBN 100/20 plans (over FTTP and HFC
connections) and New Zealand’s Fibre 100 plans.
Data collected during busy hours and outside of busy hours is presented separately.
Prepared by SamKnows | June 2022 11Figure 4:
Prepared by SamKnows | June 2022 12Key observations
• Around 95% of NBN 100/20 and Fibre 100 services experience latency of 20 ms and under, both during and outside of
busy hours. Latency at this level provides very good support for the normal operation of most end-user applications.
• That said, Fibre 100 had a lower average latency than NBN 100/20, and latency increased more during busy hours on
NBN 100/20 than on Fibre 100.
Packet loss
Packet loss measures the percentage of packets that were lost somewhere between the router and the
test server, often due to network congestion. Packet loss is expressed as a percentage of all packets
sent.
Figure 5 compares the distribution of average household packet loss rates for Australia’s NBN 100/20
plans (over FTTP and HFC connections) and New Zealand’s Fibre 100 plans.
Data collected during busy hours and outside of busy hours is presented separately.
Prepared by SamKnows | June 2022 13Figure 5:
Prepared by SamKnows | June 2022 14Key observations
• The proportion of households having an average rate of packet loss above 1% is higher in Australia. At this level of
packet loss, some end-user applications will not run as intended.
• The proportion of households having an average rate of packet loss above 1% increases during busy hours in both
countries.
Outages
The impact of outages on the consumer depends on both the frequency of outages as well as the
duration of outages. For example, a less regular outage but one that lasts more than 10 minutes may be
more disruptive to a consumer than outages that occur slightly more often but are less than a minute in
length. How disruptive outages are will depend on the consumer, how they use their home broadband
connection and the time of day that the outage occurs.
The following chart shows the weekly rate of outages. An “outage” in this context is any disconnection
lasting longer than 30 seconds that happens between 5am and midnight.10 The number of such outages
suffered by services during the reporting period is then divided by the number of days on which the
Whitebox would have been able to report the occurrence of disconnections to get an average daily rate
of outages. Because the average daily rate of outages is quite low in both countries, the charts show the
weekly rate of outages (the average daily outages multiplied by 7). The overall averages noted in the
figures are trimmed averages to account for the presence of outliers.
Figure 6 compares the distribution of outage frequencies for Australia’s NBN 100/20 plans (over FTTP
and HFC connections) and New Zealand’s Fibre 100 plans.11
Data is shown for all hours.
10 It is assumed that outages shorter than 30 seconds have a less significant impact on the consumer. Data from the midnight-5am period is excluded because this is
typically when network maintenance takes place to cause minimal disruption to the consumer.
11 It is noted that while this report uses the same dataset as was used for the Measuring Broadband Australia Report 15 and the Measuring Broadband New Zealand
Spring Report 2021, outage rates are presented slightly differently in the two reports. Similarly to the Australia Report, this chart only includes outages lasting longer
than 30 seconds.
Prepared by SamKnows | June 2022 15Figure 6:
Prepared by SamKnows | June 2022 16Key observations
• When comparing New Zealand’s Fibre 100 plans to Australia’s NBN 100/20 Mbps plans over FTTP and HFC, the rate of
outages was found to be very low in both countries. At an average rate of one or fewer outages per week, outages are
unlikely to have an impact on user experience, although it is worth noting that in both countries a few services
experience considerably higher rates of outages at more than one outage per day.
Streaming services
Another key part of the consumer’s broadband experience is the quality of experience when using
streaming services. Specific tests were run to two major content providers, Netflix and YouTube. Figures
7 and 8 show the results of these tests for Australia’s NBN 100/20 plans (over FTTP and HFC
connections) and New Zealand’s Fibre 100 plans.
Figure 7 shows the proportion of NBN services on the main NBN plans which would be able to reliably
stream (without stopping and starting) a varying number of videos from Netflix simultaneously. A High
Definition video stream from Netflix would take up around 2.2 Mbps data rate on average. An Ultra High
Definition (4K) video stream would take up 12 Mbps on average. The actual data rate will vary during
video streaming: for example Netflix would use a higher data rate during a fast-paced action scene. It will
also depend on Netflix‘s user traffic at a given time. The Whitebox measures the total downstream data
rate available from Netflix’s servers, and so using multiples of 2.2 Mbps (for High Definition) and 12 Mbps
(for Ultra High Definition) allows us to infer whether a service would be able to handle different numbers
of streams. This assumes no other use of the connection at the time i.e. that Netflix is the only application
running.
Figure 8 shows the proportion of content available in UHD quality from YouTube. The test for YouTube is
similar to the Netflix test. Since YouTube caps the data rate at which it serves video, test results could
not be used to infer whether a service would be able to handle multiple concurrent streams.
Nevertheless, nearly all tests from all NBN plans were able to stream YouTube reliably in Ultra High
Definition. Figure 9 shows the proportion of YouTube content that could be streamed in Ultra High
Definition for the 100/20 plans.
Data is shown for all hours.
Prepared by SamKnows | June 2022 17Figure 7:
Prepared by SamKnows | June 2022 18Figure 8:
Prepared by SamKnows | June 2022 19Key observations
• Almost all services on 100/20 Mbps plans can support more than 4 concurrent Ultra High Definition Netflix streams,
with the median values being 7 concurrent UHD streams for Australia and 8 concurrent UHD streams for New Zealand.
• All services on Australia and New Zealand’s 100/20 Mbps plans support streaming 90% or more of YouTube’s content
in UHD.
• In conclusion, 100/20 Mbps fixed-line plans offer good streaming quality in both countries (although the overall user
experience may be limited by other factors).
Prepared by SamKnows | June 2022 20Very high speed fibre plans
In this section we compare the performance of very high speed plans over a FTTP connection. Australia’s
NBN Ultrafast plan is advertised as having a download/upload speed range of 500-990/50 Mbps. New
Zealand’s Fibre Max plans are sold under different advertised speed claims of 900/400 Mbps, 900/450
Mbps, 950/450 Mbps and 950/500 Mbps.
Similar plans also exist over HFC connection in both countries under NBN Ultrafast in Australia and HFC
Max in New Zealand. However, the HFC Max plan is only available in certain areas of New Zealand, and so
these plans are not compared in this report.
Download speeds
Figure 9 compares the download speeds attained by services on Australia’s NBN Ultrafast plans over
FTTP and New Zealand’s Fibre Max plans.
The data presented includes data for busy hours and outside of busy hours. Figure 9 also shows the
“busiest hour” download speed for both plans.
Figure 10 shows the smoothed hourly download speeds averaged across the month for every hour when
measurements are scheduled. Missing data points indicate that measurements are not scheduled to take
place in that hour.
Prepared by SamKnows | June 2022 21Figure 9:
Prepared by SamKnows | June 2022 22Figure 10:
Key observations
• The proportion of services attaining an average download speed over 900 Mbps is greater for Fibre Max, particularly
during busy hours (see Figure 9).
• The difference between average download speeds during busy hours and outside of busy hours is greater for NBN
Ultrafast. Similarly, the download speed during the busiest hour drops even more significantly for NBN Ultrafast. This
indicates that services on the NBN Ultrafast plan were more affected by the increased traffic during busy periods than
services on the Fibre Max plan.
• The hourly results for both countries show a decrease during 7pm - 11pm (see Figure 10). This decrease is driven by the
increased traffic during busy hours (7pm - 11pm on Monday Friday).
• The lowest speeds are measured during 8pm - 9pm in both countries. The drop in download speed is greater for the
NBN Ultrafast plan.
Upload speeds
Figure 11 compares the upload speeds attained by services on Australia’s NBN Ultrafast plans over FTTP
and New Zealand’s Fibre Max plans.
Data collected during busy hours and outside of busy hours is presented separately.
Prepared by SamKnows | June 2022 23Figure 11:
Prepared by SamKnows | June 2022 24Key observations
• The average upload speeds measured are very different in the two countries, with 50 Mbps being offered in Australia
and 400-500 Mbps in New Zealand. This is largely in line with the plan speeds.
• Average upload speeds in Australia do not exceed the plan speed of 50 Mbps, but average upload speeds in New
Zealand are often higher than advertised.
• As with the 100/20 plans, upload speeds are less affected by busy hours.
Latency
Figure 12 compares the average latency of services on Australia’s NBN Ultrafast plans over FTTP and
New Zealand’s Fibre Max plans.
Data collected during busy hours and outside of busy hours is presented separately.
Prepared by SamKnows | June 2022 25Figure 12:
Prepared by SamKnows | June 2022 26Key observations
• More than 95% of NBN Ultrafast and Fibre Max services experience latency of 20 ms and under, both during and
outside of busy hours. Latency at this level provides very good support for the normal operation of most end-user
applications.
• Fibre Max and NBN Ultrafast had similar average latencies outside of busy hours, but the increase in average latency
during busy hours was slightly higher for NBN Ultrafast.
Packet loss
Figure 13 compares the distribution of average household packet loss rates for Australia’s NBN Ultrafast
plans over FTTP and New Zealand’s Fibre Max plans.
Data collected during busy hours and outside of busy hours is presented separately.
Prepared by SamKnows | June 2022 27Figure 13:
Prepared by SamKnows | June 2022 28Key observations
• The proportion of households experiencing an average rate of packet loss above 1% is relatively small outside of busy
hours, but increases during busy hours in both countries.
Outages
Figure 14 compares the frequency of outages experienced by services on Australia’s NBN Ultrafast plans
over FTTP and New Zealand’s Fibre Max plans.
Data is shown for all hours.
Prepared by SamKnows | June 2022 29Figure 14:
Prepared by SamKnows | June 2022 30Key observations
• The rate of outages lasting longer than 30 seconds was found to be low in both countries. At an average rate of about
one outage lasting longer than 30 seconds per week, outages are unlikely to have an impact on user experience.
• It is worth noting that while the overall average rate of outages is very low, there are a few services in each country that
experience a considerably higher rate of outages at one or more outages per day.
Streaming services
Similarly to the 100/20 Mbps fixed-line plans, the quality of experience when using streaming services
such as Netflix or YouTube over Australia’s NBN Ultrafast plans or New Zealand’s Fibre Max plans would
not be limited by the connection itself. Both plans are able to support a high number of concurrent UHD
streams from Netflix on average, and almost all YouTube content is available in UHD for almost all
services on these plans. For the sake of brevity, figures corresponding to these results are not included in
this report.
Prepared by SamKnows | June 2022 31Fixed wireless plans
In this section we compare the performance of Australia’s NBN Fixed Wireless Plus plan with New
Zealand’s 4G fixed wireless product. The fixed wireless networks of the two countries utilise similar
technologies, but the products are marketed differently in the two countries. The download and upload
speed of the NBN Fixed Wireless plan is provided on a “best effort” basis but is benchmarked at 50/10
Mbps. New Zealand’s 4G fixed wireless plans are provided on a “best effort” basis for both the download
and the upload. The best available speeds can vary between services and at different times of the day.
Download speeds
Figure 15 compares the download speeds attained by fixed wireless services in Australia and New
Zealand (4G only).
Data collected during busy hours and outside of busy hours is presented separately. Figure 15 also shows
the “busiest hour” download speed for both plans.
Figure 16 shows the smoothed hourly download speeds averaged across the month for every hour when
measurements are scheduled. Missing data points indicate that measurements are not scheduled to take
place in that hour.
Prepared by SamKnows | June 2022 32Figure 15:
Prepared by SamKnows | June 2022 33Figure 16:
Key observations
• Average download speeds over fixed wireless are higher in Australia both during busy hours and outside of busy hours.
• The busiest hour download speed in both countries is lower than the average download speed during busy hours. This
indicates that periods of high demand affected the download performance in both countries.
• The hourly results for both countries show a gradual decrease during the day, reaching the lowest performance around
7pm-8pm in New Zealand and 8pm-9pm in Australia. The drop in download speed during the evening hours is
significant in both countries.
Upload speeds
Figure 17 compares the upload speeds attained by attained by fixed wireless services in Australia and
New Zealand (4G only).
Data collected during busy hours and outside of busy hours is presented separately.
Prepared by SamKnows | June 2022 34Figure 17:
Prepared by SamKnows | June 2022 35Key observations
• The majority of New Zealand’s fixed wireless services achieve a higher upload speed than Australia’s NBN Fixed
Wireless Plus.
Latency
Figure 18 compares the average latency attained by fixed wireless services in Australia and New Zealand
(4G only).
Data collected during busy hours and outside of busy hours is presented separately.
Prepared by SamKnows | June 2022 36Figure 18:
Prepared by SamKnows | June 2022 37Key observations
• Fixed wireless services typically have higher latencies than fixed-line services. Latency over fixed wireless often falls in
the 40-50 ms range, which may impact end users using latency-sensitive applications (for example, video
conferencing).
• Australia’s Fixed Wireless Plus services appear to have a slightly lower latency than New Zealand’s 4G fixed wireless
services. The proportion of services having an average latency of 60 ms or more is considerably higher in New Zealand.
Packet loss
Figure 19 compares the distribution of average household packet loss rates for fixed wireless services in
Australia and New Zealand (4G only).
Data collected during busy hours and outside of busy hours is presented separately.
Prepared by SamKnows | June 2022 38Figure 19:
Prepared by SamKnows | June 2022 39Outages
Figure 20 compares the frequency of outages experienced by fixed wireless services in Australia and
New Zealand (4G only).
Data is shown for all hours.
Prepared by SamKnows | June 2022 40Figure 20:
Prepared by SamKnows | June 2022 41Key observations
• The overall rate of outages over fixed wireless connections was found to be higher in both countries than over fixed-line
connections. However, even the comparatively high rate of 4-5 outages per week in New Zealand (less than one a day)
is low enough to not have a detrimental effect on user experience.
• While over half of New Zealand’s fixed wireless services experience a very low rate of fewer than 1 outage per week, the
proportion of services that experience one or more outages per day is higher than over fixed-line connections in New
Zealand, and also higher than the proportion of Australia’s NBN Fixed Wireless Plus services experiencing a similarly
high rate of outages.
Streaming services
Figures 21 and 22 show Netflix and YouTube results over fixed wireless connections in Australia and New
Zealand (4G only).
Figure 21 shows the maximum number of concurrent UHD streams from Netflix.
Figure 22 shows the proportion of content available in UHD quality from YouTube.
Data is shown for all hours.
Prepared by SamKnows | June 2022 42Figure 21:
Prepared by SamKnows | June 2022 43Figure 22:
Prepared by SamKnows | June 2022 44Key observations
• While the quality of streaming experience was excellent over the 100/20 Mbps and very high speed fixed-line plans,
streaming performance is much more variable over fixed wireless.
• The median number of concurrent UHD Netflix streams over Australia’s NBN Fixed Wireless Plus plan (2 Netflix UHD
streams) was higher than that over New Zealand’s 4G fixed wireless plans (1 Netflix UHD stream, see Figure 21).
• The proportion of services that could consistently stream Netflix content in UHD was lower in New Zealand.
• In both countries, most consumers were able to stream 90% or more of YouTube’s content in UHD over fixed wireless,
but some fixed wireless users in both countries were only able to stream a lower proportion of content in UHD.
Australia’s NBN Fixed Wireless Plus plan performed slightly better both in respect of the average proportion of content
available in UHD, and the proportion of services able to stream at least 90% of content in UHD on average.
Prepared by SamKnows | June 2022 45Data tables
Fixed-line 100/20 Mbps plans
NBN 100/20 plans over FTTP and HFC and Fibre 100 plans
Panel size Mean 95% confidence interval Panel Mean 95% confidence interval
Metric
(AUS) (AUS) of the mean (AUS) size (NZ) (NZ) of the mean (NZ)
Download - busy 100.2 100.3
54 98.1-102.4 Mbps 263 99.4-101.1 Mbps
hours Mbps Mbps
Download - outside 102.1 101.2
54 100.1-104.1 Mbps 263 100.4-102.0 Mbps
of busy hours Mbps Mbps
Upload - busy 18.2 22.3
54 18.0-18.4 Mbps 263 22.0-22.7 Mbps
hours Mbps Mbps
Upload - outside of 18.3 22.4
54 18.1-18.5 Mbps 263 22.1-22.7 Mbps
busy hours Mbps Mbps
Latency - busy
54 9.6 ms 8.1-11.1 ms 260 6.8 ms 6.3-7.4 ms
hours
Latency - outside
54 8.4 ms 7.0-9.8 ms 260 6.7 ms 6.2-7.3 ms
of busy hours
1.1 per 0.9 per
Outages - all hours 54 0.3-1.9 per week 259 0.2-1.6 per week
week week
Very high speed fibre plans
Panel size Mean 95% confidence interval Panel Mean 95% confidence interval
Metric
(AUS) (AUS) of the mean (AUS) size (NZ) (NZ) of the mean (NZ)
Download - busy 745.6 808.1
91 707.2-784.0 Mbps 288 787.2-829.1 Mbps
hours Mbps Mbps
Download - outside 804.7 851.1
91 768.2-841.2 Mbps 290 834.2-868.0 Mbps
of busy hours Mbps Mbps
Upload - busy 45.7 507.2
91 45.1-46.3 Mbps 288 499.9-514.6 Mbps
hours Mbps Mbps
Upload - outside of 46.0 508.9
91 45.4-46.5 Mbps 290 501.7-516.1 Mbps
busy hours Mbps Mbps
Latency - busy
91 6.1 ms 5.1-7.0 ms 287 5.6 ms 5.1-6.2 ms
hours
Latency - outside
91 5.4 ms 4.5-6.4 ms 287 5.4 ms 4.8-5.9 ms
of busy hours
0.9 per 0.5 per
Outages - all hours 91 0.4-1.3 per week 284 0.4-0.6 per week
week week
Prepared by SamKnows | June 2022 46Fixed wireless plans
Panel size Mean 95% confidence interval Panel Mean 95% confidence interval
Metric
(AUS) (AUS) of the mean (AUS) size (NZ) (NZ) of the mean (NZ)
Download - busy 36.4 29.2
60 32.3-40.4 Mbps 45 21.1-37.3 Mbps
hours Mbps Mbps
Download - outside 47.6 39.1
60 44.0-51.2 Mbps 45 29.6-48.6 Mbps
of busy hours Mbps Mbps
Upload - busy 4.0 17.0
60 3.5-4.5 Mbps 45 13.4-20.6 Mbps
hours Mbps Mbps
Upload - outside of 5.3 18.0
60 4.8-5.8 Mbps 45 14.3-21.7 Mbps
busy hours Mbps Mbps
Latency - busy 43.5 50.0
60 40.5-46.4 ms 45 47.0-52.9 ms
hours ms ms
Latency - outside 49.4
60 41.3 ms 39.4-43.3 ms 45 46.5-52.2 ms
of busy hours ms
1.3 per 4.2 per
Outages - all hours 60 0.6-2.0 per week 45 0.4-8.0 per week
week week
Prepared by SamKnows | June 2022 47Glossary
Term Definition
The independent testing provider appointed to conduct testing for Measuring Broadband Australia and
SamKnows
Measuring Broadband New Zealand. https://samknows.com/
Whitebox A purpose-built hardware measurement agent manufactured by SamKnows, installed in volunteers' homes.
Testing
SamKnows-maintained test servers hosted in different countries.
Infrastructure
RSP Retail Service Provider. A company that provides consumers with access to the internet.
Customer-Premises
Network equipment provided by an RSP (generally including a home router/gateway).
Equipment (CPE)
Broadband A network service or connection which is defined as “always on”, as opposed to historical dial-up internet.
The speed at which data is transmitted over a broadband connection, usually measured in megabits per
Broadband speed
second (Mbps).
The speed at which broadband services are typically advertised or marketed, usually described in Mbps. On
Advertised speed some networks, such as New Zealand's 4G fixed wireless network, these are not given as a general maximum
but vary from line to line as they do not transmit data without depreciation across distance.
The download and upload speeds associated the relevant retail plan. For example, plan speeds for New
Plan speed
Zealand's Fibre 100 plan are 100 Mbps down and 20 Mbps up.
For reporting, fixed-line encompasses the FTTP (fibre to the premises), FTTB (fibre to the building), HFC
Fixed-line
(hybrid fibre-coaxial), FTTC (fibre to the curb), and FTTN (fibre to the node) access technologies.
A broadband connection that uses fibre-optic cables to send data to and from a property directly. Sometimes
Fibre
referred to as FTTH (fibre-to-the-home) or FTTP (fibre-to-the-premises).
Fixed wireless A broadband connection that uses radio waves to provide internet access to a premises.
All hours Refers to tests conducted at any time of the day.
Refers to tests conducted between 19:00:00 and 22:59:59, Monday to Friday (local time). This is the time of
Busy hours
day when people are typically using their internet connection.
The speed that data travels from our test server to your router. Measured in megabits per second (Mbps);
Download speed
higher is better.
The speed that data travels from your router to our test server. Measured in Mbps (megabits per second);
Upload speed
higher is better.
The time it takes for a data packet to travel from your router to our test server and back. Measured in
Latency
milliseconds (ms); lower is better.
The percentage of packets that were lost somewhere between your router and our test server. Measured as
Packet loss
a percentage of all packets sent; lower is better.
A disconnection means that two or more latency measurement packets in a row were lost, resulting in
Disconnection
stuttering broadband performance.
Prepared by SamKnows | June 2022 48You can also read