Transforming lives through responsible credit and financial wellness solutions - Bondster
←
→
Page content transcription
If your browser does not render page correctly, please read the page content below

Transforming lives through responsible credit
       and financial wellness solutions

                                                PAGE 1
About smartadvance
smartadvance, a registered credit and financial services provider, is powered by Finclusion group, which through its
portfolio of companies aims to enhance financial inclusion in sub-Saharan Africa with a strategic focus on simplicity and
ease of use.
• Diversified portfolio of lending and financial wellness products in South Africa.

• Fully digital lending model well suited post covid-19, particularly paired with proven alternative credit scoring models and

  partnership distribution models already in place.

• Significant future growth possibilities within emerging middle class and technology adoption not currently factored in.

• Unique risk/return through profitable baseline economics whilst being positioned ideally to benefit from macroeconomic trends.

• Strategy executed by a management team with 60 years of experience in credit, as part of the wider Finclusion Group founded by

  Timothy Nuy in 2018.

• Strong board in place and world class risk management and reporting

       65 employees                              9.4%                            >170 000                     >1.2m                >2bn
       a team passionate about                   Credit Loss Ratio               Customers                    Loans granted        Disbursed
       our customer                                                                                                                      PAGE 2
SA opportunity
Unique opportunity to drive financial inclusion to a broad consumer market

       Total population              Mobile connections               Internet users       Social media users
       58.93 million                  103.5 Million                   36.54 million        22 million

          66%                            176%                                62%              37%
        Urbanisation                    Penetration                     Penetration         Penetration

       Has an account with a                                          Has a mobile money   Makes online purchases or
       financial institution         Has a credit card                account              payments

           67%                           8.9%                                19%              14%

                                                                                                                       PAGE 3
How we prepared for a covid-19 world
The business took corrective action to mitigate credit risk, improve the loan process, and maintain a high level
                                             of customer service.

Voice contracting             Remote contact center            Adapted lending criteria        Collection innovation

 Reduce time on application       AI driven call center            Mitigate reckless lending      Provided payment plans

 Improve turnaround time          Accessible from any device       Reduce over indebtedness       Alternative payment options

 Quicker payout of funds          Flawless customer service        Improve credit quality         Rewards good behaviour

                                                                                                                                PAGE 4
How we are positively impacting
our clients and driving loyalty
Financial education
Provide the tools to educate clients on financial basics, enabling
them to make better financial solutions for the future.

Education loans
Offering education loans at a lower interest rate to those that
wish to further their education.

Credit rehabilitation
Provide a product to assist with over-indebtedness, backlisting and
judgements through tailored financial products.

Funeral cover
Customers have access to funeral cover tailored to suit family
and financial needs that will ease financial stress in future.

                                                                      PAGE 5
Consumer lending in South Africa

                                   PAGE 6
State of the market
The South African market in Q3 has seen the Level 1 lockdown conditions remain in place despite grandstanding from
lower-level politicians and a slight increase in infection rates.

            Y/Y Increase in Defaults and Credit Utilisation                                  Lending advances growth trends Q2 2020                                      NPL (91+ days in arrears) over time
                                                                                          Secured                                                          25.0%                                                                 40.0%
    20%                                                                60%                 Credit   Mortgage   Un-Secured Credit Facility Short Term
                                                                                                                                                           20.0%                                                                 30.0%
    15%                                                                50%        0.0%
                                                                                                                                                           15.0%
    10%                                                                40%       -20.0%                                                                                                                                          20.0%
     5%                                                                30%                                                                                 10.0%
                                                                                 -40.0%                                                                     5.0%                                                                 10.0%
     0%                                                                20%
           2016       2017        2018          2019            2020             -60.0%                                                                     0.0%                                                                 0.0%
     -5%                                                               10%
                                                                                                                                                                   Mortgage   Credit Facilities Secured Credit   Unsecured
    -10%                                                               0%        -80.0%                                                                                                                            Credit
                      Accs 3 months in default (LHS)
                      Revolving acc incr in avg balance (RHS)                                          q/q growth   y/y growth                                         Q2 2019           Q2 2020             % incr in NPL y/y

YoY increase in defaults                                                     Lending advances growth                                                   NPL’s over time

•     Increase in credit points to an increased level of                     •     Substantial contraction across all categories.                      •    Visible increase in the level of non-Performing Loans
      lending distress.                                                                                                                                     during the first four months of the lockdown.
                                                                             •     Lenders forced to shutter a significant part of their               •
•     increasing defaults as a result of the end of payment                        branch infrastructure                                               •    Increases in the facilities, secured credit and unsecured
      holidays provided by banks and lenders.                                                                                                               lending segments was expected, e seen to be an
                                                                             •     Resulted in sales reductions of between 60% and
•     This has been offset by the reduction in interest rates.                     80%                                                                 •    Acceleration of “bubble” seen in the unsecured and
                                                                                                                                                            vehicle finance markets and predicted in our H2 2019
                                                                                                                                                            report.                                                              PAGE 7
How SmartAdvance responded
The business had already taken a significant amount of corrective action on the loan portfolio as we reshaped the credit
risk approach, the loan process, and our position in the market that the loan portfolio entered the lockdown in a
significantly more insulated state than those of other providers.

                        Collections success rates                                              NPL Rates over time                                                   Approval Rates
                                                                                     57.0%
    100%          88%             89%                           89%       60.0%                                                              50%                                               45%
                                                    84%                                                                                                41%                                           40%
                            78%               75%         78%
            73%                                                           50.0%
    80%                                                                                                                                      40%             33%              33%
                                                                          40.0%
    60%                                                                                                                                      30%                                    25%
                                                                          30.0%                 24.0%
                                                                                                                       18.4%      20.2%      20%
    40%                                                                   20.0%   15.5%      17.0%         17.9%
                                                                                                               15.3%
                                                                                                                           9.2%
    20%                                                                   10.0%                                                       6.3%   10%

     0%                                                                    0.0%                                                               0%
                                                                                  H2 2018    H1 2019       H2 2019     H1 2020    H2 2020                H2 2019              H1 2020          H2 2020
            H1 2019         H2 2019           H1 2020     H2 2020
                          Industry      smartadvance                                            Industry    smartadvance                                           Industry     smartadvance

Collection success rate                                               NPL rates over time                                                    Approval rates

•    Collection rates have consistently outperformed the              •    Maintained an improving NPL rate whilst growing                   We were extremely conservative through H1 as we
     industry during lockdown.                                             approval rates.                                                   strove to understand the shifts in consumer data. This
                                                                                                                                             allowed us to recover exponentially in the second half of
•    Implemented strategies to manage the seasonally                  •    First Payment Missed metric, a strong lead indicator of           the year while still maintaining a high level of quality
     higher risk collection months of December and                         portfolio quality - less than 1% for the past six months,         advances.
     January.                                                              compared to 5%+ in 2018 and against an industry
                                                                           benchmark of 3%.
                                                                                                                                                                                                           PAGE 8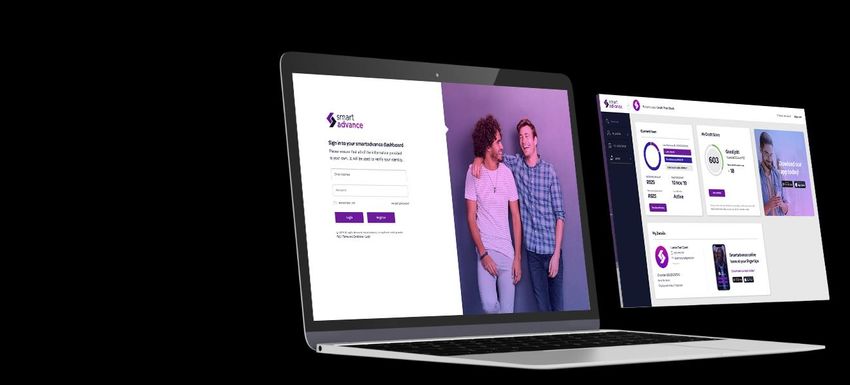
Credit scoring model

Through a bespoke online portal,
                                             Policy Rules            Scorecards   Affordability     Sector/Employer
clients can create a profile and
apply for a loan.

Clients upload documents to get
                                             Minimum Age                                            Min no. of employees
an instant quote according to
their    personal    affordability,          Maximum Age                                           Min. years of operation

based on internal processes as              Minimum Income                                        Macro sector assessments

well as credit bureau data.                   Debt Review

                                             Administration
On approval of the loan
                                             Sequestration
application, funds will be paid
into the customer’s bank account      Minimum Credit Bureau Scores

and monthly instalments will be               Judgements

collected via debit order from              Default/Adverse
their bank account

                                                                                                                             PAGE 9
Credit scoring model                                              (continued)

Assessment and Credit Scoring Model
SmartAdvance utilises a risk scoring engine that analyses aggregated ‘big data’. The
credit scoring engine is configured with the credit policy parameters and is embedded
in the system, preventing human intervention which can result in breaches of policy.

SmartAdvance also make use of credit risk cover for its customers which covers the
outstanding capital in the event of a customer's loss of income relating to death,
temporary and permanent disability, or retrenchment.

External credit bureau enquiries are used to establish outright application
disqualifying factors such as fraud indicators, insolvency, debt review status as
well as external exposure information relating to account handling, balances,
and client commitments.

All core customer data supplied in the application process is vetted
automatically against external and independent data sources specifically
pertaining to personal details, employment details, customer bank details and
customer earning and exposure details. In the absence of automated controls,
such validation is performed manually

                                                                                        PAGE 10
Market proposition
PAGE 11Market proposition/ Collection rates:
Smartadvance 89% 78%
Competitive advantage Industry standard
Smartadvance remains confident in the
quality of its loan portfolio
The business is ahead of its competitors in reshaping its loan portfolios
ahead of the anticipated unsecured lending market correction in the next
12 to 18 months. It has already sold off the older NPL portion of its
portfolio and taken a more conservative view of its credit scoring models,
including incorporating more transactional behaviour information
(sourced from the customers bank statement and psychometric scoring
models).
Ownership of the underlying technology platforms for both lending and
insurance provides us with a greater sense of control over our technology
journey and supports the delivery of the strategy
The results of the above has been a marked improvement in the quality of
the loan portfolio with IFRS9 compliant Expected Credit Loss sitting at 11%
and collection standing at 89% for 2020YTD (industry 78%: 2020 YTD)
PAGE 12Target Market
Gender Age Geography
3%
5% 9%
21-25
17% 10%
Gauteng
38% 26 -35
46% Female
Western Cape
42% 36 -45
Male
24% 57% Kwazulu Natal
Unknown 46 -55
33% Other
16% 56 - 65
Income
2500
2000
1500
1000
500
0
3001 - 6000 6001 - 10 10 001 - 15 15 001 - 20 20 001 - 30 30 001 - 50
000 000 000 000 000
PAGE 13We are evolving with the SmartAdvance
changing world by enhancing and Assist over-indebted clients with affordable repayments.
NiftyCredit
Digitally driven online credit provider available through web
and mobile app.
Credit rehabilitation
Assist over-indebted clients with affordable repayments.
CreditView
Provide customers with access to their credit profiles.
NiftyCover
Customers have access to affordable and flexible funeral cover
plans as well as Credit Life cover for protection against
PAGE 14
outstanding debt.Product overview
Experience simple and secure financial services from anywhere.
01. Wage streaming 05. Insurance
Provide customers with funds to deal Provide customers access to an array of
with everyday emergencies insurance products such as funeral and
commuter cover that will relieve the financial
burden in future.
02. Consolidation and rehabilitation
Provide the means to clear a bad credit
record and save money monthly 06. SmartSupport
Provide financial education as well as
dedicated support to assist clients with
03. Education Loans
applications and queries.
Enable customers to further their
education and grow their careers at an
affordable rate.
04. Personal Loans
Customers can access safe and affordable
finance for home improvements, education
or other important expenses.
PAGE 15Product detail
Experience simple and secure financial services from anywhere.
01. Wage streaming
Customers can access a percentage of their net salary and pay a
flat fee of R40 per month.
02. Consolidation and rehabilitation
Consumers can consolidate existing debt up to R30 000 over 24
months and only pay one lower instalment as well as save up to
R800 per month.
03. Education Loans
A credit line up to R20 000 over 24 months is available for customers
that wish to further their studies and grow their careers.
PAGE 16Product detail
Experience simple and secure financial services from anywhere. 04. Personal Loans
Customers can access safe and affordable finance up to R20
000 payable over 24 months for home improvements,
education or other important expenses.
05. Insurance
Provide customers access to an array of insurance products
such as funeral and commuter cover that will relieve the
financial burden in future. Cover starts from as little as R15
per month.
06. Smartsupport
Provide financial education as well as dedicated support to
assist clients with applications and queries.
PAGE 17Product detail
• 3 – 12-month Short-Term Loans
• Through a bespoke online portal, accessible from the website, clients can apply for a personal loan up to
R12,000 over a maximum payment term of 12 months.
• Revenue generated by the various entities on Short-Term Loans are described in the table below
Charges Smartadvance
Interest per month 5% on the first loan in a 12-month period (rebased 1 Jan)
3% on the second loan
Initiation fee R165 per credit agreement
Plus 10% x (Loan value – R1 000)
Maximum initiation fee should not exceed R1 050; or 15% of loan value
Monthly Administration fee R60 plus VAT
Credit Life R4.45 per R1 000
PAGE 18Consumer touchpoints
Multiple channels for easy accessibility
Web Online chat
Staff can apply, obtain their credit reports, access Staff can chat live with
financial education, and manage their profiles all online. smartadvance staff to assist
with loan applications,
Mobile app application status or
Employees can access their personal profile and apply queries from the web.
for credit from any smartphone with internet.
USSD
Call centre agents Clients can request their loan
Dedicated team available to assist with queries,
balance or a settlement through
applications and ongoing support.
the easy-to-use USSD platform.
Regional representatives
Our sales teams educate customers and assist with loan
applications as well as provide ongoing customer service.
PAGE 19Loan application process adjusted by market with
Our technology focus on optimising user experience and automation
to drive sales volumes.
Technology driven customer experience
Using a stack of cloud-based and web technologies, loan
applications are simplified and take substantially less time to
complete.
Benefits include:
• Reduced risk for client as well as lender
• Improved level of compliance
• Elimination of human error probability
• Quicker turnaround time and ultimately Resulting in improved customer
experience
• Platform agnostic. Can be deployed with the data science modules or on a
standalone basis
Design, flow and functionality can be tailored The platform has been developed in a way it can be
to market and customer experience. easily adapted to different business requirements. PAGE 20Risk management
PAGE 21Risk metrics
Collections success rates NPL Rates over time
100% 89% 89% 57.0%
88% 84%
60.0%
78% 75% 78%
80% 73% 50.0%
40.0%
60%
30.0% 24.0%
40% 17.0%
17.9% 18.4% 20.2%
20.0% 15.5% 15.3%
20% 9.2%
10.0% 6.3%
0% 0.0%
H1 2019 H2 2019 H1 2020 H2 2020 H2 2018 H1 2019 H2 2019 H1 2020 H2 2020
Industry smartadvance Industry smartadvance
CD1 Default Rates Expected Credit Loss
6% 20%
5.00%
5% 14.30% 15.10%
15%
4% 3.30%
9.70% 9.20%
3% 10%
2% 1.30% 1.50%
5%
1%
0% 0%
H1 2019 H2 2019 H1 2020 H2 2020 H1 2019 H2 2019 H1 2020 H2 2020
CD1 Default Rates ECL
PAGE 22Risk analytics
• Partnered with Global Fund Administrators (GFA) to
provide market leading administration capabilities for
our note and related investment programmes.
• GFA has over 15 years experience in the South African
and global asset and liability administration markets.
• And administers >R58bn across more than 650
instruments with >35k investors.
• Is registered with the FSCA as well as the FSC in
Mauritius.
GFA manages our note programme
onboarding, distributions and
consumer communication.
PAGE 23Governance
Board of Directors
Gerrie Fourie Jaco Coetzee Tamuka Mpofu Matsi Modise Manuel Koser Nicky Swartz
Board Sub Committees
Audit and Risk Social and Ethics Remuneration
Head of Internal Audit reports directly through to Audit & Risk Chair
Management Committees
Exco Credit
PAGE 24Financials
PAGE 25Financials
KPI – Resilience through Covid-19
High Level Financials Commentary
Key Performance Indicators 2020 2021 2022 2023 2024 • The budget has assumed a significant new funding lines to come on board late Q2 in 2021 and
Loan book growth - 175.5% 29.8% 26.8% 12.4% Q1 of 2022, with cash being deployed in a 3 month window.
Operating income growth (Excl impairments) - 154.4% 21.0% 32.8% 19.3% • Benefits of rationalizing levels of OPEX during 2020 are filtering through to forth coming
periods, with scale of variable costs the main contributors to the increases between 2022 and
Total operating expense growth - (11.2%) 20.6% 15.4% 15.1%
2024.
Cost to Income Ratio 188.8% 65.9% 65.7% 57.1% 55.1%
• The loan loss provisions and Credit loss ratio are anticipated only to have a slight deuteriations
Loan loss provision (LLP) ratio 13.7% 10.1% 6.7% 8.1% 8.4% during future periods. This is attributed to the robust AI-data driven credit scoring and
affordability assessments..
Net interest income / Operating Income 70.8% 69.1% 73.3% 73.7% 77.5%
Non interest income / Operating Income 29.2% 30.9% 26.7% 26.3% 22.5%
Interest Coverage Ratio (EBIT/Interest Payments) (1.9)x 1.0x 1.2x 1.3x 1.4x
Interest earning Assets/ Interest Bearing
0.6x 1.1x 1.1x 1.1x 1.2x
Liabilities
DER (Debt to Equity Ratio) 4.6x 6.8x 7.1x 5.8x 4.1x
EBIT (in millions) -23.9 23.5 55.5 68.1 79.4
Net Loans / Total Assets: 43.2% 81.9% 80.5% 83.4% 85.0%
Net Interest Margin (NIM): 23.1% 21.7% 24.3% 25.5% 27.1%
Credit Loss Ratio 11.3% 10.1% 11.0% 11.7% 13.1%
PAGE 26P&L forecasts –
Conservative funding assumptions
Three Year P&L Forecasts Commentary
ZAR (Millions) 2021 2022 2023 2024
• Projected growth in the loan book (175%:2021, 39%:2022, 26%:2023, 15%: 2024) is expected to
Net Interest Income:
drive profitability - the increased volume of loan sales will see the company starting to become
(+) Interest Income: 71.7 109.0 134.0 159.6 profitable in 2022 and post a profit in all the forecasted years there after due to higher interest
(-) Interest Expense: (23.2) (46.7) (51.0) (55.5) income and fee and commissions on loans.
Non-interest income 21.7 22.6 29.6 30.3 • New product offerings such as Wage streaming service (that allows employees to access a
portion of their salary owed to them for the month but that has not yet been paid) will assist in
Impairments losses on loans to customers: (23.7) (20.3) (31.3) (36.4)
the sales drives and as a result the Loan Book growth.
Operating Income: 46.5 64.5 81.4 98.0
• A drop in cost to income to 52% by 2024 is anticipated. This attributed to improved economies
(-) Employee Costs: (22.3) (25.4) (28.2) (31.7) of scale and the continued emphasis on a lean OPEX structure.
(-) Professional Fees: (5.9) (6.0) (6.6) (7.4) • The main driver of OPEX will remain employee costs at an average of 47% of Total OPEX. This is
(-) Other Operating Expenses: (13.9) (16.8) (20.6) (24.0) still lower than industry averages as the group leverages its digital and online lending
infrastructure..
(-) Sales/Marketing Expenses: (3.5) (3.7) (4.3) (4.8)
• A healthy yield on earning assets is expected sufficient to cover funding costs and OPEX. Net
(-) Fee and Commission Expense: (5.1) (7.5) (9.8) (10.8)
interest margin is expected to average 23.8%. This is a estimate based on higher cost of
(-) Management Fees / Royalties 7.1 8.2 10.1 9.8 funding (average projected cost of funding being 18%).
(-) Depreciation & Amortization: (2.7) (4.5) (4.8) (5.1) • Growth in impairments is commensurate with growth in the loan book as credit quality will be
Total Operating Expenses: (46.2) (55.7) (64.3) (74.0) maintained at optimal levels with resultantly low loan loss provisions.
Profit before tax: 0.3 8.8 17.1 24.0
(-) Income Tax Expense / (+) Tax Benefit: - - - -
Profit after tax 0.3 8.8 17.1 24.0
PAGE 27Balance sheet forecasts
Maintaining strong capitalization
Three Year Balance Sheet Forecasts Commentary
ZAR (Millions) 2021 2022 2023 2024
• The Group projects a 192% growth in its Total Assets to R487m by 2024 (2021:R252.8m). It
Assets:
plans to achieve this while further sweating its balance sheet with interest earning assets
Cash and cash equivalents 6.5 12.1 12.5 16.0
Placements with other banks - 10.0 - - accounting for on average 89% of total assets during the forecast periods.
Gross Loans 234.9 304.9 386.7 434.6 • Projected growth in the loan book (175%:2021, 39%:2022, 26%:2023, 15%: 2024) will be
(-) Provisions (23.7) (33.6) (45.2) (57.1) financed by external borrowings.
Net Loans and advances to customers 211.2 271.3 341.5 377.5
Related party loan 6.5 7.1 7.7 8.3 • External borrowing are expected to close at R183.6m (2021) based on funding discussions
Other assets 5.2 5.2 10.2 10.2 underway, with a further funding pipeline anticipated in Q1 of 2022.
Deferred tax assets 14.4 14.4 14.4 14.4 • Maintaining credit quality remains a tenet of the Group, thus it will continue to invest in its AI-
Right of use Asset 1.6 0.3 4.0 2.5
data driven credit scoring solutions and robust affordability assessment. Further, disposal of
Property, plant and equipment 0.0 5.7 9.4 7.2
non-performing portfolio’s will continue as is current practice.
Intangible assets 4.2 3.0 1.7 0.3
Goodwill 8.0 8.0 8.0 8.0 • Maintaining credit quality remains a tenet of the Group, thus it will continue to invest in its AI-
Total assets 257.7 337.0 409.3 444.3 data driven credit scoring solutions and robust affordability assessment. Further, disposal of
Equity: non-performing portfolio’s will continue as is current practice.
Share capital 343.2 343.2 343.2 343.2
• Credit loss ratio is therefore expected to average 11.4% (IFRS9 ECL provisions).
Retained earnings (314.6) (305.8) (288.7) (264.7)
Total equity 28.6 37.4 54.5 78.5 • Overall the balance sheet remains sound with emphasis on increasing the asset base through
Liabilities: improved leverage and maintaining asset quality.
External borrowings 195.7 264.1 314.6 322.1
Shareholder loans 8.6 9.5 10.3 11.3
Other liabilities 23.1 25.1 27.4 29.9
Lease Liabilities 1.7 0.9 2.4 2.4
Total liabilities 229.2 299.6 354.8 365.8
Total equity and liabilities 257.7 337.0 409.3 444.3
PAGE 28Meet the team
PAGE 29Meet the team
Executive directors
Gerrie Fourie | Country Head
Mark is the CEO of the smartadvance South Africa Group and a founding director of Fractal Labs and Click2Pay, with over 25 years experience in the African
financial services landscape. He led the separation of the SA businesses from MyBucks into the Finclusion group . Prior to joining MyBucks he was the
founder and CEO of Ideation, a specialist lending and insurance consulting company with clients in South Africa, Nigeria, Kenya and Malawi with a focus on
credit risk, capital raising, and value chain transformation. Mark was previously the Deputy CEO and CRO for Bayport SA and the CRO of Old Mutual Finance.
He has served as the chair of these organisations credit committees as well as serving as a non-executive director of Mazwe Financial Services, Old Mutual
Investment Administrators and a trustee and chair of the Board of Trustees of the Fairbairn Capital and BoE retirement funds.
Jaco Coetzee | COO
Jaco is the COO of smartadvance South Africa and Director of GetSure (Pty) Ltd with more than 10 years’ experience in Senior Management. Before taking the
COO roll at smartadvance, Jaco had the role of Human Resource executive at MyBucks, as well as Senior Management positions in Virgin Active. Jaco holds a
BCom HR degree and is in the process of completing his Masters in Labour Law.
Tamuka Mpofu | Executive Director
Tamuka is a strong believer in innovation through technology having spearheaded implementation of several e-platforms to improve efficiency. He has deep
experience in the finance sector. He completed his articles with KPMG Chartered Accountants, Zimbabwe with a specialty in Banking & Financial Services.
Tamuka was an Audit Manager with MooreStephens International before joining GetBucks Microfinance Bank Limited (the Zimbabwe-based Get Bucks
subsidiary) as its Head of Internal Audit. He joined MBC Holdings Limited, a bank holding company, as Group Finance Manager where he focuses on financial
reporting and management. Tamuka Mpofu holds a BCompt from the University of South Africa (UNISA) and a post-graduate CTA (Certified Theory in
Accounting) Level 1 from UNISA with emphasis on Financial Accounting, Management Accounting, Audit and Taxation. He is a Certified Expert in Microfinance
with the Frankfurt School of Finance & Management.
PAGE 30Meet the team
Executive directors
Matsi Modise | Chair
Matsi is a global thought leader on entrepreneurship. She has contributed to entrepreneurship in South Africa by leading advocacy teams, that have
impacted the policy landscape by driving traction for tax incentives for venture capital companies. Matsi represents a number of companies and/or funds as a
board, trustee and board advisor. From 2012 to 2015, she was the managing director of the South African Black Entrepreneurs Forum (SABEF), an industry
association that created entrepreneurship ecosystems in South African townships, rural and peri-urban areas. Matsi joined SiMODiSA, an industry association
focussed on SMMEs in South Africa in 2015 as the Vice Chairman. She is the founder and CEO of Furaha Afrika Holdings. Matsi holds a Bachelor of Commerce
degree (Marketing & Advanced Management from the University of the Witwatersrand.
Manuel Koser | Independent Non-Executive Director
Manuel is a serial entrepreneur with deep e-commerce experience. He co-founded and managed a number of e-commerce businesses such as Jumia,
Nigeria’s largest e-commerce company and Zando, South Africa’s largest e-commerce fashion retailer which has 200+ employees, 20K+ products from over
500+ brands, its own warehouse, and multiple payment methods. In 2015. Prior to joining Get Bucks, Manuel founded Silvertree Holdings, “Africa's Disruptive
Brand Builder" invested in a portfolio of 12 brands, with an operational platform providing seed capital and support to the entrepreneurs to supercharge
scale. Manuel holds a Bachelor of Science in International Business from the University of Maastricht, Netherlands.
Nicky Swartz | Independent Non-Executive Director
Nicky spent over 20 years in advertising and marketing in SA and the UK, with a special focus on financial services. During this time, She spent 7 years as
Managing Director of ad agency TBWA Cape Town which provided sound understanding and experience in general management and 5 years as Head of
Marketing between Sanlam and 10X Investments. Nicky has a particular appreciation for the role of finance as a lever for social transformation which lead to
the foundation of Spoon Money, which advocates the view that serious economic development starts with two essential ingredients; savings rather than
consumption, and capacity-building credit. Nicky holds a degree with English and Psychology majors (UNISA) and a post-grad BSc Hons degree in Digital
Technology (Dublin Institute of Technology).
PAGE 31Meet the team
Management team
Geoffrey Ferrier Janine Hancock Mologado Lehong
Insurance Executive Human Capital Executive Head of Customer Experience
Astrid Meyer Yudre Casling Marika Calitz
Marketing Executive Head of Collections Head of Internal Audit
Inge van Graan Quintin Dry
Head of Legal & Corp Secretarial Head of IT
PAGE 32W W W . S M A R TA D V A N C E . C O . Z A
012 045 0606| info@smartadvance.co.za
1st Floor, The Wedge | 43 Garsfontein Road, Waterkloof | Pretoria, South Africa PAGE 33You can also read