Translating Data Generated by the Transit App into Insights on Transportation Use in Greater Boston
←
→
Page content transcription
If your browser does not render page correctly, please read the page content below
April 2021
 Report No. 21-016

 Charles D. Baker
 Governor
 Karyn E. Polito
 Lieutenant Governor
 Jamey Tesler
 Acting Secretary & CEO

 Translating Data Generated by the
 Transit App into Insights on
 Transportation Use in
 Greater Boston
 Principal Investigator(s)
 Dr. Daniel O’Brien
 Dr. Qi Wang
 Northeastern University

Research and Technology Transfer Section
MassDOT Office of Transportation Planning
[This blank, unnumbered page will be the back of your front cover]
Technical Report Document Page
 1. Report No. 2. Government Accession No. 3. Recipient's Catalog No.
 21-016 n/a n/a
4. Title and Subtitle 5. Report Date
Translating Data Generated by the Transit App into Insights on April 2021
Transportation Use in Greater Boston 6. Performing Organization Code
 n/a
7. Author(s) 8. Performing Organization Report No.
Daniel T. O’Brien, Qi Wang, Justin de Benedictis-Kessner n/a
9. Performing Organization Name and Address 10. Work Unit No. (TRAIS)
Boston Area Research Initiative, Northeastern University, 1135
Tremont St., Boston, MA 02120 11. Contract or Grant No.
 105598
12. Sponsoring Agency Name and Address 13. Type of Report and Period Covered
Massachusetts Department of Transportation Final Report - May 2021
Office of Transportation Planning [September 2018 – April 2021]
Ten Park Plaza, Suite 4150, Boston, MA 02116
 14. Sponsoring Agency Code
 n/a
15. Supplementary Notes
Project Champion - Jen Elise Prescott and Anna Gartsman, MBTA
16. Abstract
Transit is an app that Massachusetts Bay Transit Authority (MBTA) riders can use to navigate the system
and compare alternative routes. The data generated by the app are made available to MBTA by Transit
and they are a rich resource for understanding the behavior of customers. The purpose of this project was
to tap this unprecedented resource through three tasks: (1) Construct Transit data storage
infrastructure including two subtasks: determining the content and organization of the data and building
a storage infrastructure; (2) Enhanced measures for research and policy, including a series of derived
measures describing sessions (i.e., individual uses of the app), routes, and users that were not explicitly
available in the data but could be calculated from the information that was there or otherwise
incorporated. (3) Research illustrating the utility of Transit data to demonstrate how it might be used
in the future. This culminated in an analysis of when and why Transit users selected rideshare options (or
TNC) over public transit. This was the most detailed analysis of its kind and the first to leverage real-life
decisions as made by transit riders and has been submitted for publication at the journal Transportation
Research Part C: Emerging Technologies.

17. Key Word 18. Distribution Statement
Transit App, MBTA, Massachusetts Bay Transit
Authority, transit data

 19. Security Classif. (of this report) 20. Security Classif. (of this page) 21. No. of 22. Price
 unclassified unclassified Pages n/a
 70
Form DOT F 1700.7 (8-72) Reproduction of completed page authorized

 i
This page left blank intentionally.

 ii
Translating Data Generated by the Transit App into
 Insights on Transportation Use in Greater Boston

 Final Report

 Prepared By:

 Daniel T. O’Brien
 Principal Investigator

 Qi Wang
 Co-Principal Investigator

 Justin de Benedictis-Kessner
 Co-Principal Investigator

 Boston Area Research Initiative
 Northeastern University
 1135 Tremon St.
 Boston, MA 02120

 Prepared For:

 Massachusetts Department of Transportation
 Office of Transportation Planning
 Ten Park Plaza, Suite 4150
 Boston, MA 02116

 April 2021

 iii
This page left blank intentionally.

 iv
Acknowledgements
Prepared in cooperation with the Massachusetts Department of Transportation, Office of
Transportation Planning, and the United States Department of Transportation, Federal
Highway Administration.

The Project Team would like to thank partners at the Massachusetts Bay Transit Authority's
Office of Performance Management and Innovation, Jen Elise Prescott, Anna Gartsman, and
Monisha Reginald, for their collaboration in sharing data, proposing policy priorities for our
research, and identifying implications. We also thank representatives from Transit for data
sharing and support.

 Disclaimer
The contents of this report reflect the views of the authors, who are responsible for the facts
and the accuracy of the data presented herein. The contents do not necessarily reflect the
official view or policies of the Massachusetts Department of Transportation or the Federal
Highway Administration. This report does not constitute a standard, specification, or
regulation.

 v

This page left blank intentionally.

 vi
Executive Summary
This study of “Translating Data Generated by the Transit App into Insights on Transportation
Use in Greater Boston” was undertaken as part of the Massachusetts Department of
Transportation (MassDOT) Research Program. This program is funded with Federal
Highway Administration (FHWA) State Planning and Research (SPR) funds. Through this
program, applied research is conducted on topics of importance to the Commonwealth of
Massachusetts transportation agencies.
 The project was completed by the Boston Area Research Initiative (BARI), led by PIs
Daniel T. O’Brien, Justin de Benedictis-Kessner, and Qi Wang. Transit is an app that MBTA
riders can use to navigate the system and compare alternative routes. These decisions leave
“digital breadcrumbs” that are stored in a database that is a rich resource for understanding
the behavior of Massachusetts Bay Transit Authority (MBTA) customers, and it is made
available to the MBTA through their contract with Transit. The purpose of this project was to
tap this unprecedented resource, evaluate and demonstrate its potential, and support the
MBTA in using these data for research and analysis moving forward. This work was pursued
in collaboration with the Office of Performance Management and Innovation (OPMI).
 The project consisted of three tasks that constituted the full data life cycle from
description to interpretation to research to the construction of technical processes for
sustainable use of the data. We summarize the highlights from each of these tasks.
Task 1. Construct Transit Data Storage Infrastructure included two subtasks:
determining the content and organization of the data; and building a storage infrastructure.
BARI built a Python script that unfolds the data from their original JSON format into a
tabular format that is accessible to analysis; provided variable-by-variable-documentation for
the resultant tables; and deployed these on MBTA servers for sustainable use.
Task 2. Enhanced Measures for Research and Policy included a series of derived
measures describing sessions (i.e., individual uses of the app), routes, and users that were not
explicitly available in the data but could be calculated from the information that was there
(e.g., tabulating total walk distance across a trip with multiple segments of walking). We also
developed mechanisms for merging the data with general transit feed specification (GTFS)
feeds and weather data from the National Oceanic and Atmospheric Administration (NOAA).
These variables were included in the full documentation.
Task 3. Research Illustrating the Utility of Transit Data for future use. We determined
that the greatest novelty in the data was their ability to capture real-world mode choice
decisions. Based on this, we completed an analysis that examined if and when Transit users
appeared to select rideshare options (or TNC), as indicated by their decision to “tap” on them
when planning a trip. We analyzed the general spatial and temporal distribution of these TNC
taps as well as the contextual conditions that were associated with them, many of which were
measures drawn from the original data or derived in Task 2 (e.g., wait time, walking
distance). The findings illustrated both complementarity and competition between TNC
services and public transit. This analysis, which was the most detailed of its kind and the first
to leverage real-life decisions made by transit riders, was submitted for publication at
Transportation Research Part C: Emerging Technologies.

 vii

This page left blank intentionally.

 viii
Table of Contents
Technical Report Document Page ........................................................................................................... i
Acknowledgements ................................................................................................................................ v
Disclaimer .............................................................................................................................................. v
Executive Summary ............................................................................................................................. vii
Table of Contents .................................................................................................................................. ix
List of Tables ........................................................................................................................................ xii
List of Figures ...................................................................................................................................... xii
List of Acronyms .................................................................................................................................. xv
1.0 Introduction ...................................................................................................................................... 1
 1.1 Background on TNC .................................................................................................................... 3
 1.2 Previous Studies ........................................................................................................................... 3
 1.3 Current Study ............................................................................................................................... 6
2.0 Research Methodology ..................................................................................................................... 7
 2.1 Data and Preprocessing ................................................................................................................ 7
 2.2 Measures ...................................................................................................................................... 9
 2.2.1. Trip-specific Features .......................................................................................................... 9
 2.2.2. User-specific Features........................................................................................................ 10
 2.2.3. Contextual Factors ............................................................................................................. 10
 2.3 Classification Models................................................................................................................. 11
 2.3.1. Logistic Regression............................................................................................................ 12
 2.3.2. Support Vector Machine .................................................................................................... 12
 2.3.3. Random Forest ................................................................................................................... 13
 2.3.4. AdaBoost ........................................................................................................................... 14
3.0 Results ............................................................................................................................................ 16
 3.1 Spatial-temporal Patterns of Trip Taps ...................................................................................... 16
 3.2 Trip Characteristics of Trips with TNC and Public Transit Taps .............................................. 18
 3.3 When Do Riders Select TNC over Public Transit? .................................................................... 19
 3.4 What are the Most Influential Factors? ...................................................................................... 20
4.0 Implementation and Technology Transfer ..................................................................................... 22
 4.1 Accessing and Preparing Transit Data for Analysis .................................................................. 22
 4.2 Data Tables and Variables ......................................................................................................... 23
5.0 Conclusions .................................................................................................................................... 24
 5.1 Research Discussion ................................................................................................................. 24
 5.2 Limitations and Next Steps ....................................................................................................... 26
 5.3 Final Conclusion ....................................................................................................................... 27
6.0 References ...................................................................................................................................... 28
7.0 Appendices ..................................................................................................................................... 32
 7.1 Attempts to Validate Transit App User Sample......................................................................... 32
 7.2 Accessing and Preparing Transit Data for Analysis .................................................................. 34
 7.2.1. Quick Start ......................................................................................................................... 34
 7.2.2. Update the Database .......................................................................................................... 35
 7.2.3. Transit App Data Structure ................................................................................................ 35
 7.2.4. Data Unfolding Process ..................................................................................................... 36
 7.2.5. External Data ..................................................................................................................... 37

 ix
7.2.6. Trip-Planning Data Processing .......................................................................................... 38
7.3 Transit App Data ........................................................................................................................ 39
 7.3.1. sessions .............................................................................................................................. 39
 7.3.2. trip_views........................................................................................................................... 40
 7.3.3 favorite_locations................................................................................................................ 41
 7.3.4 nearby_views ...................................................................................................................... 42
 7.3.5 legs ...................................................................................................................................... 42
 7.3.6 daily_weather ...................................................................................................................... 43
7.4 Descriptive Statistics of Trip View Data ................................................................................... 43
7.5 Supplementary Information of Analysis .................................................................................... 46
 7.5.1. Database Component ......................................................................................................... 46
 7.5.2. Tap Number Comparison................................................................................................... 46
 7.5.3. Multi-mode Trips with Taps .............................................................................................. 47
 7.5.4. Feature Transformation...................................................................................................... 49
 7.5.5. Precipitation Data .............................................................................................................. 50
 7.5.6. Temporal Progression of Tap Tendencies ......................................................................... 51
 7.5.7. Correlation Heatmap .......................................................................................................... 52

 x
This page left blank intentionally.

 xi
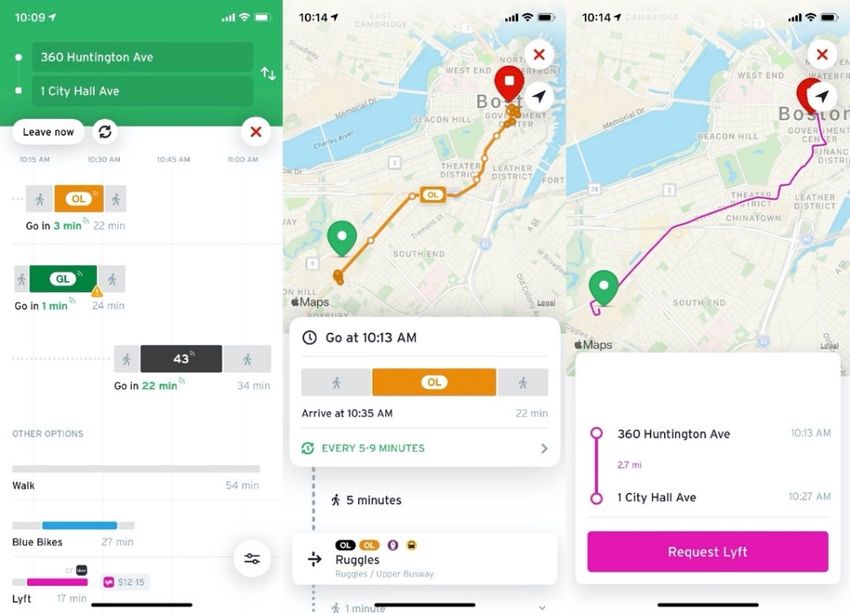
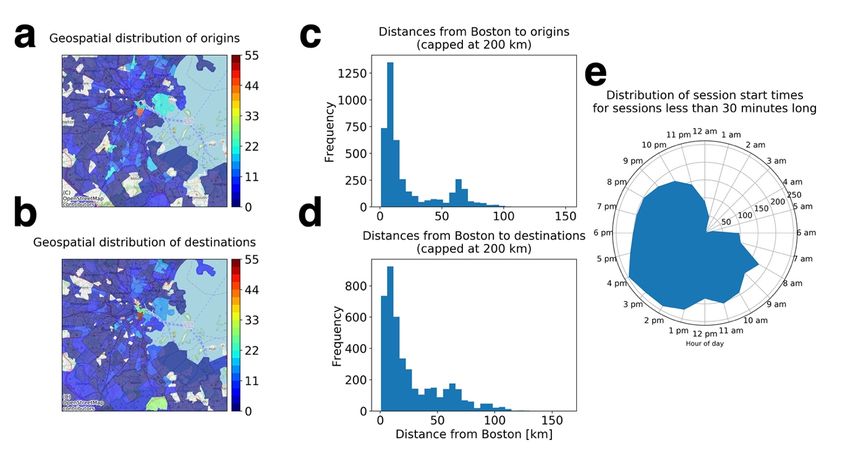
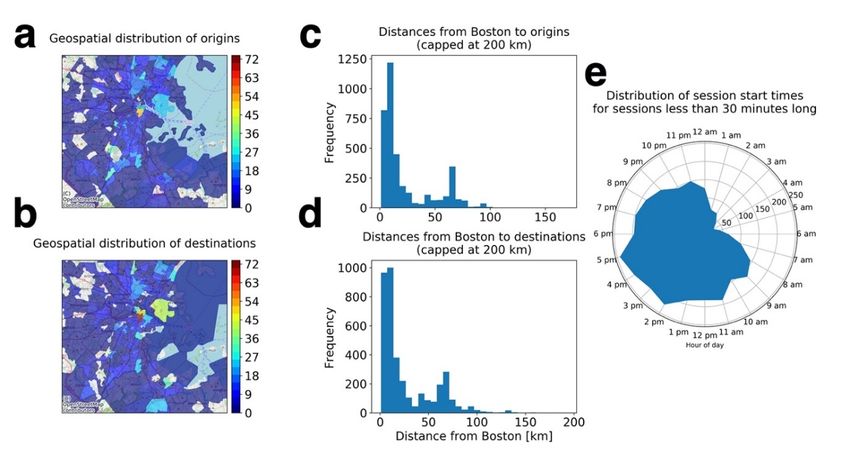
List of Tables
Table 2.1: List of Trip-specific variables ............................................................................................. 10
Table 2.2: List of User-specific variables............................................................................................. 10
Table 2.3: Temporal Intervals of Lockdown Stage in response to COVID-19 in MA......................... 11
Table 3.1: Predictive efficacy of the four algorithms used to predict TNC taps .................................. 19
Table 7.1: List of variables for table: sessions ..................................................................................... 39
Table 7.2: List of variables for table: trip views................................................................................... 40
Table 7.3: List of variables for table: favorite locations....................................................................... 41
Table 7.4: List of variables for table: nearby views ............................................................................. 42
Table 7.5: List of variables for table: legs ............................................................................................ 42
Table 7.6: List of variables for table: daily weather ............................................................................. 43
Table 7.7: Statistics of Numerical Variables from Trip View Table.................................................... 46

 List of Figures
Figure 2.1: Screenshot of Transit app trip planning results (left) and detailed view of one public
 transportation option (middle) and TNC option (right). ................................................................ 8
Figure 2.2: Pseudo-code for AdaBoost ................................................................................................ 14
Figure 3.1: The geospatial distribution of (a) trip origins and (b) destinations, by census tract of trip
 with taps on public transit and the spatiotemporal features of trips with taps on public transit,
 including the distances of (c) origins and (d) destinations from Boston; and (e) their distribution
 over the course of the day. ........................................................................................................... 16
Figure 3.2: The geospatial distribution of (a) trip origins and (b) destinations, by census tract of trip
 with taps on public transit and the spatiotemporal features of trips with taps on TNC service,
 including the distances of (c) origins and (d) destinations from Boston; and (e) their distribution
 over the course of the day. ........................................................................................................... 17
Figure 3.3: Comparisons between sessions with taps on public transit (yellow) and TNC (blue),
 including distributions and medians (dashed lines) for (a) estimated wait time for optimal transit
 trip, (b) estimated wait time for optimal TNC trip, (c) trip distance, (d) total travel time for
 optimal transit trip, (e) total travel time for optimal TNC trip, and (f) walking distance to reach
 first leg for optimal public transit trip.......................................................................................... 18
Figure 3.4: Model coefficients for Logistic Regression in (a) and feature importance for all predictor
 variables included in the models, as determined by the (b) AdaBoost and (c) random forest. For
 each algorithm, we select only 75\% of the samples and assign the class weight to each instance
 based on the inverse ratio of the corresponding label to balance the label distribution. We
 perform 100 iterations and report both the means and standard deviations for all the metrics.This
 page left blank intentionally. ....................................................................................................... 21
Figure 7.1: Comparison of the Density of Actual Residents (left and Known Home Locations from
 Transit App Accounts (right) in Suffolk County. ........................................................................ 33
Figure 7.2: Comparison of the Density of Actual Residents (left) and Inferred Home Locations from
 Transit App Usage (right) in Suffolk County. ............................................................................. 33
Figure 7.3: Frequency of Trip Global_Route_IDs from Trip View Table ........................................... 43
Figure 7.4: Frequency of Vehicle Types from Trip View Table .......................................................... 44
Figure 7.5: Frequency of Longest Leg Mode from Trip View Table ................................................... 44
Figure 7.6: Frequency of Longest Leg Vehicle Type from Trip View Table ...................................... 45

 xii
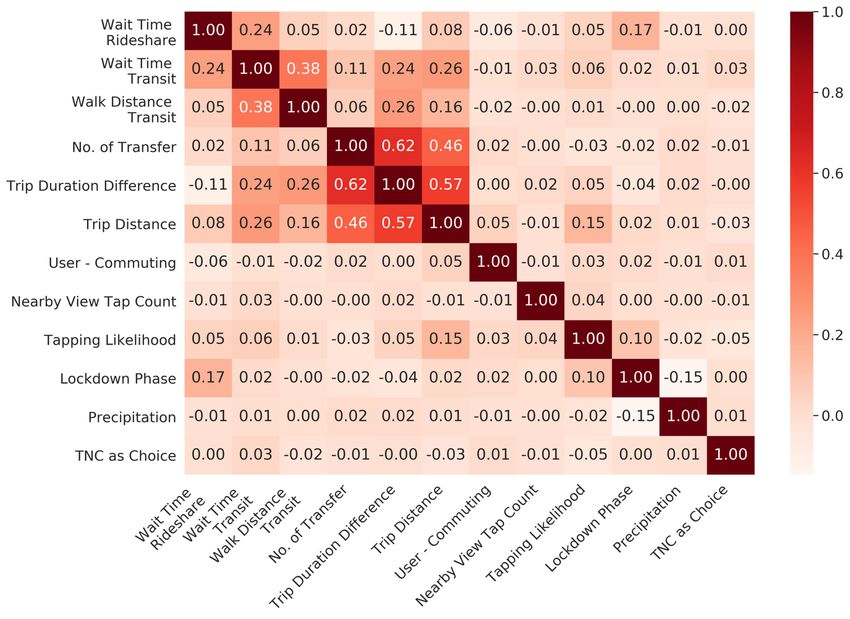
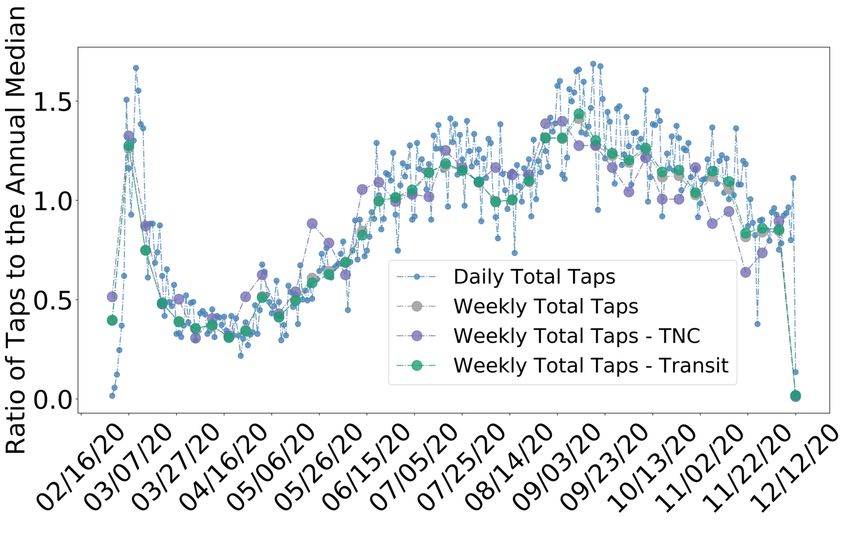
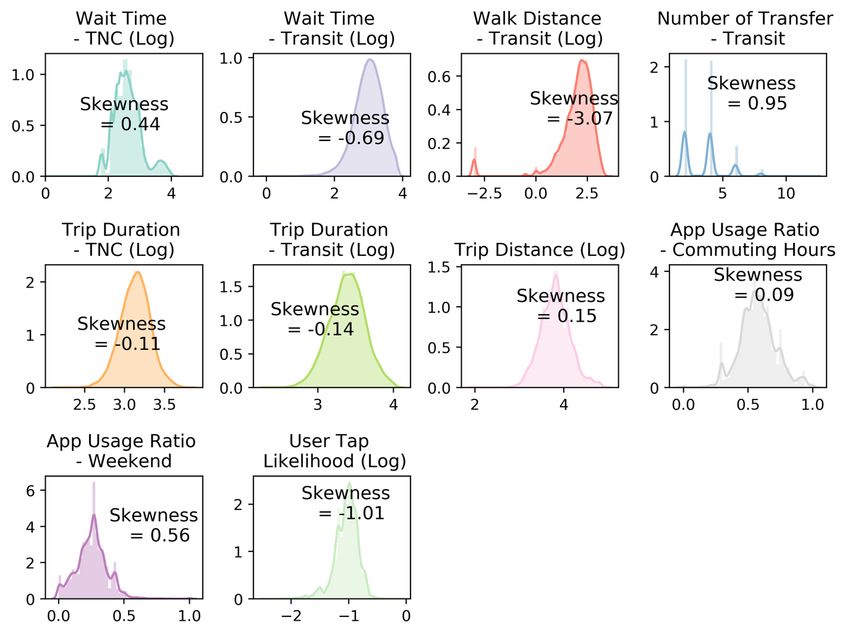
Figure 7.7: Frequency of the Binary Variables from Trip View Table ................................................ 45
Figure 7.8: Comparison of the Number of Taps on both Transit and TNC across all Queries ............ 47
Figure 7.9: Comparison of the Number of Taps on both Transit and TNC across all Queries ............ 48
Figure 7.10: Comparison of the Number of Taps on both Transit and TNC across all Queries .......... 48
Figure 7.11: Distributions of Values for Original Input Features ........................................................ 49
Figure 7.12: Distributions of Values of Input Features with Log-transformation on Selected Features
 ..................................................................................................................................................... 50
Figure 7.13: Time Series of the Historical Precipitation Data ............................................................. 51
Figure 7.14: Time Series of the Relative Trip Taps on Transit and TNC modes ................................. 52
Figure 7.15: Pearson Correlation Heatmap of Predictive Features ...................................................... 53

 xiii
This page left blank intentionally.

 xiv
List of Acronyms
Acronym Expansion
AdaBoost Adaptive Boosting
BARI Boston Area Research Initiative
CART Classification and Regression Tree
FHWA Federal Highway Administration
MassDOT Massachusetts Department of Transportation
NCDC National Climatic Data Center
NOAA National Oceanic and Atmospheric Administration
OPMI Office of Performance Management and Innovation
RF Random Forest
SP Stated Preference
SPR State Planning and Research
SVM Support Vector Machine
TNC Transportation Network Companies

 xv
This page left blank intentionally.

 xvi
1.0 Introduction
 This study of “Translating Data Generated by the Transit App into Insights on
Transportation Use in Greater Boston” was undertaken as part of the Massachusetts
Department of Transportation (MassDOT) Research Program. This program is funded with
Federal Highway Administration (FHWA) State Planning and Research (SPR) funds.
Through this program, applied research is conducted on topics of importance to the
Commonwealth of Massachusetts transportation agencies. The work was completed by the
Boston Area Research Initiative (BARI).

 Transit is a mobile phone application that provides real-time public transit data, as
well as information about alternative options, allowing riders to make informed decisions
about how to navigate a metro region. It is available internationally in over 200 metro
regions, including greater Boston. The Massachusetts Bay Transit Authority (MBTA) has a
contract with Transit by which MBTA endorses Transit as its preferred app for navigating the
system and Transit provides MBTA with access to the data generated by the app. The
purpose of this project was to tap this unprecedented resource, evaluate and demonstrate its
potential, and support the MBTA in using these data for their own purposes moving forward.

 When riders interact with the Transit app, they leave “digital breadcrumbs” that are
collected by Transit and stored in a database. This database is a rich resource for
understanding the behavior of customers and unique in that it captures their real-time
decision-making and habits. It can in theory be useful for answering a variety of questions.
When, where, and why do residents of greater Boston use transit? How are these tendencies
affected by the immediate context, policy changes, or disturbances? What factors do
individuals prioritize when selecting one of multiple trip options? The raw data generated by
Transit (hereon, Transit data), however, are not ready for such analyses. Like many other
modern digital (i.e., “big”) data generated by administrative systems or internet-based
platforms, they lack the structure and documentation necessary to be immediately useful for
research, policy, or practice. The first step is to get to know the data better, in order to
determine what precise information is contained in the data, what insights they will support,
and how we can achieve these insights.

 BARI worked in close collaboration with the Office of Performance Management and
Innovation (OPMI) to develop an understanding of the content and potential of the Transit.
The project consisted of three tasks: (1) Construct transit data storage infrastructure,
including the two subtasks of determining the content and organization of the data and then
building a storage infrastructure for housing the data in tabular form. (2) Enhanced
measures for research and policy, consisting of derived measures describing sessions (i.e.,
individual uses of the app), routes, and users that were not explicitly available in the data but
could be calculated from the information that was there. (3) Research illustrating the utility
of Transit data to demonstrate how it might be used in the future. These three tasks
constituted the full data life cycle, from description to interpretation to research to the
construction of technical processes for sustainable use of the data.

 1
This document summarizes the products of each of the three tasks, with a focus on the
culminating research project, which built on and illuminated the value of the first two tasks.
Once we completed the initial process of preparing the data for research, we invested much
effort in determining what types of research questions Transit data were best suited to
answer. A series of initial analyses revealed considerable difficulty in confirming whether the
population of Transit app users were demographically or behaviorally representative of the
broader population or of those that ride public transit, especially being that app users do not
report any demographic information. One promising lead was that a small subset of app users
have included their home address in their profile. We used techniques common in the study
of mobility data to infer home addresses to see if locations of greatest usage matched onto
stated home addresses, but the two rarely agreed. The hope was that if this approach worked
we could estimate the demographic composition of Transit users. It turns out that, while
people use their cellular devices for communication and social media while at home,
allowing the inference of home addresses, they have generally already left the home when
they are checking for the schedule of their bus, train, or other travel options. For this reason,
we concluded that without a survey of the app users themselves the problem of
representativeness seemed intractable (we provide the full analysis in Section 7.1 in the
Appendix).

 We determined in collaboration with OPMI that one thing that was unique about
Transit data that no other data source offered was the ability to reveal the real-time decision-
making of its users as they considered different options. This ability partially obviated
concerns about representativeness because it allowed for within-person comparisons of
options with different characteristics; for instance, if a person is presented with five options
for travel, we can determine whether certain modes are more attractive, the influence of wait
time or transfers, and other contextual factors without concern as to whether the sample itself
was fully representative. Based on this, we undertook an analysis of when and why Transit
users select rideshare options (or transportation network companies, or TNC), such as Uber
and Lyft. We analyzed the general spatial and temporal distribution of these TNC taps as
well as the contextual conditions that were associated with them, many of which were
measures drawn from the original data or derived in Task 2 (e.g., wait time, walking distance,
time to destination). We believe this is an important advance and we have submitted it for
publication at the journal Transportation Research Part C: Emerging Technologies with the
title ‘To Ride-Hail or Not to Ride-Hail? Complementarity and Competition Between Public
Transit and TNCs Through the Lens of App Data’. It also makes up the bulk of this report.

 The remainder of this document is structured as follows. This chapter continues with
background on TNC and current knowledge about when and why transit riders choose it over
public transit options. Chapter 2 presents the Research Methodology, which includes a
description of Tasks 1 & 2, including the steps for processing the data, the resultant data
structure, and the various variables accessed, created, and leveraged. Chapter 3 presents the
Results of the study. Chapter 4 presents the Implementation and Technology Transfer,
including a more detailed description of the tools for data processing and associated
documentation that BARI delivered. Chapter 5 presents the Conclusions from the study on
TNC as well as insights on the utility of the Transit data themselves. Chapter 6 includes
References from throughout the document. And Chapter 7 contains the multiple Appendices
that provide extra detail on process, variables, and descriptive statistics.

 2
1.1 Background on TNC

 TNC services are reshaping urban mobility. Uber, for instance, provided 6.9 billion
trips in 2019 (Uber Technologies Inc 2019) and is available in over 10,000 cities globally
(Inc 2020). The expansion of TNC necessarily means that their riders are shifting many of
their trips from other modes of transportation, leading them to have outsized impacts on the
dynamics of urban transportation. Scholars and pundits have especially highlighted the
consequences this might have for public transportation, but there are differing views on
exactly how this relationship is operating. Some see the relationship as competitive, with
TNCs and their offers of affordable, door-to-door travel drawing riders away from public
transportation (Habib 2019). Others have argued, though, that TNC complements public
transportation by filling in the gaps in public transit service. The extent to which each of
these mechanisms is at work determines the actual impact TNCs have on cities (Shaheen and
Chan 2016). How much do they replace public transit ridership with automobile traffic?
What are the implications for the optimal allocation of resources? The answers are in turn
crucial for transportation authorities and planners as they shape the urban transportation
system of the 21st century.

 There have been a number of studies on when and why riders choose TNC, but they
have generally relied on self-report surveys (Habib 2019). Such research designs are
informative, but their detail and validity are of course limited by the nature of survey work.
These studies have highlighted either the potential for competition or complementarity
between TNC and public transportation - but rarely have the limited data available given
researchers the opportunity to evaluate the two phenomena in tandem. We assess the tradeoff
between competition and complementarity directly by analyzing an original data set
generated by a transportation services app, Transit, that informs riders about options in all
available modes of transportation, including public transportation and TNCs, among others.
These data allow us to observe the real-time decisions of thousands of riders as they navigate
the city - in this case, greater Boston, MA. We examine the geospatial patterns of the TNC
and public transit trips selected by users of the app and use machine learning models to
determine which contextual and personal conditions lead a rider to select TNC over public
transit. From these analyses we find new evidence that, depending on the situation, TNC both
complements and competes with public transit.

1.2 Previous Studies

 TNCs have become ubiquitous in cities across the world, providing riders with an
alternative to more traditional forms of transportation. Most obviously, TNCs draw riders
away from taxis, as they offer a nearly identical product but with more convenient, on-
demand service. From a transportation planning perspective, however, there has been much
discussion of how TNCs might disrupt other modes of transportation in cities, with the
greatest attention to its impacts on public transit usage. Two different perspectives on this
question have emerged. The predominant narrative, especially in popular media, has been
that the same convenience that leads riders to choose TNCs over taxis also draws them away

 3
from public transit (Eluru, Chakour, and El-Geneidy 2012; Bovy and Hoogendoorn-Lanser
2005; Yan, Levine, and Zhao 2019) . Alternatively, some researchers have claimed that
TNCs complement public transit services in various ways, possibly even increasing public
transit ridership. To date, there is some empirical evidence for each of these dynamics, but as
of yet no consensus.

 The theory that TNCs might compete with public transit relies on a broader logic and
body of research on mode choice. In particular, the kinds of factors that tend to influence
riders' mode choices make TNC services appealing. For instance, one study (Carrel,
Halvorsen, and Walker 2013) showed that less reliable bus and light rail services - that is,
inconsistency in the timing of vehicle arrivals - cause passengers to ride public transit less
often. Such unreliability, especially when coupled with real-time information on delays, can
make passengers more anxious about their transit mode choice (Chow, Block-Schachter, and
Hickey 2014). Other work on public transit mode choice has emphasized the number and
wait time of transfers as consistent factors driving transit mode choice. Notably, it was found
that passengers consider every additional transfer to be as burdensome as an additional 10
minutes of travel time. Consequently, they estimate that reducing the number of transfers by
1 would increase transit ridership by 9.17% (Eluru, Chakour, and El-Geneidy 2012). While
these studies do not explicitly reference TNCs, they highlight the kinds of advantages -
including real-time arrival information, no transfers or crowding, and fewer on-board delays -
that might offer TNCs a comparative advantage over public transit.

 Studies that have directly compared mode choice between public transit and TNCs
have reinforced TNCs potential appeal. One major convenience of TNC services is that they
offer point-to-point trips without transfers. This suggests that the number of transfers in
public transit may lead travelers to choose TNC services in order to minimize transfers (Yan,
Levine, and Zhao 2019). Another study (Rayle et al. 2016) found that for most trips taken
using TNCs, the public transit trip would have taken significantly more time. Similarly, two
other studies (Habib 2019; Clewlow and Mishra 2017) show that longer total travel time for
public transit trips can lead passengers to prefer TNCs and subsequently take fewer transit
trips. Taken together, these results appear to confirm that the efficiency and convenience
offered by TNCs cause some passengers to replace a portion of their public transit trips with
ride-hailing. That said, it is possible that the cost of convenience proves too great in certain
situations. For instance, very long trips typically served by commuter rail might experience
less competition given that the corresponding TNC trip could be prohibitively expensive.

 An alternative perspective is that TNC can complement public transit, possibly even
increasing its effectiveness. There are two main elements to this argument. First, TNCs may
solve what is known as “the last mile problem" - passengers’ ability to get to and from the
public transit stations where their trip begins and ends (Shaheen and Chan 2016) - and
otherwise fill in gaps in public transit. A 2016 joint report from the Shared-Use Mobility
Center and American Public Transportation Association stated that because TNC trips
commonly occur at times and in places where public transit is not readily available, it often
serves as a complement (Murphy 2016). A similar report from Pew Research Center
suggested that TNC services complement public transit because TNC users are more likely to
use other mobility options such as public transit than non-users of TNCs (Smith 2016). Some
indirect evidence for this comes from the finding that public transit ridership, especially rail

 4
transit ridership, has increased in places where TNCs have been introduced (Hall, Palsson,
and Price 2018; Malalgoda and Lim 2019) relative to places where they have not been
introduced. This parallel rise in both TNC and public transit ridership suggests that TNCs do
not replace public transit trips so much as enable individuals to more easily access public
transit when stations are not necessarily conveniently located. Others have made the same
argument for the timing of rides, as ride-hailing services are more likely to be made in the
late afternoon, evening, and night, and on weekends, times at which transit service tends to
run at lower frequencies (Feigon and Murphy 2018; Habib 2019). Of course, these aggregate
comparisons fail to account for potential trends in more general transportation demand rising
over time as well, which could lead to observed parallel increases in TNC and public transit
use independent of underlying patterns of trip replacement.

 The work on complementarity between TNCs and public transit has been bolstered by
evaluations of pilot programs that sought to integrate TNC services with existing fixed-route
transit services. These studies are intriguing for two reasons. First, they include one of the
only studies (if not the only study) that used actual records of rides to examine mode choice.
One study (Terry and Bachmann 2020) found that the majority of ride-hailing trips taken in
such a pilot served as "feeder" trips that brought passengers closer to transit stops. Second,
however, these ridership patterns are potentially the consequence of sizable discounts on the
kinds of TNC trips that complement public transit that are offered by cities partnering with
ride-hailing companies (Habib 2019; Westervelt, Schank, and Huang 2017; Curtis et al.
2019). Such subsidies may be unsustainable over the long-term, especially considering the
well-known lack of profitability for companies like Uber thus far (Zoepf et al. 2018). If such
deliberate price manipulation is a key element of the ability for TNCs to solve last-mile
problems, it raises the question of whether such complementarity will persist (Guda and
Subramanian 2017).

 In summary, there are two well-established perspectives on the relationship between
TNC and public transit, one that sees them as complements in a modern urban transportation
system, the other that sees them as competitors. The empirical evidence currently comes,
however, from only a handful of studies, most of which rely on aggregate inference or survey
responses. Further, many of the studies have set out to test only one of these theories and not
the other, providing a partial view of the TNC-public transit relationship. There is clearly a
need for ride-level data that can reveal passenger choices and the contextual features that
inform them - be they wait time, transfers, walking distance, or time of day or week. Such
data would help to paint a more conclusive, comprehensive picture of the complementarity or
competition between TNCs and public transit (or lack thereof) but have largely been
unavailable to researchers to date. Most recently a study (Zhao et al. 2020) utilized stated-
preference (SP) survey data and implemented multiple advanced machine learning
algorithms, they found that random forest outperforms the logit models in terms of travel
mode choice prediction.

 5
1.3 Current Study

 The current study uses data from the Transit app to examine when and why travelers
choose TNC over public transit services. The app is designed to help riders navigate public
transit services by providing them with real-time information on local routes as well as
alternative modes of transportation, including TNC. It generates data from user interactions,
capturing how riders make mode-choice decisions in real time without the complications and
validity issues of survey data. Rather than posing specific trade-offs and comparisons, we are
able to model the rider's travel behavior based on their use of the "trip planning interface,"
which offers the rider multiple options across mode choices for completing a requested trip
from one point to another. In doing so, the app produces objective versions of many of the
measures used in previous hypothetical survey items, including number of transfers, wait
time, and travel time, among others. Alongside these advantages, we do note a downside.
Users of the Transit app are not necessarily a random sample of transit riders. Most
importantly for our study questions, those who use the app are potentially predisposed to
riding public transit, as that is the named purpose of the app and it has been endorsed by
multiple public transit agencies. Keeping this in mind, the interpretation of the results should
be of the factors that encourage transit riders to select TNC instead. This may in fact be a
positive aspect as we highlight the features that are strong enough to encourage such a
switch, but it is also important when considering the results and their implications.

 Another advancement of using such data is its neutral position with regards to TNCs,
which leaves no potential for bias from marketing stimulation in our examination of evidence
for either competition and complementary. The precise spatiotemporal nature of the data also
allows us to link the information from within the app with contextual information, including
time of day and week and real-time weather, which are both believed to affect mode choice.
Last, we do note that the specific data we use here only became available at the end of
February 2020, meaning our study occurs almost entirely during the COVID pandemic. We
include the different phases of the pandemic in Massachusetts (shutdown, Phase 1 reopening,
etc.) in our models to control for this, but there is the possibility that some of the results we
see are specific to the pandemic. On the other hand, it is unclear how quickly, if ever, transit
usage will return to its previous equilibria, meaning that these results could be more
informative moving forward. In any case, any interpretation should keep this factor in mind.

 6
2.0 Research Methodology

2.1 Data and Preprocessing

 Transit data describes each user session (i.e., discrete time period between opening
and closing the app on the phone). This includes information presented to the user by the app
and about the actions the user took while in the app. There is no personally identifiable
information, but a device identifier represents an anonymous record of a user. These
identifiers persist across sessions, meaning it is possible to compare behavior at the
individual level over time. In order to directly examine decision-making behavior, our
primary scale of analysis is the user session. This report focuses substantively on our analysis
of when and why users of the app might choose TNC options instead of or in conjunction
with public transit options, but here we describe the data source more generally. Additional
information is also provided in Section 4 on Implementation and Technology Transfer and
numerous Appendices (specific references made throughout this section).

 The two most commonly used features in Transit are the “nearby views” and "trip
planning” interfaces. The first is the default when opening the app and informs users of
routes that are near to their current location. The second, displayed in Figure 2.1, is the focus
of our analysis here as it permits the comparison of preferences across options for trip with
established origin and destination. The trip planning interface allows users to input an origin
(most often their current location from GPS) and destination. The app then returns multiple
potential routes using a variety of different transportation modes by which the user could
reach their destination. The app includes all forms of public transportation that are locally
available (e.g., subway, commuter rail, bus, light rail, etc.) as well as walking, biking, bike
share, and TNC. Routes often combine multiple transportation modes (e.g., walk-subway-
walk). In both interfaces, users can “tap” on routes to learn more about them or set alerts for
when they need to leave to catch a given vehicle.

 The data generated by the app are provided by Transit in a JSON array wherein each
element is a nested JSON object containing a user's activity for that day. This format is
somewhat difficult for analysis purposes: (1) querying for a slice of the data spanning several
days, i.e. a column across all user sessions, requires a full read and parse of each daily data
dump; (2) querying for a specific subset of all columns for a specific set of users similarly
requires a full read and parse; (3) the data must be flattened into data frame-like structures
before being used statistics software packages, given that information within a given data
dump reference multiple scales of analysis (e.g., app usage session, user, route) and
interfaces (e.g., nearby routes, trip planning searches initiated by the user). For this reason,
we “flatten” or “unfold” the data into multiple tables before analysis.

 When flattening the data we generate five tables, each describing a different set of
objects or actions: user sessions; trip views; favorite locations (from a user’s profile); nearby
views; legs (from a suggested route in trip planning). For instance, as shown in the left panel
of Figure 2.1, the trip planning interface reports various features for each route, including

 7
estimated departure and arrival times, distance to origin station, and wait time. This
information is contained in the trip planning table. We also merge in weather data for the
date of the session for Boston provided by the National Oceanic and Atmospheric
Administration’s (NOAA) National Climatic Data Center (NCDC), contained in a sixth table.
We also have built a process for merging general transit feed specification (GTFS) data for
the MBTA based on spatiotemporal proximity, in order to coordinate the within-app
information with the availability of vehicles for routes of interest. We have provided the
syntax for the flattening process, the variables in each of these tables, and merger with
external data sources to OPMI for use in future work. More detail on these processes is
provided in Section 4 on Implementation and Technology Transfer, and the readme guide for
the code is included in Section 7.2 in the Appendix.

 For the purpose of the analysis that follows, we use data recording 336,873 trip
queries generated by 55,163 users between February 29, 2020, and December 15, 2020 that
included at least one tap on either a public transit or TNC option. For fuller comparative
analyses (Sections 3.2 and 3.3), we limited our data to users who had tapped at least once on
a public transit trip in the trip planner and at least once on a TNC trip during the study period.
This ensures that we are not making unrealistic comparisons between individuals who would
never tap on one mode or the other. Within these users, we only include sessions in which:
(1) the user utilized the trip planning feature (i.e., requested a set of trip options from the
app); (2) the trip planner generated at least one public transit option and at least one TNC
option; (3) the user tapped on at least one of these options; and (4) the option tapped on was
not a combination of transit and TNC (see Section 4.1 for more). This amounts to a final
sample of 23,475 trip queries generated by 1,918 users for these comparative analyses.

 Figure 2.1: Screenshot of Transit app trip planning results (left) and detailed view of
 one public transportation option (middle) and TNC option (right).

 8
2.2 Measures

 Numerous measures are associated with the components of each session and
interface. These are described in full detail in Section 7.3 in the Appendix, which is a
documentation file that we provided to OPMI to inform their use of the flattened data;
Section 7.4 in the Appendix also includes descriptive statistics for select variables capturing
basic patterns of usage. To illustrate a particular use case for this content, we concentrate on
the measures needed to examine users’ tendencies to select options involving TNC.

 In order to best measure individuals' choices between public transit and TNC, we
treat users' "taps" on individual transportation options as a measure of their interest in - and
possible use of - a given mode. We mark the mode choice as TNC if the user tapped on a
greater number of TNC trip options during a session than the number of public transit trip
options that garnered taps. For analytic purposes, we then remove any sessions in which the
user tapped on a different mode choice (e.g., walk) or the tap numbers on Transit and TNC
are equal (true for < 1.5\% of sessions with taps).

 We use several features to predict the conditions under which users were more or less
likely to choose (i.e., tap) on TNC relative to public transit options. These trip characteristics
fall into three categories: (1) trip-specific features of the travel options generated by the app
(e.g., distance from the user's origin position); (2) the user's ridership habits, based on
historical usage patterns (e.g., tendency to ride during commuting hours); and (3) contextual
factors (e.g., time of day, precipitation). Before analysis, we log-transformed numerical
predictors to account for outliers and skewness and performed One-Hot Encoding for the
categorical variables, translating them into a series of dichotomous variables. Section 7.4 in
Appendix provides more details on measures, data transformation and correlations.

2.2.1. Trip-specific Features
 The trip planning interface provides detailed information on each leg (i.e., the
undivided portion of a trip on a single vehicle, like a segment of walking or a ride on a single
bus) of each option it generates for a given trip. We extract a series of variables that describe
the distance, duration, and modes of the trip and its legs, detailed in Table 2.1. We treat these
trip-specific variables as factors that might influence a rider's decision-making. In order to
have a direct comparison between TNC and public transit, we select a single "optimal" option
for both modes. For both public transit and TNC, if a single trip is selected by a user, then we
define that as "optimal" for that mode, as it was clearly the one that most attracted the user's
attention. If either more than one or no trips are tapped for that mode, then we define the
optimal route as the option with the shortest duration among all candidates with the fewest
transfers. This definition is based on previous work indicating that transfers and then length
are the most important factors for riders choosing between public transit options. The
features of this optimal option are then those used for comparison in the models that follow.

 9
Variable Computation
 Walk Distance Cumulative distance to reach the origin of the first
 vehicular leg
 Wait Time Cumulative time before the first vehicular leg
 (including walking time)
 Travel Time Total duration of the trip
 Longest Leg Mode Vehicle type for the longest non-walking legs (e.g.,
 bus, subway)
 Number of Transfers The number of vehicular legs (excluding walking)

 Table 2.1: List of Trip-specific variables

2.2.2. User-specific Features
 Individuals' preferences and patterns of behavior could also contribute to their choice
of travel mode choice. Some such characteristics can be extracted from the user's usage of the
app across the full timespan of the data (February through December 2020), as we
summarize in Table 2.2 below.

 Variable Computation
 Tap Frequency Proportion of sessions with taps performed
 Usage Frequency Proportion of days with active sessions
 Primary Usage Time (Used to Most frequent usage time window (weekday
 identify "Commuters") commuting hours, weekday non-commuting
 hours or weekends)

 Table 2.2: List of User-specific variables

2.2.3. Contextual Factors
 Last, we consider contextual factors including weather, time of day, week, and year.
Data from the primary Boston weather station, located at Boston's Logan Airport
(USW00014739), were retrieved from NOAA’ NCDC. These data contain records of
precipitation (in inches) for each day. We match the date of the start time of each session in
the Transit data to the corresponding weather readings as the amount of precipitation might
influence rider behavior.

 We also use the time and date of a given session to better understand the context of
the user's decision making. First, we note whether the session began during commuting hours
from Monday through Friday (i.e., between 7 am and 10 am as well as between 4 pm and 6
pm) or not, and whether it occurred on a weekend. Second, we divided the year according to
the evolution of public policies related to the ongoing coronavirus pandemic--namely, pre-
shutdown, shutdown, and reopening phases, as defined by emergency declarations by the
Governor of Massachusetts. These dates are listed in detail in Table 2.3.

 10
Date Stage
 th
 Before March 13 , 2020 Before Emergency Declaration
 March 13th to May 17th National Emergency
 May 18th to June 5th Phase 1 Reopening
 June 6th to July 6th Phase 2 Reopening
 After July 6th, 2020 Phase 3 Reopening

 Table 2.3: Temporal Intervals of Lockdown Stage in response to COVID-19 in MA

2.3 Classification Models

 We examine whether the features described in the previous section predict whether a
rider selected TNC over public transit with four different machine-learning techniques: (1)
logistic regression (Scott, Hosmer, and Lemeshow 1991; Peng, Lee, and Ingersoll 2002) uses
independent variables to predict the likelihood of an outcome variable being classified as '1';
(2) support vector machine (SVM) (Chih-Wei Hsu, Chih-Chung Chang 2008), which
classifies cases by finding the best k-dimensional hyperplane as a decision boundary, with
the advantage of reducing overfitting; (3) random forest (RF) (Vladimir Svetnik et al. 2003;
Archer and Kimes 2008), which classifies cases using a series of decision trees to control for
both the bias and variance of the model; and (4) Adaptive Boosting (AdaBoost) (Schapire
2003), which integrates trees from multiple classifiers into one “great classifier” that is
weighted to enhance accuracy on challenging cases, often enhancing overall fit.

 For all models the data were randomly split, with 75% samples as training and the
remaining 25% samples as testing. Last, the low prevalence of TNC taps creates an
imbalanced data set and thus can impact the performance of prediction from conventional
classification algorithms (Guo and Viktor 2004) to address this issue, we assign the class
weight to each instance based on the inverse ratio of the corresponding label during the
training process to balance the label distribution. Additionally, in order to ensure the
robustness of the results, we reran analyses 100 times and report both the means and standard
deviations for all results.

 We evaluate the efficacy of our models with multiple indicators. The most commonly
used metric is accuracy, which is the number of accurate predictions divided by total
prediction. However, when the data categories are imbalanced, as in the current case,
accuracy is a less reliable indicator of the efficacy of a model. In addition, accuracy reflects
the entirety of the model, rather than evaluating its performance in predicting a particular
class of interest. Therefore, we also consider other metrics that overcome these weaknesses.
Precision and recall scores for the minority class are the two most common metrics for
dealing with an imbalanced class distribution. The precision score (true positive/(true
positive + false positive)) captures the proportion of predicted TNC taps that were correct
while the recall (true positive/(true positive + false negative)) reflects the ratio of actual TNC

 11
You can also read