Transport Topic Paper - May 2021 - Brighton & Hove City ...
←
→
Page content transcription
If your browser does not render page correctly, please read the page content below

Transport Topic Paper
  May 2021

SCAPE Carden Avenue and Norton Road pilot projects ITT exhibition feedback report   0
Contents
1. Context ................................................................................................................................................ 2
2. City Plan Part Two ............................................................................................................................... 3
3. Technical Note .................................................................................................................................... 4
4. Further Dialogue with Highways England ........................................................................................... 4
5. Conclusions ......................................................................................................................................... 9
Appendix 1: City Plan Part 2 Strategic Transport Assessment: Technical Note (August 2019) ............ 10
Appendix 2: Systra A27 CPP2 Transport Impact Analysis (January 2020) ............................................ 24

                                                                             1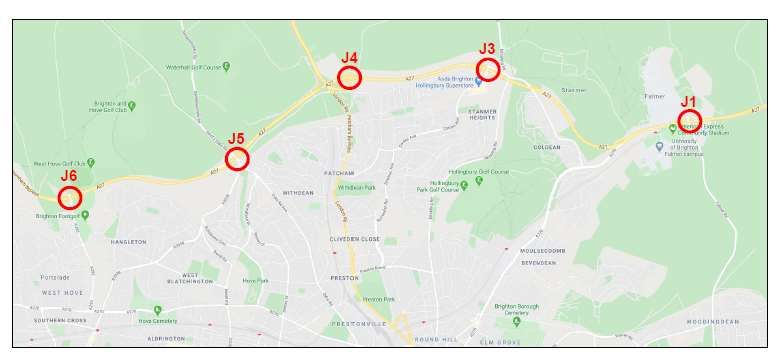
1. Context
1.1     The Brighton & Hove City Plan Part One (CPP1) was adopted in March 2016 and sets out the
strategic policy framework to guide the new development required across the city to 2030. CPP1 sets
the overall amounts of development to be planned for and the broad locations and Development
Areas where new development will take place. It allocates key strategic sites and sets out strategic
policies to guide future development including policies for urban design, transport, affordable
housing, biodiversity and sustainability. This strategic framework is now part of the statutory
Development Plan for Brighton & Hove.

1.2      Policy CP1 relates to housing delivery and states that “the council will make provision for at
least 13,200 new homes to be built over the plan period 2010 – 2030 (this equates to an annual average
rate of provision of 660 dwellings).” A number of large, strategic site allocations are included in CPP1
which cumulatively total 3,635 additional new homes.

1.3     During the preparation of CPP1 collaborative work was undertaken between the Highways
Agency (HA) (now known as Highways England (HE)) and the city council and its transport modelling
consultant. This included assessing the impact of the proposed amount of development on the
strategic road network (SRN) and agreeing appropriate mitigation work where necessary to enable
the SRN to accommodate the forecast extra traffic. Correspondence from Highways England dated 17
May 2013, prior to the examination of the Plan, concluded that:

          “[The HA] are satisfied with the sustainability of the Spatial Strategy outlined in the City
          Plan [Part One] and therefore that the Plan is sound. Sufficient work on the mitigation
          measures has been undertaken at this 'stage of the planning process… and the models
          used by Brighton & Hove to assess impacts and help define mitigation measures are fit for
          purpose.

          Further more detailed studies for planning applications will be required. However the
          proposals put forward at this stage of the plan making process are appropriate and
          deliverable subject to funding contributions from third parties.

          As such we are satisfied that the Plan can be delivered, subject to working with the HA to
          develop improvement designs moving forward and that the spatial strategy that
          underpins the City Plan is the most sustainable approach to accommodating growth within
          Brighton & Hove. The approach adopted by Brighton & Hove is sound and consistent with
          the Agency’s view of best practice in ensuring development is planned in a way that
          encourages more sustainable travel patterns and behaviours.”

1.4    Modifications to the CPP1 agreed during the examination process resulted in the Plan’s
housing target increasing by 1,900 units to 13,200 dwellings based on:-

    i)         Windfall Allowance in first 10 years - approximately an additional 650 units; and
    ii)        Urban Fringe sites – an allowance of 1060 additional units.

1.5      The impacts of this increase on the Strategic Road Network were considered through an
Addendum to the Strategic Transport Assessment published in June 2014. The HA confirmed
that it continued to support the transport strategy in the City Plan; that it was satisfied there will

                                                       2
be no harmful impact on Trunk Road junctions as a result of the strategy; and that the evidence
underpinning the Plan is sound.
1.6 The City Plan Part One was subsequently found sound by the appointed inspector and
adopted by the council in March 2016.
2. City Plan Part Two
2.1 The role of the City Plan Part Two (CPP2) is to support the implementation and delivery of
CPP1. It does this by building on the strategic policy framework set out in CPP1 by identifying and
allocating additional development sites to provide housing above the 3,635 identified on strategic
sites in CPP1 to assist in meeting the minimum 13,200 housing target set out in CPP1 Policy CP1, and
sets out a detailed development management policy framework to assist in the determination of
planning applications. It is consistent with the vision, strategy, objectives and strategic policies set out
in CPP1; and it also covers the period to 2030. A series of housing and mixed-use site allocations are
included through Policies H1, H2 and SSA1 – 4 so that the CPP1 strategy for accommodating
development needs can be implemented. CPP2 does not significantly increase the planned amount of
housing in CPP1, rather the additional site allocations provide more specific detail on where it will be
located.
2.2 Consultation took place on a Draft CPP2 in summer 2018. The representation from Highways
England relating to Polices H1 (Housing Sites and Mixed-Use Sites) and H2 (Housing Sites – Urban
Fringe) included a requirement that the cumulative impact of traffic that would be created by the
housing development sites allocated in CPP2 on the SRN (in particular the junctions on the A27) had
been included within the strategic modelling undertaken for CPP1. If so, the previously agreed junction
mitigation work would be able to accommodate the future traffic levels. If not, further consideration
of appropriate mitigation may be required in order for HE to be satisfied that the effects of the
development proposed in CPP2 would not have an unacceptable impact on the operation of the SRN.
2.3 CPP1 is an adopted part of the development plan and will remain so irrespective of the
outcome of the CPP2 examination process. The strategic approach of the City Plan as a whole is
therefore not open to challenge or debate at the current time and the housing target set out in Policy
CP1 of a minimum of 13,200 homes over the Plan period remains unchanged.
2.4 The issue therefore in addressing the concerns of Highways England is whether the spatial
distribution of the proposed housing development site allocations in CPP2, together with the relatively
modest anticipated increase in overall housing supply affects the conclusions of the previous work to
such an extent that the previous conclusions now become invalid - i.e. that satisfactory mitigation of
the effect on the SRN junctions can no longer be achieved. The work
2.5 Dialogue has been ongoing with HE since the Draft Plan consultation in 2018 in an to attempt
to reach agreement that HE’s concerns have been resolved. During this period the Proposed
Submission CPP2 was subject to consultation under Regulation 19 in autumn 2020. In their response
to the Regulation 19 consultation with regard to this issue, HE reiterated their previous representation
and noted that collaborative work was ongoing with the council.
33. BHCC Technical Note
3.1 To address HE’s representation on the Draft CPP2 a Technical Note was prepared by BHCC in
August 2019 which sought to explain the traffic generation changes expected from the proposed levels
of housing development in CPP2, and its forecast impacts on the A27 SRN junctions.
3.2 The Technical Note concluded that that the volume of additional trips passing through the
Trunk Road junctions in the AM and PM peak hours will not materially affect the capacity or safety of
the Trunk Road junctions within the vicinity of the city, and therefore the previously agreed mitigation
strategy and measures remain appropriate to address the forecast impacts.
3.3 The Technical Note was shared with Highways England who requested further clarity of the
impact at each junction on the SRN. It has been included as Appendix 1 to this Topic Paper.
4. Further Dialogue with Highways England
4.1 Having originally produced the Strategic Transport Assessments (STA) for CPP1 in 2012-14,
consultants Systra were commissioned to undertake the additional assessment work required to
address HE’s concerns on behalf of the Council. The ‘A27 Transport Impact Analysis – Technical Note’
was produced and supplied to HE in January 2020 and was published in full to support the Proposed
Submission City Plan Part Two. It is included as Appendix 2 of this Topic Paper. The modelling
undertaken covers five junctions along the A27 in Brighton & Hove, these are:
Junction 1- Falmer Interchange
Junction 3 – Hollingbury Interchange/Carden Avenue
Junction 4 – Patcham Interchange
Junction 5 - Devils Dyke interchange
Junction 6 – A27/A293 Interchange
The locations of these junctions are illustrated in Figure 1 below.
Figure 1: A27 Junction Locations
44.2 The analysis found that the change in anticipated trips at the A27 junctions due to the
proposals in CPP2 is relatively low, with some reductions observed, and that the revised designs for
the junctions tested are generally able to mitigate the impacts of the revised traffic flows associated
with CPP2, when compared to the results reported in the 2014 STA1.
4.3 HE confirmed that they were content that Systra’s analysis incorporated their feedback on
earlier drafts of the Technical Note. However, following further review by HE’s consultants Atkins, a
number of further technical changes to the modelling were requested. A series of exchanges between
BHCC/Systra and HE/Atkins followed during 2020 and 2021 as attempts were made to resolve
outstanding technical queries in the modelling to HE’s satisfaction.
4.4 The dialogue and recommendations at each stage during this period between HE and the
council are very technical and do not lend themselves to full reproduction, however exchanges are
summarised in Table 2. Full transcripts of the dialogue available to the inspector on request.
Table 2: Summary of dialogue between BHCC and HE following the production of the Systra
Technical Note (January 2020)
Dialogue Date Summary of Conclusion/Outcome
Atkins/HE 28/2/20 The review of the modelling process led to a request for a series of
response to detailed technical amendments to the modelling relating to all five
Systra’s junctions.
Transport
Impact Analysis It was recommended that these amendments were undertaken with
the revised results presented to HE for consideration.
Systra Response 4/3/20 SYSTRA accepted that many of the changes recommended by Atkins
to Atkins’ are compliant with best practice and in some cases would result in
Comments worsening performance results at the affected A27 junctions.
However it was considered that the amendments requested were
unlikely to change the conclusions of the original Technical Note
submitted in January 2020 (i.e. that the revised designs for the
junctions tested are generally able to mitigate the impacts of the
revised traffic flows associated with CPP2). It was therefore
considered that the modelling already undertaken was suitable for
the purposes of this stage of Plan preparation.
Email from HE to 3/4/20 Atkins advised that at least two of the junction models were
BHCC borderline in terms of capacity and so at these junctions if Atkins’
previously recommended changes would reduce performance, this
would compound an already strained situation. Some of the issues
raised in the response of 28/2/20 may not be material, however
others would be, particularly where the modelling indicated that a
junction would operate close to capacity. As such, HE requested a
more accurate depiction of each of the models and the junction
arms likely to experience delay.
Request made that the modelling be updated in line with the
recommendations of Atkins last review.
1
See conclusion at paragraph 3.1.1. of Appendix 2 of this Topic Paper.
5Dialogue Date Summary of Conclusion/Outcome
Email from 10/6/20 Systra maintained that the modelling work undertaken is sufficiently
Systra/BHCC to robust for this stage of the Plan-making process, for the reasons
HE summarised below.
In all of the junctions tested, the proposed mitigation provides
improvements on both the 2030 Design Year reference case
scenario and the results which Highways England approved in 2014
to such as degree that making all of the changes Atkins have
suggested will not result in different outcomes. A junction which
Atkins are referring to as ‘borderline’ (i.e. closest to capacity in the
future year (2030)) is Junction 3 (Hollingbury
Interchange). However, significant congestion is identified in the
PM peak scenario only, and the changes to the models which
Atkins have suggested at this junction are relatively minor. This
junction was also accepted by Highways England in 2014 as having
some arms over capacity in 2030, and so making further minor
changes would not drastically alter the level of performance
already expected and accepted.
If the junctions were to be re-modelled in line with Atkins’
requests, it should be noted that this would not actually provide
‘an accurate depiction’ of the junction’s performance (as defined
by Atkins) due to the historic data that are available to use. This
outcome could only be achieved by obtaining up-to-date survey
data which is not currently possible due to the impact of the
COVID-19 pandemic. As a result of this, and the fact that these
junctions will be modelled to a greater level of detail in the future,
it is considered reasonable to conclude that undertaking this
additional modelling task is not absolutely necessary, cost effective
or appropriate at this time.
Request made to HE to accept the modelling undertaken in
principle, on the basis of the above explanation and an
understanding that future modelling work will need to be
undertaken at a later date, as is standard practice on highways
schemes. This approach would confirm that HE is willing to accept
that CPP2’s traffic impact will ultimately be manageable at the SRN
junctions (as was previously accepted for CPP1 following the work
undertaken within the 2013 and 2014 Strategic Transport
Assessments) for the purposes of the City Plan process.
HE/Atkins 1/7/20 The previously highlighted issues have the potential to change the
response modelling outputs and therefore the conclusions reached at four of
the junctions, leading to the conclusion that the modelling is not
acceptable in its current form and should be updated at 3 of the
junctions (J3 Hollingbury Interchange; J5 Devils Dyke; and J6–
A27/A293 Junction), and should potentially be updated at a 4th
junction (J4-Patcham Interchange). Therefore, HE still has associated
concerns and requests that this matter is reconsidered.
6Dialogue Date Summary of Conclusion/Outcome
Meeting 3/11/20 A meeting took place to discuss the outstanding points of
disagreement.
Email from HE to 6/11/20 Further to the meeting on 3/11/20, HE/Atkins undertook an internal
BHCC review of the previous modelling reviews sent on 28/2/20 and
1/7/20, particularly with regard to the concerns around the
modelling J4-Patcham Interchange and J5-Devils Dyke Rd.
The review confirmed that the issues raised previously are
significant enough for Highways England to be concerned about the
accuracy of the results presented for J3, J4, J5 and J6.
HE consultation 23/11/20 “Highways England is continuing to liaise with Brighton and Hove
response at Reg. City Council and their transport consultants Systra with regard to the
19 stage supporting Transport Evidence Base. With regard to the Transport
Topic Paper submitted, whilst Highways England has accepted the
methodology, we have expressed concerns with the modelling
undertaken that are still to be resolved. Until the outstanding
matters relating to the modelling are resolved, Highways England is
not able to accept the Transport Assessment in support of the City
Plan Part 2 and therefore the CPP2 itself. Accordingly, we are not
satisfied that CPP2 will not have a detrimental impact on the
Strategic Road Network (the tests set out in DfT Circular 02/2013,
particularly paragraphs 9 & 10, and MHCLG NPPF2019, particularly
paragraphs 108 and 109).”
BHCC/Systra 21/1/21 A further Technical Note with modelling updated as requested by HE
response to was provided. The analysis of the updated modelling demonstrated
6/11 email that feasible mitigation designs exist for all of the junctions which
could sufficiently accommodate the traffic levels associated with
CPP2, with performance levels generally improved on those
previously accepted by HE. It was therefore considered that an
acceptable mitigation design exists for all of the junctions which
achieves ‘nil detriment’ against the June 2014 STA results and the
2030 reference case.
HE/Atkins 10/2/21 In relation to the models for junctions J4, J5 and J6, it is likely that
response these amendments will result in a reduction in the efficiency of the
junctions which is why certainty is required that the proposed
junction mitigations are still fit for purpose.
In addition, the proposed mitigation outlined for J3 Carden Avenue
did not appear to be sufficient to cope with the proposed traffic
demand and necessitates further mitigation/consideration.
Request that the Atkins report is reviewed, the further requested
amendments are undertaken, and the revised modelling results and
any further mitigation required presented to Highways England for
further consideration.
BHCC/Systra 24/2/21 An updated version of the Technical Note from January 2021 was
response provided which demonstrates that all additional changes requested
in Atkins’ February 2021 review have been applied and provided in
the updated modelling results.
7Dialogue Date Summary of Conclusion/Outcome
The analysis of the updated modelling continued to demonstrate
that feasible schemes exist for all of the junctions which represent
satisfactory mitigation of CPP2’s traffic impact upon the SRN, with
performance levels generally improved on those previously
accepted by HE in their 2014 review. The changes requested by
Atkins did not alter any of the conclusions previously drawn in terms
of the overall performance of the proposed mitigation schemes, and
the proposed schemes represent the best options which are
available within the various acknowledged constraints to the HE and
BHCC road networks. Issues relating to safety and deliverability of
the proposed schemes were addressed to a level which is
considered to be suitable for the purpose of Highways England’s
response to the City Plan examination.
With regards to the mitigation for J3 Carden Avenue, the modelling
demonstrated that a suitable arrangement is possible which ensures
the safe operation of both A27 slip roads, with improved
performance on the A27 eastbound off-slip compared to the results
provided by SYSTRA in January.
HE/Atkins 17/3/21 Systra’s revised modelling for the proposed scenarios indicates that:
response J3 Carden Avenue - three of the local roads operate
overcapacity while the A27 westbound offslip operates at
97.6% which is over the recommended 90% threshold. The
current non-optimised modelling is deemed unrealistic as
the Degree of Saturation (DoS) and queue results for the
local network greatly exceed capacity thresholds.
Addressing this issue with optimisation subsequently causes
significant impact to the SRN particularly on the A27
westbound off-slip. Therefore, the proposals for this
junction do not appear appropriate.
J4 Patcham Interchange - The AM modelling has two links
that operate over the recommended 90% DoS threshold and
one link that exceeds 100% DoS. The PM peak modelling has
two links that exceed 100% DoS.
J5 Devils Dyke - The AM modelling indicates two links that
operate over the recommended 90% DoS threshold and one
link that exceeds 100% DoS. The PM modelling has two links
that exceed the 90% recommended DoS threshold.
J6 A27 & A293 - The degree of saturation values in the two
modelled scenarios are all within the recommended 90%
DoS threshold
Overall, junction comparisons with the June 2014 STA modelling are
as folows:
• J3 performs worse, particularly on the southern part of the
junction.
• J4 has a mixture of links that perform better and worse.
8Dialogue Date Summary of Conclusion/Outcome
• J5 performs better.
• J6 performs better
The concerns expressed will need further consideration.
5. Conclusions
5.1 As can be seen from the above summary of ongoing dialogue, extensive, detailed technical
work has been undertaken over a considerable period to positively address HE’s concerns and to seek
to resolve them to their satisfaction. It has not been possible to resolve all issues - HE maintains
concerns related to the performance of Junction 3 and to a more limited extent Junction 4 compared
with the June 2014 STA modelling, as summarised in the final row of Table 2 above. The council does
not consider it appropriate to delay the plan-making process further given the volume of work that
has already been undertaken on this issue and the limited areas of outstanding disagreement.
5.2 The council remains confident that the work undertaken by Systra provides robust evidence
that feasible junction amendment schemes exist for all junctions which represent satisfactory
mitigation of the traffic impacts of the site allocation proposals within CPP2 upon the Strategic Road
Network, with performance levels generally improved on those previously accepted by Highways
England in their 2014 review of the CPP1 evidence base.
5.3 The council is therefore seeking to agree a Statement of Common Ground with HE to clearly
identify areas of agreement and the remaining points of concern.
9Appendix 1: City Plan Part 2 Strategic Transport Assessment:
Technical Note (August 2019)
SECTION 1: BACKGROUND AND CONTEXT
The Brighton & Hove City Plan Part One [CPP1] was adopted in March 2016 and sets out the strategic
policy framework to guide the new development required across the city to 2030. The CPP1 sets the
overall amounts of development to be planned for (e.g. housing, employment and retail) and the
broad locations and Development Areas where new development will take place.
It allocates key strategic sites and also sets out key strategic policies to guide future development
including policies for urban design, transport, affordable housing, biodiversity and sustainability. This
strategic framework is now part of the statutory Development Plan for Brighton & Hove.
Policy CP1 relates to housing delivery and states that “the council will make provision for at least
13,200 new homes to be built over the plan period 2010 – 2030 (this equates to an annual average
rate of provision of 660 dwellings).” Strategic allocations are included in CPP1 which cumulatively total
3,635 additional new homes.
Policy CP1 sets out that delivery of new housing is to be in line with the following distribution:-
Area / Source of Supply No. of new homes
Development Areas
DA1 – Brighton Centre and Churchill Square Area 20
DA2 – Brighton Marina, Gas Works and Black Rock Area 1,940
DA3 – Lewes Road Area 875
DA4 – New England Quarter and London Road Area 1,130
DA5 – Eastern Road and Edward Street Area 515
DA6 – Hove Station Area 525
DA7 –Toad’s Hole Valley 700
DA8 – Shoreham Harbour 300
Development Area Total 6,005
Development Across Rest of City:
Within the built-up area 4,130
Within the urban fringe 1,060
Small identified sites 765
Small windfall development 1,250
TOTAL 13,2102
During the preparation of CPP1 collaborative work was undertaken between the Highways Agency
[HA] (now known as Highways England) and the city council and its modelling consultant, JMP.
2013 Strategic Transport Assessment
2
The figures in the table total 13,210 dwellings against the policy target of at least 13,200 new homes.
10Work was commissioned on a Strategic Transport Assessment [STA] after consultation in summer
2012. JMP started work on the STA in July 2012 following consultation on the draft City Plan (February
to April). As part of the scoping for the STA, it was agreed that a Forecasting Report and Local Model
Validation Report (LMVR) would be developed and submitted to the HA for agreement, and that
individual models may also be required for more detailed analysis of the A27 Strategic Road Network
[SRN] junctions. In December 2012, an officer meeting was held with the HA about the proposed
mitigation strategy to be included in the modelling.
The HA was consulted as a key stakeholder and the following was discussed and agreed:
evidence base
trip rates
development scenarios
forecasting methodology
examination of impacts on the Strategic Road Network (SRN); and
scope for mitigation for the SRN.
The draft STA was agreed by the council in January 2013 with the submission City Plan, and finalised in
May 2013. It should be noted that this initial STA was predicated on the lower housing target of 11,300
as per the Submission version of the CPP1. It is a critical part of the evidence base for the City Plan. It
forecasts journeys under a number of time periods and scenarios to assess the impact of the
development proposals in the City Plan. It demonstrates that the 2030 City Plan Mitigation Strategy
will help to manage, alter or reduce journey patterns in the city and minimise and manage the impacts
and flow of vehicular trips on the adjacent strategic road network.
In response to public consultation on the submission version of the City Plan, the Highways Agency
submitted comments on 16 April 2013 raising concerns about the soundness of the City Plan (Appendix
1). Although the letter supported the overall strategy in the City Plan and confirmed joint working had
taken place, it raised concerns about the need to see detailed modelling and junction layouts for the
SRN junctions to demonstrate improvements could be undertaken. Further work was therefore
undertaken by the council/JMP. The junctions tested were:-
A293 (Hangleton Link)
A2038 (King George VI Avenue)/Dyke Road Avenue
A23 (London Road)
Hollingbury/Ditchling Road (Coldean Lane)
B2123 (Falmer Road) (within East Sussex [ESCC])
In April 2013, a meeting was held with the HA to review the detailed modelling work undertaken on
the SRN junctions on behalf of the city council by JMP.
Following the meeting it was agreed that options for improving the capacity of the A27 Trunk Road
junctions should be included in the final version of the STA and that the HA would confirm it was
satisfied with transport evidence and mitigation measures. The STA was amended and finalised and a
further letter received from the Highways Agency (Appendix 1) confirming support for the City Plan.
June 2014 STA Addendum post-Urban Fringe Study
11Modifications to the CPP1 agreed during the examination process resulted in an increase in the housing
target to 13,200 dwellings.
The update to the May 2013 STA considered the impact of this increase in the housing target by
approximately 1,900 units to 13,200 units based on:-
i) Windfall Allowance in first 10 years - approximately an additional 650 units; and
ii) Urban Fringe sites – the maximum expected was approximately 1060 additional units
The study objectives included:-
understanding the transport impacts of the updated development strategy detailed in the City
Plan Part 1 including potential highway and public transport impacts and associated
constraints on travel; and
identifying the level of additional mitigation required beyond that already proposed (if any).
The STA was revised and an Addendum was produced in 2014. The study concluded that the original
mitigation strategy, including the A27 junction improvements developed in conjunction with the HA,
had been tested further and demonstrated that the conclusions drawn for the May 2013 STA were still
valid. Therefore, the package of junction improvements that had been identified and discussed with
the HA would enable traffic to join or leave the A27 more efficiently, with no detrimental impact on
the safety and efficiency of the mainline carriageway.
The HA confirmed that it supported the transport strategy in the City Plan; that it is satisfied there will
be no harmful impact on Trunk Road junctions as a result of the strategy; and that the evidence
underpinning the Plan in the STA is sound (Appendix 1). The HA was satisfied with the sustainability
of the Spatial Strategy outlined in the City Plan and therefore that the Plan was sound.
Conclusions
Sufficient work on the mitigation measures was therefore undertaken at this stage of the planning
process, and the assumptions and models used by the council to assess impacts and help define
mitigation measures were fit for purpose.
Furthermore, it was recognised that detailed transport and traffic studies for planning applications will
be required when sites come forward, but the adopted CPP1 proposals were appropriate and
deliverable, subject to funding contributions from third parties.
As such, the council was satisfied that the planned growth in the City Plan, including increased housing
provision, could be delivered, subject to continued working with the HA (now HE) on the Trunk Road
junction designs; and that the spatial strategy that underpins the City Plan is the most sustainable
approach to accommodating growth within Brighton & Hove. The approach adopted by Brighton &
Hove in developing the City Plan was sound and consistent with the HA's view of best practice in
ensuring that development, especially housing, is planned in a way that encourages more sustainable
travel patterns and behaviours.
In considering the background to this work on CPP1 as it evolved over time, it is noted that there was
some variation between the quantums of housing proposed for each site in the submission City Plan
compared to that proposed within Draft City Plan in May 2012. The HA was satisfied at that time that
the changes were unlikely to have an impact on the overall level of traffic utilising the SRN given that
the changes only affected the city centre development allocations, and not the ‘out of town’ sites
(Appendix 1).
1213
SECTION 2: CITY PLAN PART TWO
The role of the City Plan Part Two [CPP2] is to support the implementation and delivery of CPP1. It
builds on the strategic policy framework set out in CPP1 by identifying and allocating additional
development sites and sets out a detailed development management policy framework to assist in
the determination of planning applications. It is consistent with the vision, strategy, objectives and
strategic policies set out in CPP1; and it will cover the period up to 2030. A number of site allocations
(e.g. for housing and mixed use sites) are included through Policies H1, H2 and SSA1 – 7 so that the
CPP1 strategy for accommodating development needs can be implemented.

Table 2.1 below indicates the proposed changes in housing provision between CPP1 and CPP2. It
should be noted that the total amount of planned housing on the urban fringe has reduced from the
assumed 1,060 dwellings in CPP1 to just over 900, a reduction of 15% (160 dwellings).

Following the publication of CPP2 for consultation in July 2018, HE submitted a representation with
specific reference to Policies H1 and H2 which focus on proposed housing development allocations,
including the Urban Fringe (see CPP2 Table 5 - Residential Site Allocations, Table 6 - Mixed Use Site
Allocations and Table 7 – Urban Fringe Allocations. HE has sought confirmation of the likely cumulative
impacts of the proposed development sites in order that it can be confident that the agreed Trunk
Road junction mitigations remain valid. If this is not considered to be the case, further consideration
of appropriate mitigation may be required.

This document therefore explains the basis of the assessment of the changes in traffic generation of
the proposed levels of housing development in CPP2, and its forecast impacts on the A27 Trunk Road
junctions.

                                                   14
Table 2.1 - Changes in Planned Housing Development
Area/Source of Supply No. of new homes No. of new homes Difference
(City Plan Part One) (City Plan Part Two)3
Development Area
DA1 – Brighton Centre 20 0 -20
and Churchill Square
Area
DA2 – Brighton Marina, 1,940 1696 -244
Gas Works and Black
Rock Area
DA3 – Lewes Road Area 875 590 -285
DA4 – New England 1,130 1,130 0
Quarter and London
Road Area
DA5 – Eastern Road and 515 427 -88
Edward Street Area
DA6 – Hove Station Area 525 789 +264
DA7 – Toads Hole Valley 700 700 0
DA8 – Shoreham 300 335 +35
Harbour
Development Area Total 6,005 5,667 -338
Development Across the Rest of the City
Strategic Site Allocations
outside of DAs
SSA1 – Brighton General 0 200 +200
Hospital
SSA3 - Lyon Close, Hove 0 300 +300
Other development 4,130 4,014 -116
within the built-up area
Within the urban fringe 1,060 902 -158
Small identified sites 765
Small windfall 1,250 2,606 +591
development
Other Development 7,205 8,022 +817
Total
OVERALL TOTAL 13,210 13,689 +479
The information summarised above illustrates that the change in the amount of proposed, planned
housing development is minimal overall (a 4% (479) increase in dwellings from the original quantum
in CPP1). These figures include some clear increases and decreases in the distribution of development
across the city. In addition to the previously identified Development Areas, there are 4 Strategic Site
Allocations [SSAs], two of which are within the DAs (SSA2 - Combined Engineering Depot within DA4
New England Quarter and London Road, and SSA4 Sackville Trading Estate within DA6 Hove Station).
The other two SSAs are SSA1 – Brighton General Hospital, and SSA3 - Lyon Close, Hove.
3
Source – BHCC Housing Provision Topic Paper, 2018
1516
SECTION 3 – ASSESSMENT OF CHANGES TO DEVELOPMENT PROPOSALS WITHIN CPP2
Most of the proposed changes in housing provision that are within the built-up area will be likely to
be flats, to enable appropriate densities to be achieved. These developments will also generally
include:-
standard parking set at maximum levels and minimums for disabled driver parking (as defined
within the council’s Parking Standards for new development (SPD14));
good access to sustainable and public transport (especially train stations for longer distance
journeys e.g. Brighton and Hove); and
Travel Plans and other associated travel reduction measures
Similar measures have been modelled within the original 2013, and 2014 Addendum, STAs and their
combination will minimise the additional site-based, longer distance car-borne journeys that could
pass through the Trunk Road junctions during the busy AM and PM weekday peak hour periods.
In addition, there are newly identified sites within the allocated CPP2 housing numbers that will
include housing as part of mixed-use development, such as SSA1 and SSA3. This housing will form part
of existing brownfield sites, and therefore there will be a net change in trip generation, including by
car/vehicle, rather than a wholesale increase (which would only be the case if the site was
‘greenfield’). For the purposes of this assessment, the gross increase in trips has been assessed.
These sites will also provide a mix of local housing and local employment/community uses that will
also minimise the likely generation of car/vehicular trips that could have an impact on the Trunk Road
junctions.
To assess the proposed changes in the development set out in Table 2.1 above within the city, a high
level, desktop assessment has been carried out. This assessment is considered to be proportionate,
given the scale of change of the development quantum and therefore the likely impacts on the Trunk
Road junctions. This assessment is set out in the following section.
In terms of the net changes that are proposed, the specific sites that will reduce in size by in excess of
200 units and therefore result in a reduction in vehicular trips passing through the Trunk Road
junctions at peak times are as follows:-
DA2 – Brighton Marina, Gas Works and Black Rock Area;
DA3 – Lewes Road Area.
Those specific sites that that will increase in size by in excess of 200 units and therefore generate a
likely increase in vehicular trips passing through the Trunk Road junctions at peak times are as follows:-
DA6 – Hove Station Area
In overall terms, the quantum of planned housing development within the DAs will reduce by over
330 dwellings.
Regarding other sites, in addition to the newly allocated sites, SSA1 and SSA3, resulting in an additional
500 dwellings being allocated, there are other forecast changes in housing which result in an additional
total increase in dwellings of just over 800. The total net change across the city is therefore a forecast
increase of nearly 480 dwellings across the city.
Trip generation/attraction
17In order to provide a robust and consistent comparison with the work undertaken for the 2013 and
2014 STAs to support CPP1, the same trip generation levels have been used as calculated for the
assessment of the additional Urban Fringe Sites. As stated in the 2014 STA Addendum (Section 3,
Tables 3.2 and 3.3), 2011 journey to work census data for the city indicated that movement by car had
decreased by 6% on average, when compared with 2001 data. When combined with TRICS data, it
was concluded that residential trip rates would be the same or less than those used in 2013, and
therefore the use of previous trip rates would present a worst case scenario in terms of assessing trip
generation.
In summary, the average trip rates for car journeys from residential development per dwelling
(rounded to 1 decimal place) used in the 2014 STA Addendum were as follows.
AM Peak Hour PM Peak Hour
Arrivals Departures Arrivals Departures
0.1 0.2 0.3 0.2
To help illustrate the forecast trip generation from larger numbers of dwellings, the following trip
rates for car journeys from residential development based on the 2014 STA addendum would be as
follows, including the largest, single net increase in residential development of +300 (SSA3-Lyon Close,
Hove).
Number of AM Peak Hour PM Peak Hour
dwellings
Arrivals Departures Arrivals Departures
1 0.1 0.2 0.3 0.2
10 1 2 3 2
20 2 4 6 4
30 3 6 9 6
40 4 8 12 8
50 5 10 15 10
100 10 20 30 20
150 15 30 45 30
200 20 40 60 40
300 30 60 90 60
2011 Census data also indicate the proportion of journeys to work undertaken by different forms of
transport including driving a car or van, and the distance travelled (including bands of 10km-30km (6.2
miles-18.6 miles) and 30km+ (18.6 miles+)) for each ward. These data are summarised in Appendix 2.
Examples of destinations which are employment centres within the Greater Brighton City Region and
help approximately illustrate the extent of these distances by road from the city centre include:-
13km/8 miles – Shoreham and Lewes
19kms/12 miles – Burgess Hill and Worthing
30kms/19 miles – Haywards Heath and Eastbourne
Journeys of 30km+ would include a much wider range of many more destinations over a much wider
area within the south-east, or beyond.
18Assessment of impacts
The implications of the proposed CPP2 development levels have been considered using a number of
factors or criteria. These have included:-
Checking local traffic flows trends at sites where the council has ATC sites. For example, in the
west, King George VI Avenue – 16 Hour AADTs have not changed between 2015 and 2018, and
Old Shoreham Road (west of Hangleton Link Road) 16 Hour AADT has reduced by 1300 between
2015 and 2018.
Assessing [DA] sites’ proximity to the five Trunk Road junctions and therefore the likelihood of
additional traffic generation through them.
Assuming housing will primarily generate outbound AM peak hour trips and inbound PM peak
hour trips, a proportion of which could be expected to pass through the Trunk Road junctions
Assuming that the inbound AM and outbound PM peak hour trips generated by housing will
predominantly be associated with local activity, rather than longer distance, strategic trips
Adopting trip generation characteristics and patterns, as established within the 2013 STA and the
2014 Addendum
Assessing the likely distribution of trips from the sites to the Trunk Road junctions based on one
or two (‘primary’ and secondary’) junctions – those being the closest to each site and therefore
most likely to be used to access the Trunk Roads to travel west, east or north.
The likely basis on which additional trips generated by the CPP2 proposals may have an impact on the
A27 SRN Trunk Road junctions has been assessed by using the following additional assumptions:-
1) calculating the likely change in trip generation from each site that includes a change in
development quantum between CPP1 and CPP2, utilising trip generation calculations that
were established within the STAs produced for CPP1; and
2) assuming that any journey to work trip in excess of 10km would need to access the Trunk Road
network.
To provide a robust and comparative assessment, two scenarios have been assessed:-
1) identifying the two nearest junctions to the site (as the ‘primary’ and secondary’ junctions)
that would be used to access the Trunk Road and assigning all the net changes in trips equally
(50:50) between those two junction(s), with reference to the forecast distribution of
development trips as set out in Appendix E of the original CPP1 STA; and
2) assigning all the net changes in trips equally between all five junctions that would be used to
access the Trunk Road.
The first scenario is considered to be the most realistic in terms of assessing likely impacts (Appendix
3B). The second scenario includes an alternative, broader, but more uniform distribution of trip
patterns across all of the Trunk Road junctions in order to provide a basis for comparison (Appendix
3C).
The results of this scenario testing assessment are considered to be a worst case scenario and
therefore provide a robust assessment because:-
1) the city is approximately 6.5kms (4 miles) deep (south to north) and 13kms (8 miles) wide
(east to west) and therefore some journeys by car from housing sites within the city could
exceed 10kms (6 miles)) but may not leave the city and therefore would not access the Trunk
Road via any of the five junctions. Examples could include Saltdean to Hove or Rottingdean
to Portslade.
192) journeys in excess of 10kms from those sites which are more central within the city (and
therefore further from the A27 Trunk Road) will have access to more alternative east-west
routes such as the A259 and the A270, especially in the west of the city, may not all use the
Trunk Road junctions to reach their destinations because more route options are available;.
The outcome and conclusions of these assessments are summarised in the following section of this
report and outline the likely impacts of the proposed CPP2 housing allocations on the peak hour
capacity and operation of the five Trunk Road junctions serving the city.
SECTION 4: CONCLUSIONS
This high level, strategic, robust and proportionate assessment has enabled the net changes in trip
generation resulting from changes in housing allocations and distribution between CPP1 and CPP2 to
be evaluated. Two trip distribution scenarios have been tested, of which Scenario 1 is considered to
be the most robust.
Appendices 3A and 3B within this report indicate that, when compared to the development proposals
within the adopted CPP1, the three junctions to the north and east of the city:-
A23 (London Road)
Hollingbury/Ditchling Road (Carden Avenue/Coldean Lane)
B2123 (Falmer Road) (within East Sussex [ESCC])
are likely to experience reductions or minimal increases in trips passing through them as a result of
the proposed CPP2 housing development allocations. The capacities and performance of these
junctions, and therefore the mitigation schemes agreed for them, are therefore unlikely to be
significantly affected by the CPP2 proposals.
Appendices 3A and 3B also show that, when compared to the development proposals within the
adopted CPP1, the Trunk Road junctions which are most likely to be used by additional, longer distance
trips leaving (in the AM peak hour) and returning to (in the PM peak hour) the city from the proposed
CPP2 allocations of housing are:-
A293 (Hangleton Link)
A2038 (King George VI Avenue)/Dyke Road Avenue
Further assessment of these two junctions has therefore been undertaken in order to assess the
impacts of the additional trips resulting from the proposed CPP2 allocations of housing. The likely
increases in vehicle trips that will occur in the AM and PM peak hours approximately amount to an
average 1 additional vehicle per minute joining the Trunk Road in the AM peak hour, and an average
of almost 2 vehicles per minute in the PM peak hour leaving the Trunk Road.
In the AM peak hour, all additional trips are assumed to approach the Trunk Road junctions via a single
local road. At the A293 (Hangleton Link) junction this will be via the A293. At the A2038 (King George
VI Avenue)/Dyke Road Avenue junction, this will be via the A2038 (King George VI Avenue).
In the PM peak hour, the additional trips that return to the city and pass through the Trunk Road
junctions to join the local road network are assumed to be split 50:50 between a western and an
eastern approach to the junction. These assumptions are summarised in the Tables 4.1 below.
20Table 4.1 – Trip Assignment Assumptions
A293 (Hangleton Link) A2038 (King George VI
Avenue)/Dyke Road Avenue
Total AM outbound 100% of trips approach A27 from A293 100% of trips approach A27 from
Hangleton Link Road northbound and A2038 (King George VI Avenue)
enter southern roundabout northbound and enter southern
roundabout
AM outbound 50% of trips join A27 via the westbound 50% of trips join A27 via the
towards west on-slip road westbound on-slip road
AM outbound 50% approach northern roundabout on 50% approach northern
towards east A293 under bridge and join A27 Road via roundabout on Devil’s Dyke Road
the eastbound on-slip road over under bridge and join A27 via
the eastbound on-slip road
PM inbound from 50% of trips approach junction via A27 50% of trips approach junction via
west eastbound off-slip road and enter A27 eastbound off-slip road and
northern roundabout enter northern roundabout
PM inbound from 50% of trips approach junction via A27 50% of trips approach junction via
east westbound off-slip road and enter A27 westbound off-slip road and
southern roundabout enter southern roundabout
Total PM inbound 100% of trips leave A27 and join A293 100% of trips leave A27 and join
Hangleton Link Road southbound A2038 (King George VI Avenue)
southbound
Based on the trip generation figures calculated in Appendix 3B, the trips that will enter the Trunk Road
junctions in the AM and PM peak hours are outlined below. The RFCs/Degrees of Saturation that were
outputs from the models used to produce the 2014 STA Addendum are also shown in the Tables 4.2
and 4.3 below.
21Table 4.2 – Trip Assignment for A293 (Hangleton Link) junction
A293 (Hangleton Link)
Direction Number of Junction with Junction arm entry RFC in 2014 STA
additional A27 Addendum
trips (Appendix E)
AM outbound +38 Southern - -
towards west roundabout
(50%)
AM outbound +38 Northern A293 northbound 1.15
towards east (50%) roundabout under bridge
Total AM outbound +76 Southern A293 northbound 1.09
(100%) roundabout
PM inbound from +57 Northern A27 eastbound off- 1.05
west (50%) roundabout slip road
PM inbound from +56 Southern A27 westbound off- 1.08
east (50%) roundabout slip road
Total PM inbound +113 Southern A293 southbound -
(100%) roundabout
For the A293 (Hangleton Link Road) junction, the assessment indicates that there could be some
further, minor reduction in capacity on the local approach roads over and above that calculated in
2014. This is a result of up to one additional vehicle per minute on average passing through each arm
of the junction in the AM and PM peak hours. Although all four entry arms to the junction that have
been assessed are forecast to have an RFC over 1.00 in the 2014 Addendum, the effects associated
with the CPP2 housing development proposals on the operation of the junction are expected to be
negligible, over and above that which has already been assessed and agreed.
22Table 4.3 – Trip Assignment for A2038 (King George VI Avenue)/Dyke Road Avenue
A2038 (King George VI Avenue)/Dyke Road Avenue
Direction Number of Junction with Junction arm entry Degree of
additional A27 saturation/RFC in
trips 2014 STA
Addendum
(Appendix E)
AM outbound +35 Southern - -
towards west roundabout
(50%)
AM outbound +35 Northern Devil’s Dyke road 0.52
towards east roundabout northbound over
(50%) bridge
Total AM +70 Southern A2038 northbound 0.93
outbound (100%) roundabout
PM inbound from +52 Northern A27 eastbound off- 0.90
west (50%) roundabout slip road
PM inbound from +52 Southern A27 westbound off- 1.05
east (50%) roundabout slip road
Total PM +104 Southern A2038 southbound -
inbound (100%) roundabout
For the A2038 (King George VI Avenue)/Dyke Road Avenue junction, the assessment indicates that
there may be some small, further reduction in capacity over and above that calculated in 2014
additional as a result of up to one additional vehicle per minute on average passing through each arm
of the junction in the AM and PM peak hours. Three out of the four entry arms to the junctions that
have been assessed have an RFC/Degree of saturation of less than 1.00, and therefore the overall
impact of the CPP2 housing development proposals is expected to be minimal, over and above that
which has already been assessed and agreed.
Conclusions
Further work will still be required as planning applications for individual sites come forward. Where
junction mitigation measures include traffic signals, the technology utilised will be ‘intelligent’ in terms
of ensuring that demands for vehicle and people movement are detected and therefore managed
efficiently in order to minimise congestion and delay.
However, in overall terms it is concluded that this assessment has demonstrated that the volume of
additional trips passing through the Trunk Road junctions in the AM and PM peak hours will not
materially affect the capacity or safety of the Trunk Road junctions within the vicinity of the city, and
therefore the previously agreed mitigation strategy and measures remain appropriate to address the
forecast impacts.
23Appendix 2: Systra A27 CPP2 Transport Impact Analysis (January
2020)
2425
A27 CPP2 Transport Impact Analysis   19/11/2019
Reference Number 109418

A27 CPP2 TRANSPORT IMPACT ANALYSIS
TECHNICAL NOTE
A27 CPP2 TRANSPORT IMPACT ANALYSIS
TECHNICAL NOTE
  IDENTIFICATION TABLE
   Client/Project Owner      BHCC

   Project                   A27 CPP2 Transport Impact Analysis

   Type of Document          Technical Note

   Status                    Draft Report

   Date                      19/11/2019

   Reference Number          109418

  APPROVAL
  Version    Name                             Position        Date      Modifications

             Author       Peter May           Consultant   25/10/2019

                                              Associate                 Draft for Client
     1       Checked      Hazel Morton                     25/10/2019
                                              Director                  Comment

             Approved     Jamshid Soheili     Director     25/10/2019

             Author       Peter May           Consultant   28/10/2019
                                                                        Updated Draft
                                                                        including
    1a       Checked      Jamshid Soheili     Director     28/10/2019
                                                                        completed
                                                                        Table 4.
             Approved     Jamshid Soheili     Director     28/10/2019

             Author       Peter May           Consultant   19/11/2019

                                                                        Draft including
                                                                        further
    1b       Checked      Jamshid Soheili     Director     19/11/2019
                                                                        modelling of J3
                                                                        and J5.

             Approved     Jamshid Soheili     Director     19/11/2019
1. INTRODUCTION
1.1 Background
1.1.1 SYSTRA Ltd (SYSTRA) has been commissioned by Brighton and Hove City Council (BHCC) to
provide input to the assessment of the transport implications associated with the
implementation of the Council’s latest strategic policy framework, known as City Plan Part
Two (CPP2). As part of CPP2, the total amount of planned housing on the urban fringe of
Brighton is proposed to reduce from the assumed 1,060 dwellings in CPP1 to just over 900, a
reduction of 15% (160 dwellings).
1.1.2 Following the publication of CPP2 for consultation in July 2018, Highways England submitted
a representation seeking confirmation of the likely cumulative impacts of the proposed
development sites in order that it can be confident that the agreed Trunk Road junction
mitigations designed to accommodate the implications of City Plan Part 1 (CPP1) remain valid.
BHCC has produced a Technical Note setting out a methodology for assessing quantifying the
traffic associated with the proposed housing changes in CPP2, and its forecast impacts on the
A27 trunk road junctions. Highways England has provided commentary on the proposed
methodologies and requested changes and further clarity of the impact at each junction.
Having originally produced the Strategic Transport Assessments (STA) for CPP1 in 2012-14,
SYSTRA has therefore been commissioned to undertake the additional assessment work on
behalf of BHCC.
1.2 Report Purpose
1.2.1 This document provides the outcomes of the work undertaken in response to the comments
made by Highways England on the BHCC Technical Note, and sets out initial findings regarding
the anticipated impacts at the A27 trunk road junctions.
1.2.2 As part of this work, SYSTRA has also undertaken a validation exercise of the mitigation
schemes previously proposed for the A27 Junctions in 2012-14 to determine their suitability
and compliance with updated design guidance. It should be noted however that the
mitigations schemes previously proposed were for the purposes of high level feasibility only,
and that any changes recommended in this document remain at this level of detail and will
require further assessment work at a later date.
1.2.3 It is noted that tables within this report have been presented as per the previous STA reports,
and so Junctions 9 and LinSig results are presented together to facilitate comparisons being
made.
A27 CPP2 Transport Impact Analysis
Draft Report
Technical Note 24/10/2019 Page 3/192. RESPONSES TO HIGHWAYS ENGLAND COMMENTS
2.1 Trip Generation
2.1.1 Highways England commented:
“Highways England is concerned that the AM Peak Hour trip rates and generation are
low, especially when compared to the PM Peak Hour trip generation. Applied to the
additional 479 dwellings in CPP2, this equates to a difference of 96 trips between peaks.
As such and for robustness, we feel that it would be more appropriate for the PM Peak
Hour trip rates to be used in reverse during the AM Peak Hour (i.e. 0.3 departures and
0.2 arrivals)”
2.1.2 While it should be noted that these trip rates were used and accepted as part of the previous
two STAs (2013 and 2014), SYSTRA has undertaken a sensitivity test based on the trip rates
suggested by Highways England, as shown below:
Table 1. Trip Rates Changes
Previous Residential Trip Rates
AM Peak Hour PM Peak Hour
Arrivals Departures Arrivals Departures
0.1 0.2 0.3 0.2
Revised Residential Trip Rates
AM Peak Hour PM Peak Hour
Arrivals Departures Arrivals Departures
0.2 0.3 0.3 0.2
2.1.3 The revised trip rates above have been used for all subsequent assessments described in this
report.
2.2 Trip Distribution
2.2.1 Highways England commented:
“Trip Distribution – Highways England notes that Scenario 1 has been assessed as it is
considered more robust than Scenario 2. However, we are still concerned that the
distribution in Scenario 1 underestimates the impact of the additional 479 dwellings in
CPP2 and is unrealistic. This is for 2 reasons:
- The impact has automatically been spread across 2 junctions, thereby potentially
underestimating the impact of development trips at the nearest/most logical
junction; and
- The distribution in Table 4.1 automatically assumes that 50% would travel West and
50% travel East even though the routing may be illogical (for example, traffic from
DA6 Hove Station travelling to the A293 junction to travel east when it would be
more logical to travel to the A2038 junction to travel east).
As such, we request that the distribution exercise is revised to consider a more robust
impact at the nearest/most logical single SRN junction. Where it is not obvious which is
the nearest/most logical junction, we would accept the impact being distributed across
2 junctions but this should be proportionate and not necessarily 50:50. Similarly, once
A27 CPP2 Transport Impact Analysis
Draft Report
Technical Note 19/11/2019 Page 4/19it has been determined how many development trips would impact a particular
junction, they should be distributed logically and not just 50:50 East:West.”
2.2.2 SYSTRA has undertaken an assessment of the development trips using Scenario 1, but with
100% of the trips changing as a result of CPP2 using a single trunk road junction instead of
two as requested. The junction chosen is the ‘primary’ trunk road junction identified in
Appendix 3A of the BHCC Technical Note in the first instance, as this was believed to be chosen
originally due to being the most logical/nearest SRN junction. The updated table from
Appendix 3A is shown overleaf in Table 2.
A27 CPP2 Transport Impact Analysis
Draft Report
Technical Note 19/11/2019 Page 5/19You can also read