Travertine crystal growth ripples record the hydraulic history of ancient Rome's Anio Novus aqueduct
←
→
Page content transcription
If your browser does not render page correctly, please read the page content below

www.nature.com/scientificreports
OPEN Travertine crystal growth ripples
record the hydraulic history
of ancient Rome’s Anio Novus
aqueduct
Duncan Keenan‑Jones1*, Davide Motta2*, Marcelo H. Garcia3, Mayandi Sivaguru4,
Mauricio Perillo5, Ryan K. Shosted6 & Bruce W. Fouke3,7,8,9,10
Travertine crystal growth ripples are used to reconstruct the early hydraulic history of the Anio Novus
aqueduct of ancient Rome. These crystalline morphologies deposited within the aqueduct channel
record the hydraulic history of gravity-driven turbulent flow at the time of Roman operation. The
wavelength, amplitude, and steepness of these travertine crystal growth ripples indicate that large-
scale sustained aqueduct flows scaled directly with the thickness of the aqueous viscous sublayer.
Resulting critical shear Reynolds numbers are comparable with those reconstructed from heat/
mass transfer crystalline ripples formed in other natural and engineered environments. This includes
sediment transport in rivers, lakes, and oceans, chemical precipitation and dissolution in caves,
and melting and freezing in ice. Where flow depth and perimeter could be reconstructed from the
distribution and stratigraphy of the travertine within the Anio Novus aqueduct, flow velocity and
rate have been quantified by deriving roughness-flow relationships that are independent of water
temperature. More generally, under conditions of near-constant water temperature and kinematic
viscosity within the Anio Novus aqueduct channel, the travertine crystal growth ripple wavelengths
increased with decreasing flow velocity, indicating that systematic changes took place in flow rate
during travertine deposition. This study establishes that travertine crystal growth ripples such as
those preserved in the Anio Novus provide a sensitive record of past hydraulic conditions, which can
be similarly reconstructed from travertine deposited in other ancient water conveyance and storage
systems around the world.
A reliable supply of fresh drinking water, coupled with an effective water delivery management system, are two
of the essential elements required to build and maintain human civilization. Fulfilment of these basic require-
ments has carried power and prestige in virtually every culture throughout human h istory1. Where water has
sufficiently high supersaturated concentrations of dissolved minerals (hard water), it precipitates deposits com-
posed of calcium carbonate ( CaCO3) limestone called travertine2,3 within water transport and storage systems.
In the process, these travertine deposits preserve a record of the complexly intertwined physical, chemical,
and biological processes that have influenced their d eposition2–5. Travertine deposited during the operation
1
School of Historical and Philosophical Inquiry, The University of Queensland, St Lucia, QLD 4072,
Australia. 2Department of Mechanical and Construction Engineering, Northumbria University, Wynne Jones
Building, Newcastle Upon Tyne NE1 8ST, UK. 3Ven Te Chow Hydrosystems Laboratory, Department of Civil
and Environmental Engineering, University of Illinois at Urbana-Champaign, 205 North Mathews Avenue,
Urbana, IL 61801, USA. 4Cytometry and Microscopy to Omics Facility, Roy J. Carver Biotechnology Center,
University of Illinois Urbana-Champaign, 231 Edward L. Madigan Laboratory, 1201 W. Gregory Drive, Urbana,
IL 61801, USA. 5ExxonMobil Upstream Business Development, 22777 Springwoods Village Parkway, Spring,
TX 77389, USA. 6Department of Linguistics, University of Illinois at Urbana-Champaign, 707 S Mathews
Ave., Urbana, Champaign, IL, USA. 7Department of Geology, University of Illinois at Urbana-Champaign,
1301. W. Green St., Urbana, IL 61801, USA. 8Department of Evolution, Ecology, and Behavior, University of Illinois
at Urbana-Champaign, 505 S. Goodwin Ave., Urbana, IL, USA. 9Roy J. Carver Biotechnology Center, University of
Illinois at Urbana-Champaign, 1206 W. Gregory Drive, Urbana, IL 61801, USA. 10Carl R. Woese Institute for Genomic
Biology and Carl Zeiss Labs@Location Partner, University of Illinois at Urbana-Champaign, 1206 W. Gregory Drive,
Urbana, IL 61801, USA. *email: d.keenanjones@uq.edu.au; davide.motta@northumbria.ac.uk
Scientific Reports | (2022) 12:1239 | https://doi.org/10.1038/s41598-022-05158-2 1
Vol.:(0123456789)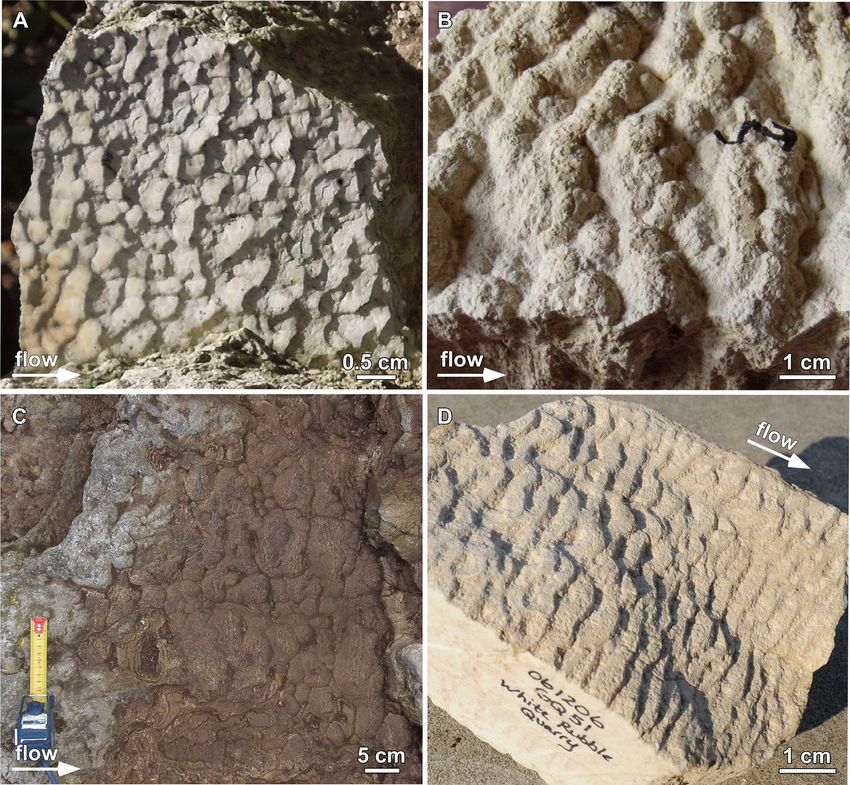
www.nature.com/scientificreports/
of historical aqueducts has recorded changes in human activity and climate in Europe and the Middle E ast6–15,
Pre-Columbian North A merica16, Central A sia17 and A
ustralia18. While dominated by C aCO3 crystals that pre-
cipitate directly from the flowing aqueduct water, aqueduct travertine also contains varying but relatively minor
amounts of downstream-transported sediments and plant d ebris19. This combination of travertine crystallization
and sedimentation processes posed a significant ongoing problem for the maintenance of ancient aqueducts20.
Travertine had to be regularly removed m anually19,21,22 to prevent it from becoming too heavy for the aqueduct
structural supports, while also increasing wall roughness, narrowing channel cross-sectional area, and reducing
the flow capacity23. As a result of these relationships between aqueduct flow and travertine formation, aqueduct
travertine has recently been used to reconstruct flow rates based on their spatial and temporal distribution within
the archaeologically significant and protected ruins of the Anio Novus aqueduct at Roma Vecchia, Italy23,24.
In many natural submarine and subaerial environmental systems, downstream transport of sedimentary par-
ticles creates sediment transport morphologies called ripples and dunes that have been extensively studied25–32.
In addition, other types of deposits called “heat/mass transfer” crystalline deposits have also been described
that form ripples as a result of either heat transfer during melting and freezing in ice (e.g. ice ripples)33–38, or
mass transfer during mineral precipitation and dissolution in caves (e.g. solution ripples36–42; Supplementary
Information S1). Another common example of heat/mass transfer crystalline deposits are travertine microter-
racettes formed in terrestrial spring, river, lake, and cave hydraulic systems. In these environments, travertine
microterracettes (repeated pond and dam stair-steps) form as a result of complex interactions between crystal
precipitation from supersaturated aqueous solutions, changing gravity-dependent low-flow hydraulic regimes, the
presence and metabolic activity of microorganisms, and a small amount of downstream sediment transport2,43–48.
The present study evaluates an unexpected new class of well-preserved heat/mass transfer crystalline deposits
that formed during travertine precipitation on the floors, walls, and roofs of the main channel of the Anio Novus
aqueduct of ancient R ome19,23,24 These deposits were initially reported as “ripples” in the Anio Novus t ravertine19
and later called “ripple-like” morphologies in geographically widespread aqueducts in F rance13, Istanbul and
9 15 14
Jordan , Germany , and Turkey . To be consistent with previous literature, the term “ripple” in the present study
will be used as a descriptive morphological term, to which modifiers are added to indicate specific compositions
and genetic processes of formation and deposition. Examples include “sediment transport ripples”28,32, “solution
ripples”42, and even “ice ripples”37. Depositional morphologies observed in the present study of Anio Novus
aqueduct travertine deposits will therefore be consistently described as “travertine crystal growth ripples”. This
terminology confirms that the travertine ripple morphologies form from a process of constructional crystal
growth directly from the flowing aqueduct water. Furthermore, this terminology reflects the distinctly different
typology of travertine crystallized from complex physical, chemical, and biological mechanisms2–5, which is a
fundamentally different process from the fluid mechanics controlling sedimentary transport ripple f ormation28.
At the same time, the nomenclature “travertine crystal growth ripples” recognizes that gravity-driven, open-
channel turbulent flow is also influential in convective diffusion during travertine CaCO3 crystal p recipitation33.
As a result, the present study combines analyses of travertine crystal growth ripple morphology, 3D floor and
wall distributions within the aqueduct channel, and hydraulic modeling to reconstruct the operating conditions
of the ancient Anio Novus aqueduct.
Materials and methods
Archeological setting. The largest and most important addition to the water supply system of ancient
Rome was the unprecedented simultaneous building of the Aqua Claudia and the Anio Novus aqueducts between
38 and 52 C E49. The 11 aqueducts built in Rome between 312 BCE and 226 CE constituted a larger and more
complex urban water supply system than any before it. Collectively, these aqueducts, 500 km in total length50,
enabled the population density to reach unprecedented levels that rival those of modern-day u rbanization51.
Considerable municipal funds were expended in their maintenance and in some cases the aqueducts continued
to be used for over a thousand years52.
The Anio Novus23,24 was the farthest-reaching aqueduct ever built by Imperial Rome, carrying water from the
Aniene (Latin: Anio) River and one of its tributaries, the rivus Herculaneus, some 87 km into the Eternal C ity21
21
(Fig. 1A). The Anio Novus aqueduct was fed from the Middle and Upper Basins of the Aniene River , which
flows through and dissolves Mesozoic (Upper Triassic to Upper Cretaceous) C aCO3 marine limestones compris-
ing the Simbruini Mountains53. Around 98 CE, the water supply system of Rome was thoroughly described in
the De Aquis compendium by Sextus Julius Frontinus, Rome’s water commissioner (curator aquarum). Because
of the high carbonate supersaturation of the water, travertine reached more than 1 m in thickness at some sites
along the aqueduct s ystem49. The Anio Novus was the highest-elevation aqueduct along most of the Aniene
valley and the second highest in elevation within the city of Rome itself54. Aqueduct elevation was important
(Supplementary Information S2) since Roman water supply was predominantly gravity-driven and only areas
below an aqueduct could be supplied with any significant volume of water50. Maintenance of the Anio Novus
apparently ceased sometime between the fifth and eighth centuries CE52,55.
Sample collection for the present study was conducted under research permits granted by the Soprintendenza
Speciale per il Colosseo, il Museo Nazionale Romano e l’Area Archeologica di Roma and the Soprintendenza
Archeologia, Belle Arti e Paesaggio per l’Area Metropolitana di Roma, la Provincia di Viterbo e l’Etruria Meridi-
onale. Aqueduct travertine samples were collected from three sites: (1) the underground Galleria Egidio section
of the Tivoli Loop23 (Fig. 1A); (2) the Empiglione Bridge section on the Tivoli Bypass (Figs. 1A and 2); and (3)
three locations within the site of Roma V ecchia24 (Fig. 1B). Travertine deposited at each of these three locations
lined the channel floor, walls and sometimes roof of the Anio Novus aqueduct, exhibiting depositional char-
acteristics that are generally consistent with previous descriptions from other Roman aqueduct s ystems6,7,9,15.
Scientific Reports | (2022) 12:1239 | https://doi.org/10.1038/s41598-022-05158-2 2
Vol:.(1234567890)
www.nature.com/scientificreports/
Figure 1. (A) Route of the Anio Novus aqueduct from Subiaco in the Apennines into Rome. Geographic
location of the Galleria Egidio, Empiglione Bridge and Roma Vecchia sites are indicated. (B) Enlargement
of the Anio Novus aqueduct channel at Roma Vecchia showing relative locations of the upstream (RF 0 m),
intermediate (RF 9 m), and downstream (RF 140 m) sample collection locations. Modified from Keenan-Jones
et al.24.
Figure 2. Field photographs of the Anio Novus aqueduct at Empiglione Bridge on the Tivoli Bypass (location
shown in Fig. 1A). (A) Empilgione Bridge looking upstream. (B) Closeup of arcade at upstream end (top left) of
(A), now looking downstream. (C). Travertine crystal growth ripples (white arrow) on the downstream vertical
side wall of the arcade shown in (B) (looking upstream). This opening is visible in the top left of (A).
The distribution and depositional characteristics of the travertine crystal growth ripples at the Galleria Egidio
and Roma Vecchia sites were used to justify the assumption of uniform flow within the Anio Novus aqueduct
at these locations, which have been previously presented in d etail23,24 (Supplementary Table S2, Supplementary
Information S5.1). Similarly, the Empiglione Bridge site, which begins at the Anio Novus’ channel bifurcation
around Tivoli (Fig. 1A), contains a 625 m-long b ridge55 that also provides strong evidence for uniform flow. This
is because it crossed the valley of the Empiglione River by means of a straight arcade that maintained essentially
constant gradients and cross-sectional g eometries49,54. The Empiglione Bridge sample sites in the present study
Scientific Reports | (2022) 12:1239 | https://doi.org/10.1038/s41598-022-05158-2 3
Vol.:(0123456789)
www.nature.com/scientificreports/
were located ~ 200 m downstream of the bifurcation and 400 m upstream of the end of the bridge (Fig. 2). The
only known aqueduct junction on the bridge is an offtake to a cistern located 230 m downstream of the meas-
ured cross section, which is not expected to have affected the uniform flow profile significantly. The stone piers
and arches comprising the bridge date to the original construction of the Anio N ovus49,55. The three arches of
the bridge portion from which the Empiglione Bridge samples were collected, have been attributed to repairs
conducted under the Roman emperor H adrian49,55.
At Roma Vecchia, the Anio Novus aqueduct emerges from the ground and was built directly upon the
Aqua Claudia aqueduct, which was itself supported by an arcade up to 10 m in height (Fig. 2A, B)21,24. Three
age-equivalent upstream-to-downstream samples of travertine at Roma Vecchia were collected from the floor
of a 140 m-long continuous section of the Anio Novus aqueduct12. These included an upstream 0 m location
(sample number RNRV3-2A), an intermediate 9 m location (sample number RNRV3-3A) and a downstream
140 m location (sample number RNRV1-2A; Fig. 1B).
Aqueduct travertine field sample collection. Travertine samples collected from all sites at Galleria
Egidio, Empiglione Bridge and Roma Vecchia (Figs. 1, 2) were systematically photographed, measured, and
described before careful removal using a hammer and small, clean, well-sharpened chisels composed of hard-
ened steel. Each travertine sample was labelled (e.g., sample number, upstream–downstream context and flow
direction determined by contextual orientation the sample within the aqueduct channel), bagged, and shipped
in a padded container to the Microscopy and Imaging Core Facility of the Carl R. Woese Institute for Genomic
Biology (IGB) at the University of Illinois Urbana-Champaign (Illinois). Samples were cut on a clean water-
cooled diamond embedded tile saw in an orientation parallel to the upstream–downstream flow direction of
the channel. Samples were then thoroughly washed with deionized water, polished, dried in a clean room, and
photographed with a Nikon SLR D7000 digital camera (Nikon, Japan).
Petrographic thin‑section preparation and optical microscopy. Billets cut from the three travertine
samples collected at Roma Vecchia (Fig. 1B) were prepared by Wagner Petrographic (Linden, Utah) as Petropoxy
impregnated, doubly polished, uncovered, 25 µm-thick sections mounted on standard-sized petrographic glass
slides. Optical microscopy of these thin sections was completed on a Hamamatsu Nanozoomer digital slide scan-
ner using a 20 × 0.75 NA UPlansApo objective at a pixel resolution of 0.23 µm under a brightfield (transmitted
light) modality. Further detailed descriptions of the light, laser, electron, and x-ray microscopy techniques used
to analyze the Anio Novus aqueduct travertine samples are presented in Sivaguru et al. (2022).
Hydraulic measurements. Each of the Anio Novus travertine crystal growth ripple morphology samples
analyzed in the present study were carefully photographed, measured and marked to record their precise posi-
tion, three-dimensional (3D) distribution, and upstream to downstream orientation within the aqueduct chan-
nel. This included measurement of the wetted perimeter and cross-sectional flow area of the aqueduct channel at
each site23, techniques presented i n24. Reconstruction of the flow rate of the ancient Anio Novus aqueduct water
was done by assuming uniform flow, which is justified and accurate if: (1) the channel cross-section, gradient
and direction are roughly constant; and (2) the sample site is away from hydraulic control points, such as sluice
gates, junctions, or branches. Many of ancient Rome’s aqueduct channels cannot be studied because they have
been destroyed, or are inaccessible due their height above ground, depth underground, or because the channel
is filled with sediment and soil. Although these factors make the widespread regional mapping and analysis of
aqueduct travertine ripples challenging, three sites were identified within the Anio Novus aqueduct (Fig. 1) that
meet these criteria and exhibit mm- to cm-scale travertine crystal growth ripples (Figs. 3 and 4).
The slope of the Anio Novus aqueduct channel floor at Roma Vecchia was calculated using previously reported
topographic elevation54, while distances between each elevation point were calculated using A rcGIS23,24. In addi-
tion, previously determined channel and travertine geometry data were used for both Galleria Egidio and Roma
Vecchia23,24. The channel at Empiglione Bridge could not be accessed due to its height above ground level. A Leica
total station (Leica Camera AG, Wetzlar, Germany) was used to measure the geometry of the channel and the
travertine crystal growth ripple morphologies (Supplementary Fig. S5) and then processed in the SolidWorks
2015 Premium × 64 SP5.0 program (Dassault Systèmes SE, Vélizy-Villacoublay, France).
Characterization of travertine crystal growth ripples. Variations in the morphological characteris-
tics of the Anio Novus travertine crystal growth ripples through time (i.e., along vertical stratigraphic cross-sec-
tions at each geographic location) and space (i.e., at different sample locations along the channel flow path) were
qualitatively and quantitatively investigated. Bottom-to-top analyses of the travertine crystal growth ripple layers
through the entirety of the 8 cm-thick stratigraphy, which records changes through time at three locations at
Roma Vecchia, was evaluated using digital image analysis of individual stratigraphic horizons (described below).
These were further evaluated with direct hand-sample and thin-section images analyses and measurement using
open-source NIH ImageJ software. A total of 21 specific travertine crystal growth ripple layers (stratigraphic
horizons), each representing the travertine-water growth interface at any given specific point in time, were eval-
uated. These were consistently identified within digital scans of Roma Vecchia hand-sample cross-sections by
tracking individual dark laminae. The shape of each layer of travertine crystal growth ripples was then deter-
mined using the Livewire function in the MIPAV program (National Institutes of Health, USA, https://mipav.
cit.nih.gov/). Finally, each horizon was analysed in MATLAB (MathWorks, Natick, MA, USA) with the results
collated and compared with direct sample measurement performed in MIPAV, Adobe Photoshop and Microsoft
Excel (Microsoft, Redmond, WA, USA).
Scientific Reports | (2022) 12:1239 | https://doi.org/10.1038/s41598-022-05158-2 4
Vol:.(1234567890)
www.nature.com/scientificreports/
Figure 3. Comparison of different types of travertine crystal growth ripple morphologies deposited in the
Anio Novus aqueduct with travertine microterracette morphologies deposited in hot-spring drainage systems.
(A–C) Anio Novus travertine crystal growth ripple morphologies formed at the three Roma Vecchia sample
sites (Fig. 1B). (A) Linguoid travertine crystal growth ripples at RF 0 m; (B) sinuous ripples at RF 9 m. (C)
Hummocky travertine crystal growth ripples at RF 140 m. (D) Pleistocene-age Distal-Slope Facies travertine
microterracette morphologies deposited in the quarries of Gardiner, Montana (modified f rom2).
Three primary geometric characteristics of the travertine crystal growth ripples were analysed including
wavelength ( ), amplitude (a = 0.5 × ripple height [Δ]), and steepness (= Δ/ ). Ripple wavelengths were analysed
by Fourier transform. The Lomb-Scargle algorithm was implemented with Welch-Overlapped Segment Averag-
ing (WOSA, 50% overlapping periodograms) to produce Fourier transforms of each stratigraphic horizon. Peak
identifications from the resulting power spectrum were tested for significance against either: (1) a white-noise
(random) null hypothesis; or (2) an autoregressive red-noise null hypothesis where each point depends on the
point before it. The red noise character is defined as decreasing spectral power with increasing wavenumber.
Confidence limits (= (1 − (1/n), where n is the number of points sampled by Mipav along the ripples)56 were
calculated using 1000 Monte Carlo simulations.
Four different proxies (described in Supplementary Information S5.3) for amplitude were then calculated
from the ripple horizons for RF 140 m (Fig. 1B). Ground truthing (measurement of amplitude of ripples in NIH
software ImageJ) showed that the most accurate proxy was the mean of the displacement of the background-
subtracted horizon (Supplementary Fig. S6) and this proxy was also calculated for the other samples.
The aim of investigating variations in travertine crystal growth ripples at the three sites along the Anio Novus
aqueduct channel flow path (Fig. 1B) was to evaluate the relation between the flow properties and the ripple
wavelength in the flow direction. A single stratigraphic horizon composed of travertine crystal growth ripples
was investigated at each of the three sites. These were: (1) the “latest flow” at Empiglione Bridge (the rippled
surface visible in Fig. 2C); (2) the “early flow” at Galleria Egidio; and (3) the “latest flow” at Roma Vecchia. The
“latest flow” at Roma Vecchia is 19 cm above (and hence deposited later than) the top of the Unit 2 (Fig. 4),
and located 1 m upstream (Fig. 3D). At each stratigraphic position, representative depositional surfaces and a
Scientific Reports | (2022) 12:1239 | https://doi.org/10.1038/s41598-022-05158-2 5
Vol.:(0123456789)
www.nature.com/scientificreports/

          Scientific Reports |   (2022) 12:1239 |   https://doi.org/10.1038/s41598-022-05158-2   6

Vol:.(1234567890)
www.nature.com/scientificreports/
◂Figure 4. Dark–light laminae stratigraphy of travertine hand-sample cross-sections deposited within the
Anio Novus aqueduct. Samples were collected from the upstream RF 0 m (Sample Number: RNRV3-2A;
A) and downstream RF 140 m (Sample Number: RNRV1-2A; B) sites at Roma Vecchia (Fig. 1B). Travertine
depositional Units 1 and 2 and downstream flow direction (white arrows) are indicated. Modified f rom12.
(A) and (B). Standard reflected light hand-sample photographs of the face of vertical cross-sections oriented
parallel to the downstream flow direction. Depositional age was determined via correlation of the t 0 contact
surface between the underlying mortar and overlying travertine. Lee sands were deposited on the lee side of
each travertine crystal growth ripple morphology (white arrows in A and B). (C) Nanozoomer brightfield
(transmitted plane light) thin-section photomicrograph (white box C in B) showing travertine shrubs (TS).
Tracings of three representative linguoid travertine crystal growth ripple morphology cross-sections are shown
(red lines). (D) Polarized light high-resolution widefield photomicrograph (enlargement of white box in C) of
dendritically branching aggregates (shrubs) of 1 to 3 µm-diameter euhedral calcite crystals. (E) Nanozoomer
brightfield thin-section photomicrograph (Box E in A). Tracings of three representative linguoid travertine
crystal growth ripple morphology cross-sections are shown (red lines). (F) Nanozoomer brightfield thin-section
photomicrograph (white box in F). Tracings of three representative linguoid travertine crystal growth ripple
morphology cross-sections are shown (red lines). Labels indicate regions of lee sands (LS) with coated grains
(CG) that were partially removed during cutting and thin-section preparation. (G) Enlargement of white box
in (F). Diagenetic replacement radiaxial calcite (RC) crystals form upward radiating bundles that crosscut the
original travertine shrubs (TS) and alternating dark–light laminae stratigraphy.
two-dimensional (2D) vertical cross-section of the travertine samples, each from different locations on the wetted
perimeter, was analysed to estimate a boundary-averaged wavelength. More than 30 wavelength measurements
for each site were made and the Sauter mean wavelength ( 32) estimated, following accepted p ractice58.
Travertine samples chosen for analysis were deposited directly onto the uppermost surface of the mortar
lining of the Anio Novus aqueduct channel and exhibited complete and continuous stratigraphic sequences
(i.e., no evidence of significant disruption, erosion, or dissolution during deposition). At Empiglione Bridge,
measurements of ripple wavelengths of the travertine surface were made at the vault (1.9 m above the floor) and
two locations (at 1.3 m and 0.9 m above the floor) on the left-hand wall (when facing downstream, Fig. 2C),
using the Leica total station as described above. At Galleria Egidio (Supplementary Fig. S7) and Roma Vecchia
(Supplementary Fig. S8), ripple wavelengths in the centre of the channel floor were measured from photographs
taken perpendicular to the travertine surface. Wavelengths and ripple height were measured on scans of polished
cross-sections of travertine crystal growth ripple stratigraphy from the “latest flow” at Empiglione Bridge (where
samples were collected immediately downstream of the measured section, Supplementary Fig. S9), from the wall
of the “early flow” at Galleria Egidio (Supplementary Fig. S10) and the floor of the “latest flow” at Roma Vecchia
(Supplementary Fig. S11). These samples were all less than 3 wavelengths in length in the downstream direction,
therefore ripples were measured directly in ImageJ rather than by Fourier transform.
Results
Travertine stratigraphy and crystal growth ripple morphology. Detailed analyses of the crystalline
structure, sedimentology, stratigraphy, and diagenetic alteration of the three travertine samples within the Anio
Novus aqueduct channel at Roma Vecchia (Fig. 1B) are presented in Sivaguru et al.12. The following summary
provides a fundamentally important depositional and diagenetic context for characterization of the Anio Novus
travertine crystal growth ripple morphology in the present study. The Anio Novus aqueduct travertine deposited
at each of the three Roma Vecchia sites (Fig. 1B) is composed of: (1) the top of the underlying Roman mortar on
the floor of the aqueduct; (2) the time-zero (t0) surface comprising the contact between the underlying mortar
and the overlying travertine; and (3) an 8 cm-thick deposit of aqueduct travertine composed of an underlying
5 cm-thick Unit 1 and an overlying 3 cm-thick Unit 212. Travertine crystal growth ripples observed in three-
dimensions (3D) on in situ bedding surfaces and hand samples (Fig. 3), as well as throughout all vertical slices
of collected samples (Fig. 4), are described in the following. Age-equivalency of the three Roma Vecchia trav-
ertine samples (Fig. 1B) was established via correlation of the t0 surface, their compositional and stratigraphic
consistency in crystalline texture, color, thickness and layering, and the lack of evidence for any later alteration,
disturbance, or dissolution during possible Roman maintenance (Fig. 4)12.
The Unit 1 and 2 travertine deposits (Fig. 4A, B) are composed of two types of calcium carbonate (CaCO3)
morphologies, which include: (1) original 50 to 100 µm-tall dendritically branching aggregates of small
(1–3 µm-diameter) euhedral calcite crystals (Fig. 4C; called shrubs); and (2) variably sized (100’s µm to 10’s mm)
diagenetic replacement radiaxial calcite crystals that form upward radiating bundles that crosscut the alternating
dark–light laminae stratigraphy but do not influence the original travertine crystal growth ripple morphologies
(Fig. 4D, E)12. Both types contain stratigraphic sequences of interlayered dark brown and light beige laminae (< 10
to 100 µm-thick), formed by organic matter entrapped during original crystallization and deposition (Fig. 4)12.
Unit 1 travertine is composed of high-frequency interlayering of 0.1 to 1 mm-thick dark brown laminae and
light beige laminae that are generally planar, yet sometimes exhibit low angle angular unconformities (Fig. 4A,
B). While the thickness of the dark brown laminae remains relatively consistent in Unit 1 and 2 (100’s µm-thick
to ~ 1 mm-thick), the light beige laminae are significantly thicker in Unit 2 (~ 1–3 mm-thick; Fig. 4A, B).
Unit 1 exhibits travertine crystal growth ripples with stoss, crest, lee and trough geomorphologies (Figs. 4 and
5; Supplementary Videos S1 and S2)12,28,30,31. On bedding surfaces observed in the field, in hand sample and in
thin section (Figs. 3, 4, and 5B, C), these travertine crystal growth ripples exhibit wavelengths generally increas-
ing from mm scale near the bottom to cm scale near the top and are morphologically consistent with linguoid,
Scientific Reports | (2022) 12:1239 | https://doi.org/10.1038/s41598-022-05158-2 7
Vol.:(0123456789)www.nature.com/scientificreports/
Figure 5. Comparison between Anio Novus travertine crystal growth ripple morphologies and Gardiner
Quarry travertine microterracette morphologies. (A) Terminology used to describe the geomorphology of
asymmetric ripples formed by downstream hydraulic transport of sedimentary g rains28,30,31. (B) Enlargement
of Anio Novus Unit 1 travertine linguoid travertine crystal growth ripple morphologies shown in Fig. 3A. X–X’
is the line of section shown for the morphology cross-section tracing shown in Fig. 4E. (C) Enlargement of
Pleistocene Gardiner Quarry Distal-Slope Facies travertine microterracette morphology shown in Fig. 3D. Y–Y’
is the line of section shown in the morphology cross-section tracing.
sinuous and hummocky ripples observed in sedimentary transport ripples12,28,30,31. As these layers of travertine
crystal growth ripples accumulated vertically, the position of the crests and troughs intermittently preferentially
accumulated in a downstream direction (prograded) and at other times in an upstream direction (retrograded),
forming zig-zag stratigraphic patterns in 2D vertical sections (Figs. 3 and 4)12 (Supplementary Videos S1 and
S2, described in more detail in Supplementary Information S3.1). In Unit 2, the travertine crystal growth ripple
wavelengths are generally on the cm scale and larger than those in Unit 1,forming sinuous and hummocky sedi-
mentary transport ripples (Figs. 4 and 5)12,28,30,31. As in Unit 1, the ripple sets in Unit 2 prograde and retrograde
up-section, which again form zig-zag stratigraphic patterns in 2D vertical sections (Figs. 3, 4; Supplementary
Videos S1 and S2). A common feature of the Unit 1 and 2 travertine, which further accentuates the travertine
crystal growth ripple morphology, is the deposition of siliciclastic sand grains within eddies on the lee slope of
ripple sets (Figs. 4A, B, D, 5A), called lee sands12 (Fig. 3A–C). These lag deposits contain a minor component of
an assortment of fine- to coarse-grained and angular to rounded siliciclastic sands12. MicroCT imaging prior
to hand-sample cutting indicates that these sands were originally densely packed on the lee side of each ripple
prior to being washed out and plucked during sample preparation, leaving behind void spaces (Fig. 4A, B)12.
Quantitative characterization of travertine crystal‑growth ripples. Our approach to quantifying
up-section stratigraphic variation in travertine crystal growth ripple geomorphology for the 0, 9 and 140 m sam-
ples collected at Roma Vecchia (Fig. 1B) are shown in Fig. 6. The digital horizons analysed by Fourier transform
Scientific Reports | (2022) 12:1239 | https://doi.org/10.1038/s41598-022-05158-2 8
Vol:.(1234567890)www.nature.com/scientificreports/
Figure 6. Travertine crystal growth ripple morphology cross-section measurements and characterization
within stratigraphic cross sections of the Anio Novus aqueduct deposits at Roma Vecchia (Fig. 1B). The
thickness of vertical travertine accumulation from the time-zero surface ( t0) is plotted on the y-axis. Aqueduct
water low direction is from left to right in all three images. Travertine wavelength (λ) is shown on the x-axis,
as well as uncertainty bars corresponding to two standard deviations. Left: Sample RF 0 m (number of
samples analysed (n) = 21). Center: Sample RF 9 m (n = 20). Right: RF 140 m (n = 21). Data is presented in
Supplementary Data Files 1–3.
are shown by red line tracings overlaid on the hand-sample images (Fig. 6). There is generally good agreement
between the shortest significant wavelengths identified by the Fourier transform (shown as black triangles) and
ground-truthed wavelengths (shown by crosses). After initial establishment of the travertine crystal growth rip-
ples at the base of Unit 1 (Fig. 4A, B), a cyclic stratigraphic succession of ripple wavelength and amplitude occurs
from increasing, to decreasing and increasing again.
The calculation of Re∗c from mean travertine crystal growth ripple morphology wavelength, water temperature
and kinematic viscosity and shear velocity has been completed at the three different sites along the flow path of
the Anio Novus (Fig. 1A). Full measurements of travertine crystal growth ripple characteristics and results are
provided in the Supplementary Information (S3.2).
Calculation of critical shear reynolds number from aqueduct travertine crystal‑growth rip‑
ples. Shear velocity, u∗, and Re∗c (Supplementary Table S2) were computed using Eqs. (1) and (3), respectively.
In fluid-sediment systems, the boundary-averaged shear velocity (u∗) is a means of expressing the boundary-
averaged shear stress in units of velocity. u∗ can be determined from estimates of aqueduct longitudinal slope (S)
and hydraulic radius ( Rh) by assuming uniform flow conditions, where59:
τb
u∗ =
= gRh S (1)
ρ
where τb is the boundary-averaged shear stress, ρ is the mass density of water, g is the acceleration of gravity,
and S is the aqueduct floor slope (gradient). Equation (1) for shear velocity u∗ is based on the assumption of
uniform flow and accounts, through the use of the hydraulic radius, for the irregular (associated with travertine
deposition) and taller-than-wide shape of the wetted boundaries. Furthermore, it provides a value averaged over
the whole wetted boundary. The present study has therefore adopted the assumption of uniform flow and based
hydraulic computations on the geometric property of aqueduct channel hydraulic radius, defined as the ratio of
flow area to wetted perimeter. The hydraulic radius Rh is given by
A
Rh = (2)
P
where A is the flow area and P is the wetted perimeter, which were estimated based on the travertine deposits
on the floor and side walls of the cross section (e.g. Supplementary Fig. S12).
Investigations on a wide variety of mature convective heat/mass transfer crystalline morphologies have
consistently found that ripple wavelength scales with the ratio between the water kinematic viscosity and the
shear velocity (i.e., the thickness of the viscous sublayer). Furthermore, the shear-velocity based (or friction-
based) Reynolds number Re∗ has a constant critical value for the formation of different types of mass transfer
morphologies41,60–62. This critical shear velocity-based Reynolds number Re∗c is calculated as:
u∗
Re∗c = (3)
ν
where is the boundary-averaged ripple wavelength and ν is the kinematic viscosity of water, which is a function
of water temperature. Curl57 derived the following relationship between u∗, the mean (cross-sectionally-averaged)
flow velocity ( u ) and the Sauter mean of the measured ripple wavelengths ( 32) for dissolution morphologies
formed in a circular conduit:
Scientific Reports | (2022) 12:1239 | https://doi.org/10.1038/s41598-022-05158-2 9
Vol.:(0123456789)www.nature.com/scientificreports/
D 3
ū = u∗ 2.5 ln − + BL (4)
2 ¯ 32 2
where D is the diameter of the conduit and BL is Prandtl’s bed-roughness constant. BL is a constant for dissolu-
tion morphologies of a particular shape and Re∗c , once they have reached equilibrium with an imposed mean
velocity u 57,60.
Derivation of morphology roughness‑flow relationships. We have modified Eq. (4) for use in the
taller-than-wide, rectangular aqueduct channel through inclusion of the hydraulic radius (defined in Eq. 2),
knowing that, for a circular conduit, Rh = D/4:
2Rh 3
ū = u∗ 2.5 ln − + BL (5)
¯ 32 2
Substituting u* from Eq. (1) into Eq. (5) gives,
2Rh 3
ū = gRh S 2.5 ln − + BL (6)
¯ 32 2
Temperature determines the density and kinematic viscosity of water fl ows63, which in turn affects the flow
depth and Rh. Through its incorporation of Rh, Eq. (6) thus negates the need to estimate the temperature of the
flow that formed the travertine crystal growth ripples to estimate u . If the wetted perimeter P and flow area A
can be measured or estimated from the surviving travertine stratigraphy, then Rh can be estimated from Eq. (2)
and substituted into Eq. (6) to calculate u . Then an estimation of flow rate, Q, can made using the following
continuity equation:
Q = Au (7)
Discussion
Travertine crystal growth ripples. The stoss, crest, lee, and trough geomorphology of the Anio Novus
travertine crystal growth ripples are consistently observed in 3D bedding surfaces (Figs. 2C, 3A–C, 5B, C) and
in vertical 2D sections of hand samples and in 2D thin section (Fig. 4). While the complex physical, chemi-
cal, and biological processes controlling the travertine crystal growth ripples are distinctly different from those
controlling sediment transport ripples28,32 and solution ripples42, the basic ripple nomenclature established in
these previous studies provides an important comparative context for describing the travertine crystal growth
ripple moprhologies28,30,31 (Figs. 3A–C, 4, 5). Of particular importance is that, in addition to their formation on
the channel floor, the travertine crystal growth ripple morphologies of the Anio Novus also formed horizontally
on the vertical surfaces of the aqueduct channel walls, such as those observed at Empiglione Bridge (Fig. 2C).
This evidence indicates that the Anio Novus travertine crystal growth ripple morphologies are independent of
gravitational forces (Fig. 5B, C). Similarly, non-gravity dependent flute, scallop, and ripple morphologies have
been observed to form on the vertical walls and ceilings of ice and dissolving cave systems34,35,37,38,42. Conversely,
all ripples formed from the downstream transport of suspended sediments are gravity d ependent28–31,40, drawing
another fundamental distinction with the Anio Novus aqueduct travertine crystal growth ripples.
Another previously well-studied class of gravity dependent heat/mass transport morphologies in travertine,
called microterracettes, form in many different earth surface (i.e., lakes, rivers, cold- and hot-springs) and subsur-
face (e.g., caves, fractures) e nvironments2,3,42. Each microterracette is structurally composed of a terraced pond
and a lip, which create a gravity-driven cascading downstream s equence2,3,64 (Fig. 4D). Travertine microterracette
morphologies are therefore geomorphologically distinct from the Anio Novus travertine crystal growth ripples
(Fig. 5A–D) and are representative of deposition in fundamentally different gravity-independent regimes with
respect to overall hydraulics, geochemistry, and biological a ctivity2,28,43,44,65,66.
Valuable insights are provided via direct comparison of the Anio Novus travertine crystal growth ripple
morphology with both modern and ancient Distal-Slope Facies travertine microterracettes deposited at Mam-
moth Hot Springs in Yellowstone National Park and in nearby Gardiner, Montana2,64,67,68. The Anio Novus
travertine crystal growth ripples, which are slightly younger than the 38–52 CE age of the aqueduct itself12,
were precipitated from the following gravity-independent aqueous conditions: (1) temperature = 6°–13.5 °C,
pH = 7.8–8.4, and saturated with respect to carbonate mineral precipipation53,69,70; and (2) water depth = 1–2 m,
flow velocity = 0.8–1.8 m/s, and highly turbulent confined channel fl ow12,23,24 (Fig. 5, Supplementary Table S3,
Supplementary Figures S5, S13). In contrast, the Mammoth-Gardiner Distal-Slope Facies travertine microter-
racettes, which are modern to recent (0–8000 years old) at Mammoth and Pleistocene (19,500–38,700 years old)
in the Gardiner quarries2, were precipitated under the following gravity-dependent, unconfined, nearly laminar
sheet-flow aqueous conditions: (1) temperature = 28–44 °C; (2) pH = 7.3–8.1; (3) supersaturation (Omega) = 2–5;
(4) water depth = 1–3 cm; and (6) flow velocity = < 0.01–0.1 m/s2,44,64,68,71.
These comparisons reveal that the aqueous temperatures and chemistries are comparable between the for-
mation of the Anio Novus travertine crystal growth ripples and the Mammoth-Gardiner travertine microter-
racettes, respectively. Furthermore, the mineralogy and crystalline structure of travertine crystal growth ripples
and microterracettes are generally comparable. The Anio Novus travertine crystal growth ripples are composed
of small 1–3 µm-diameter euhedral calcite crystals that form larger 100–500 µm-tall shrub-like aggregates12
(Fig. 4C, D). The Distal-Slope Facies microterracettes are composed of 1–3 µm-diameter euhedral calcite crystals
Scientific Reports | (2022) 12:1239 | https://doi.org/10.1038/s41598-022-05158-2 10
Vol:.(1234567890)www.nature.com/scientificreports/
Figure 7. Covariation between u∗ and 32 (see Supplementary Table S2). (A) Data from this study falling within
dashed lines representing Meakin and Jamtveit (2010)’s range for Re* of scallop formation. “n” refers to number
of measurements from which 32 was calculated. Dotted line is a linear regression with details shown on the
chart. Uncertainty bars correspond to two standard deviations. (B) The same Anio Novus travertine crystal
growth ripple data (from A) now plotted over Th omas61’ log–log plot of data from sediment transport ripples,
solution ripples (scallops eroded on metal, limestone, bitumen and plaster surfaces) and ice ripples. Anio Novus
travertine data plot amongst these other ripple and scallop data (used with permission).
that form 100 µm-tall shrub-like crystalline aggregates2,64,68. However, in stark contrast, there are orders-of-
magnitude differences in the contextual flow regimes from which the Anio Novus travertine crystal growth
ripples and Mammoth-Gardiner microterracettes were deposited, respectively.
Hydraulic reconstructions from travertine crystal growth ripples. As described in the previous
section, the travertine crystal growth ripples formed within the channel of the Anio Novus aqueduct are gener-
ally similar in 2D vertical section morphology to well-studied ripples formed during the downstream hydraulic
transport of sedimentary grains (Fig. 5)28. This is despite having been formed under very different physical,
chemical, and biological environmental conditions2,3,28,31, which is reflected in the morphology observed on 3D
surfaces (Fig. 5). Importantly, Hanratty33 formulated a fluid mechanical theoretical framework for the develop-
ment of instabilities on surfaces that are eroding, dissolving, or being precipitated. Results indicate that wave-
induced turbulent flow is equally influential during convective diffusion controlling travertine CaCO3 crys-
tal precipitation, as well as downstream sediment transport. Therefore, the hydraulic history of open-channel
turbulent flow can be equally reliably reconstructed from both travertine crystal growth ripples and sediment
transport ripple morphologies33.
To compare aqueduct travertine crystal growth ripples characteristics with those of other heat/mass transfer
crystalline morphologies (Supplementary Information S4.1), Supplementary Table S1 summarizes estimates of
the ripple wavelengths at Empiglione Bridge (“latest flow”), Galleria Egidio (“early flow”), and Roma Vecchia
(“latest flow”). Supplementary Table S2 establishes the shear velocity, Reynolds number and other flow properties
from the data in Supplementary Table S1. The aim is to evaluate a possible relation between ripple wavelength
along the flow direction and other flow properties. This was completed on the travertine crystal growth ripples
observed in 2D channel sections from the three sites along the Anio Novus. Requirements included having
enough travertine preserved to determine the hydraulic radius ( Rh), given by the ratio of flow area A and wetted
perimeter P (Eq. 2), could be reconstructed and where the assumption of uniform flow is v alid23,24.
Figure 7 plots ν/u∗ versus 32 for the three sample sites along the Anio Novus flow path (Fig. 1A), all the
sites available due to the limited survival and accessibility of archaeological remains. The wavelength for each
of these 3 points is averaged from the wavelengths of 39–50 individual travertine crystal growth ripples at that
location (Supplementary Information S5.3, Supplementary Figures S7-S11). Uncertainties and approximations
also resulted from data collection challenges related to the evaluation of: (1) channel slope (Galleria Egidio) and
wetted perimeter (Roma Vecchia); (2) the shear velocity estimate (carried out using a uniform-flow assumption
and a boundary-averaged expression for the shear stress) and (3) the fluid viscosity (computed for constant
water temperature, which is a reasonable approximation in the aqueduct based on the water temperature data at
the source, Supplementary Information S5.4). Nevertheless, the critical shear Reynolds numbers for travertine
crystal growth ripple formation for each site (Supplementary Table S2) and for the Anio Novus overall (c. 2565,
obtained by linear regression between the sites, Fig. 7A) consistently fall within the range of previously measured
dissolution and precipitation morphologies, such as 750 Re∗c 300041,61,72,73. The linear relationship suggested
by the data shown in Fig. 7A. is in close agreement with past work on a large variety of morphologies (such as
scallops and ripples, formed both by sediment grain d eposition32 and crystalline precipitation/dissolution42),
which found a linear relationship between these same properties of ν/u∗ and (Fig. 7B). This suggests that, as in
dissolution morphologies42,72, the ripple wavelength scales with the thickness of the viscous sublayer (δ), which
is commonly estimated as 11.6 ν/u∗59. In other words, if the thickness of the viscous sublayer increases, so does
the ripple wavelength. More precise data are clearly needed, and additional sites within the Anio Novus deposits
Scientific Reports | (2022) 12:1239 | https://doi.org/10.1038/s41598-022-05158-2 11
Vol.:(0123456789)www.nature.com/scientificreports/
exhibiting travertine crystal growth ripples will be sought in future studies where uniform flow can be assumed
and where slope, wetted perimeter, flow area and ripple wavelength can be measured. Nevertheless, for the first
time in aqueduct travertine deposits, this shows that travertine crystal growth ripple wavelength varies due to
changes in shear velocity and fluid viscosity (i.e., water temperature63) alone, in accord with Eq. (3).
Unlike dissolution morphologies such as scallops42, which dissolve in earlier formed bedrock, travertine
crystal growth ripples deposit new layers on top of previous ripple sets, thus recording their history of formation.
Therefore, changes in flow conditions and/or temperature over time can be traced upwards through changing
travertine crystal growth ripple characteristics (illustrated by the red and green lines in Fig. 4, which provide 2D
upward tracing of troughs in vertical section). It is shown above (Fig. 7) that the Anio Novus travertine crystal
growth ripples are within the range of critical Re* for dissolution morphologies, suggesting that Curl’s Eq. (4),
and hence our Eq. (6), are valid for estimating flow velocity from travertine crystal growth ripple wavelengths.
Using Eqs. (6) and (7), flow velocity and rate for the three Anio Novus sites were calculated from travertine crystal
growth ripple wavelength and other data in Supplementary Table S2. These results, shown in Supplementary
Table S3, illustrate that the mean velocity u estimated from travertine crystal growth ripple wavelength is within
12–16% of that obtained using the uniform-flow Manning’s equation with an estimated Manning’s roughness
coefficient (n) typical of a material with similar roughness to the aqueduct travertine. This confirms that Eqs. (4)
and (6) are at least broadly valid for interpreting travertine crystal growth ripples. Further confirmation is pro-
vided by the travertine crystal growth ripples-flow relationships developed for sediment ripples by Van Rijn74
from the resistance equation, which make use of the ripple morphology height, , as well as the ripple wavelength
(Supplementary Information, Section S4.3). Moreover, our modified Eq. (6) has the advantage of accounting
for changes in travertine crystal growth ripple characteristics over time at a particular site, as well as at different
sites along the flow path, permitting the reconstruction of the histories of flow velocities and rates throughout a
Roman aqueduct network and in similar networks.
Travertine 2D cross-sections such as those of Units 1 and 2 from the aqueduct floor at Roma Vecchia (Fig. 4A,
B) are ideal for such reconstructions, since the up-section changes in ripple wavelength can be traced over
time through the stratigraphy. However, the travertine on the walls was too poorly preserved at this location to
measure or estimate wetted perimeter, P, and flow area, A, for Units 1 and 2. This meant that hydraulic radius
could not be estimated, which precluded the use of Eq. (6). Nevertheless, qualitative changes in flow velocity and
rate during Units 1 and 2 can be interpreted. From Eq. (3), increases in travertine crystal growth ripple wave-
length only result from decreases in shear velocity and/or increases in kinematic viscosity. Kinematic viscosity
will vary with temperature63, but, as detailed in Supplementary Information S4.4, the limited possible range of
temperatures means variation in viscosity would have been significantly smaller (+ 13/ − 10% of the representa-
tive 10 °C value, Supplementary Information S5.4) than the observed variation in wavelength at Roma Vecchia
(+ /-70–150% of the mean). This means that the majority of observed changes in travertine crystal growth ripple
wavelength in depositional Units 1 and 2 of Roma Vecchia travertine were due to changes in shear velocity (i.e.,
flow discharge) at the site rather than changes in temperature. Whereas changes in shear velocity would have been
primarily due to changes in flow velocity rather than other factors (Supplementary Information S4.5). Hence,
under near-constant kinematic viscosity, the mean wavelength increases observed in Anio Novus travertine are
evidence of decreases in flow velocity and rate in the aqueduct, and vice versa. This is confirmed, theoretically
and experimentally, for heat/mass transfer morphologies by many previous studies75–80.
As a result, qualitative changes in flow velocity and rate were reconstructed for the earliest periods of flow
that formed the 8-cm basal of the deposit within the Anio Novus aqueduct channel at Roma Vecchia (Fig. 4A,
B). This was completed using 2D stratigraphic up-section changes in the wavelength of the travertine crystal
growth ripples (Fig. 6) deposited on the previously flat t 0 channel mortar surface or on bed defects. After a
period of travertine crystal growth ripple initiation (bottom half of Unit 1), flow rate then decreased markedly
(third quarter of Unit 1), as suggested by the increase in ripple wavelength at RF 9 m and 140 m (Figs. 4A, B,
6). Flow rate then increased (top quarter of Unit 1), reducing ripple wavelengths, reaching a maximum at the
Unit 1/Unit 2 interface. A second reduction in flow rate occurred in the bottom half of Unit 2, after which flow
rate remained relatively constant (according to RF140 m). These reductions likely occurred during the first few
centuries of the operation of the Anio Novus, i.e. 52 – c.250 CE, when water demand at Rome was near its p eak81.
This interpretation is discussed in more detail in Supplementary Information S4.6.
Implications for reconstructions of climate and human activity. Possible drivers of these changes
in flow rate in the Anio Novus include climate variability and human action or inaction. However, neither of
these could have pushed the flow rate above the limit of 2 m3/s imposed by the hydraulic constraints and bot-
tlenecks presented above23. Climate may have affected the flow in Anio Novus by changing the flow rate input at
its source, the Aniene River, through changing rainfall amounts in the upstream catchment. This seems unlikely
to have been significant, however, since the Aniene River could probably have always supplied more water to the
aqueduct than it could carry (Supplementary Information, S4.7). Therefore, human manipulation of aqueduct
flow was likely the major control of changes in flow within the Anio Novus rather than climatic variations.
There would have been two predominant forms of human a ction21: (1) intentional removal of water from
the aqueduct, either legally sanctioned or fraudulent; and (2) maintenance (or lack thereof). It seems likely that
Roman managers would have worked to maintain flow rate in the upstream reaches of the Anio Novus aqueduct
as close to the carrying capacity of the channel as possible. Frontinus21 regards high flow rates in aqueducts as
positive, given the ongoing high demand for water in the city, and laments the loss of water en route. Even if
there were sluice gates at the aqueduct intake (a contested point49,55) it seems unlikely that these gates were used
to reduce inflows significantly below the capacity of the channel. Diversionary channels to lower aqueducts,
properties, and towns such as Tivoli, may have exerted some control on flow via the use of sluice gates or other
Scientific Reports | (2022) 12:1239 | https://doi.org/10.1038/s41598-022-05158-2 12
Vol:.(1234567890)www.nature.com/scientificreports/
means21,49. Closing of the sluice gates might also have been used as a means to temporarily impound water within
the channel itself82. Lack of maintenance20, would have allowed travertine deposition to constrict the channel
flow, while its weight may have caused leakage from structural cracks. Such cracks could also have resulted
from weathering or earthquakes. Constriction and cracking would both have reduced flow within the aqueduct.
Travertine deposits 10 s of cm-thick on the floors, walls and ceiling of the aqueduct channel internal perimeter
in many areas of the Anio N ovus49, at sites such as Osteriola, indicate that regular maintenance was neglected,
at least towards the operational demise of the Anio Novus aqueduct.
Conclusions
Travertine crystal growth ripples have been utilized in this study to reconstruct the early hydraulic history of
the Anio Novus, the largest and farthest reaching of ancient Rome’s 11 aqueducts. Travertine crystallizes from
complexly physical, chemical, and biological processes that operate fundamentally differently from those con-
trolling sandstone ripple mark formation. Yet despite these mechanistic distinctions, the hydraulic history of
gravity-driven turbulent flow can be reliably reconstructed from travertine crystal growth ripples as they are from
sediment transport ripples. As a result, the hydraulic significance of the amplitude and wavelength of travertine
crystal growth ripples preserved within aqueduct travertine have been used to reconstruct the hydraulic history
of the Anio Novus. This included petrographic characterization and measurement of travertine crystal growth
ripples deposited on the channel floor, walls, and roof of the Anio Novus aqueduct, arguably the most significant
of the 11 aqueducts that supplied water to Imperial Rome. Of particular importance is that the critical shear
Reynolds number of the travertine crystal growth ripples are within the range of hydraulic parameters previously
observed to form ripples in multiple other analogous natural and manmade environments. These similarities
have been used to further improve upon our previous uniform flow estimates of velocity and discharge for the
Anio Novus aqueduct. These relationships establish travertine crystal growth ripple wavelength, defined as the
characteristic length of the shear Reynolds number, as a fundamental parameter required to confidently recon-
struct maintenance and management of the Anio Novus aqueduct.
Data availability
Raw unprocessed data and images for Main Figures and SI Figures will be made available in the original source
format on the University of Illinois cloud data base.
Received: 9 April 2021; Accepted: 7 January 2022
References
1. Scarborough, V. L. Water management adaptations in nonindustrial complex societies: An archaeological perspective. Archaeol.
Method Theory 3, 101–154 (1991).
2. Fouke, B. W. Hot-spring systems geobiology: Abiotic and biotic influences on travertine formation at Mammoth Hot Springs,
Yellowstone National Park, USA. Sedimentology 58, 170–219 (2011).
3. Pentecost, A. Travertine (Springer, 2005).
4. Erthal, M. M. et al. Shrub morpho-types as indicator for the water flow energy—Tivoli travertine case (Central Italy). Sediment.
Geol. 347, 79–99 (2017).
5. Janssens, N. et al. Fossil travertine system and its palaeofluid provenance, migration and evolution through time: Example from
the geothermal area of Acquasanta Terme (Central Italy). Sediment. Geol. 398, 105580 (2020).
6. Benjelloun, Y., Carlut, J., Hélie, J.-F., Chazot, G. & Callonnec, L. L. Geochemical study of carbonate concretions from the aqueduct
of Nîmes (southern France): A climatic record for the first centuries AD?. Sci. Rep. 9, 5209 (2019).
7. Filocamo, F., Carlut, J., Dessales, H., Burckel, P. & Borensztajn, S. Roman builders facing the risk of disaster: Coupling archaeologi-
cal and geochemical analyses on a section of the ‘Aqua Augusta’ (the Roman Serino Aqueduct, Southern Italy). Archaeometry 60,
915–932 (2018).
8. Hostetter, E., Fouke, B. W. & Lundstrom, C. C. The last flow of water to, and through, the Baths of Caracalla: Age, temperature and
chemistry. J. Anc. Topogr. Riv. Topogr. Antica 21, 53–90 (2011).
9. Passchier, C. et al. The aqueduct of Gerasa—Intra-annual palaeoenvironmental data from Roman Jordan using carbonate deposits.
Palaeogeogr. Palaeoclimatol. Palaeoecol. 110089 (2020). https://doi.org/10.1016/j.palaeo.2020.110089.
10. Pons-Branchu, E. et al. Three centuries of heavy metal pollution in Paris (France) recorded by urban speleothems. Sci. Total Environ.
518, 86–96 (2015).
11. Pons-Branchu, E. et al. A geochemical perspective on Parisian urban history based on U-Th dating, laminae counting and yttrium
and REE concentrations of recent carbonates in underground aqueducts. Quat. Geochronol. 24, 44–53 (2014).
12. Sivaguru, M. et al. Depositional and diagenetic history of travertine deposited within the Anio Novus aqueduct of Ancient Rome.
In From the Guajira Desert to the Apennines, and from the Sardinia/Corsica Microplate to the Killer Asteroid: Honoring the Career
of Walter Alvarez (eds. Koeberel, C., Claeys, P., and Montanari, S) (Geological Society of America, 2022).
13. Sürmelihindi, G., Leveau, P., Spötl, C., Bernard, V. & Passchier, C. W. The second century CE Roman watermills of Barbegal:
Unraveling the enigma of one of the oldest industrial complexes. Sci. Adv. 4, eaar3620 (2018).
14. Sürmelihindi, G. et al. Laminated carbonate deposits in Roman aqueducts: Origin, processes and implications. Sedimentology 60,
961–982 (2013).
15. Sürmelihindi, G. & Passchier, C. W. Sinter Analysis. A Tool for the Study of Ancient Aqueducts. In Historische Wasserleitungen
gestern, heute, morgen: Internationales Symposium mit besonderer Berücksichtigung ihrer denkmalgerechten und betriebssicheren
Erhaltung, Wien, 19.-23. Oktober 2011 (ed. Wiplinger, G.) 269–286 (Peeters, 2013).
16. Neely, J. A. & Huerta, B. R. C. Una síntesis del manejo prehispánico del agua en el Valle de Tehuacán, Puebla, México. Arqueología
182–198 (2014).
17. Noel, E. Qanats. J. R. Cent. Asian Soc. 31, 191–202 (1944).
18. McLauglan, R. G., Knight, M. J. & Stuetz, R. M. Fouling and Corrosion of Groundwater Wells. A Research Study (National Centre
for Groundwater Management, University of Technology, Sydney, 1993).
19. Keenan-Jones, D. C. et al. Hierarchical Stratigraphy of Travertine Deposition in Ancient Roman Aqueducts. in Lazio e Sabina 10
(Atti del Convegno “Decimo Incontro di Studi sul Lazio e la Sabina”, Roma, 4–6 giugno 2013) (eds. Calandra, E., Ghini, G. & Mari,
Z.) 293–5 (Edizioni Quasar, 2014).
Scientific Reports | (2022) 12:1239 | https://doi.org/10.1038/s41598-022-05158-2 13
Vol.:(0123456789)You can also read