TRUTH SIMPLE ABOUT THE GENDER PAY GAP - US Department of Education
←
→
Page content transcription
If your browser does not render page correctly, please read the page content below
SIMPLE    ABOUT
THE
            THE
TRUTH       GENDER
            PAY GAP
 FALL 2018 EDITION
SIMPLE      TRUTH                                                           FALL

                        THE
                                                                                                      2018
                         ABOUT THE GENDER PAY GAP                                                     EDITION

                         ACKNOWLEDGMENTS
                         The Fall 2018 edition of The Simple Truth about the Gender Pay Gap was written by AAUW
                         Senior Researcher Kevin Miller and Senior Vice President for Public Policy and Research
                         Deborah J. Vagins. Director of Federal Policy Anne Hedgepeth and State Policy Counsel Kate
                         Nielson contributed additional writing, and Research Assistant Raina Nelson provided research
                         support. We are grateful for the contributions of former members of our research, policy, and
                         editorial teams who helped build The Simple Truth into a preeminent source for facts and
                         guidance on the gender pay gap.

                         AAUW thanks our members and supporters for their generous support in making this
                         publication and organization possible, especially the members of the Mooneen Lecce
                         Giving Circle.

                         Published by AAUW
                         1310 L St. NW, Suite 1000                       Copyright © 2018 AAUW
                         Washington, DC 20005                            All rights reserved
                         www.aauw.org                                    Printed in the United States of America
                         connect@aauw.org                                First printing: 2011
                         202.785.7700                                    160-18

2   THE SIMPLE TRUTH ABOUT THE GENDER PAY GAP | Fall 2018 Edition                                  AAUW • www.aauw.org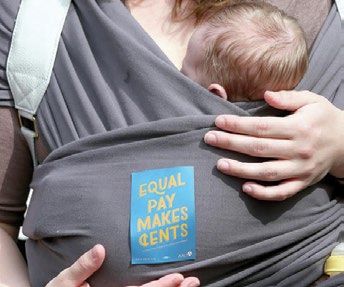
TABLE OF CONTENTS
Foreword  . . . . . . . . . . . . . . . . . . . . . . . . . . . . . . . . . . . . . . . . . . . . . . . . . . . . . . . . . . . . . . . . . . . . . . . . . . . . . . . . . . . . . . . . . . . . 4

Introduction . . . . . . . . . . . . . . . . . . . . . . . . . . . . . . . . . . . . . . . . . . . . . . . . . . . . . . . . . . . . . . . . . . . . . . . . . . . . . . . . . . . . . . . . . . 5

What Is the Pay Gap? . . . . . . . . . . . . . . . . . . . . . . . . . . . . . . . . . . . . . . . . . . . . . . . . . . . . . . . . . . . . . . . . . . . . . . . . . . . . . . . . . . 7

                 Where Do the Data Come From? . . . . . . . . . . . . . . . . . . . . . . . . . . . . . . . . . . . . . . . . . . . . . . . . . . . . . . . . . . . . . . . . .  7

                 State-Level Data . . . . . . . . . . . . . . . . . . . . . . . . . . . . . . . . . . . . . . . . . . . . . . . . . . . . . . . . . . . . . . . . . . . . . . . . . . . . . . . . .  7

How Does the Pay Gap Affect Women of Different Demographics?  . . . . . . . . . . . . . . . . . . . . . . . . . . . . . . . . . . . . . . . 9
                 Race/Ethnicity  . . . . . . . . . . . . . . . . . . . . . . . . . . . . . . . . . . . . . . . . . . . . . . . . . . . . . . . . . . . . . . . . . . . . . . . . . . . . . . . . . .  9
                 Age  . . . . . . . . . . . . . . . . . . . . . . . . . . . . . . . . . . . . . . . . . . . . . . . . . . . . . . . . . . . . . . . . . . . . . . . . . . . . . . . . . . . . . . . . . . . 10
                 Disability  . . . . . . . . . . . . . . . . . . . . . . . . . . . . . . . . . . . . . . . . . . . . . . . . . . . . . . . . . . . . . . . . . . . . . . . . . . . . . . . . . . . . . . 10
                 Sexual Orientation and Gender Identity  . . . . . . . . . . . . . . . . . . . . . . . . . . . . . . . . . . . . . . . . . . . . . . . . . . . . . . . . . . . 11

How Does Education Affect the Pay Gap?  . . . . . . . . . . . . . . . . . . . . . . . . . . . . . . . . . . . . . . . . . . . . . . . . . . . . . . . . . . . . . 12

What Causes the Pay Gap? . . . . . . . . . . . . . . . . . . . . . . . . . . . . . . . . . . . . . . . . . . . . . . . . . . . . . . . . . . . . . . . . . . . . . . . . . . . . 14

                 Occupational Segregation  . . . . . . . . . . . . . . . . . . . . . . . . . . . . . . . . . . . . . . . . . . . . . . . . . . . . . . . . . . . . . . . . . . . . . .  14

                 The Motherhood Penalty  . . . . . . . . . . . . . . . . . . . . . . . . . . . . . . . . . . . . . . . . . . . . . . . . . . . . . . . . . . . . . . . . . . . . . . .  16

                 Direct Gender and Race Discrimination and Bias . . . . . . . . . . . . . . . . . . . . . . . . . . . . . . . . . . . . . . . . . . . . . . . . . .  17

Conclusion . . . . . . . . . . . . . . . . . . . . . . . . . . . . . . . . . . . . . . . . . . . . . . . . . . . . . . . . . . . . . . . . . . . . . . . . . . . . . . . . . . . . . . . . . . 18

Recommendations . . . . . . . . . . . . . . . . . . . . . . . . . . . . . . . . . . . . . . . . . . . . . . . . . . . . . . . . . . . . . . . . . . . . . . . . . . . . . . . . . . . 19

                 Individuals . . . . . . . . . . . . . . . . . . . . . . . . . . . . . . . . . . . . . . . . . . . . . . . . . . . . . . . . . . . . . . . . . . . . . . . . . . . . . . . . . . . . .  19

                 Employers . . . . . . . . . . . . . . . . . . . . . . . . . . . . . . . . . . . . . . . . . . . . . . . . . . . . . . . . . . . . . . . . . . . . . . . . . . . . . . . . . . . . .  19

                            Conducting Pay Audits . . . . . . . . . . . . . . . . . . . . . . . . . . . . . . . . . . . . . . . . . . . . . . . . . . . . . . . . . . . . . . . . . . . . 20

                            Prohibiting Retaliation for Wage Disclosure . . . . . . . . . . . . . . . . . . . . . . . . . . . . . . . . . . . . . . . . . . . . . . . . . 20

                            Banning the Use of Prior Salary History . . . . . . . . . . . . . . . . . . . . . . . . . . . . . . . . . . . . . . . . . . . . . . . . . . . . .  21

                 Government . . . . . . . . . . . . . . . . . . . . . . . . . . . . . . . . . . . . . . . . . . . . . . . . . . . . . . . . . . . . . . . . . . . . . . . . . . . . . . . . . . . 22

                            Federal  . . . . . . . . . . . . . . . . . . . . . . . . . . . . . . . . . . . . . . . . . . . . . . . . . . . . . . . . . . . . . . . . . . . . . . . . . . . . . . . . . . 22

                            State  . . . . . . . . . . . . . . . . . . . . . . . . . . . . . . . . . . . . . . . . . . . . . . . . . . . . . . . . . . . . . . . . . . . . . . . . . . . . . . . . . . . . 24

What Should I Do If I Experience Pay Discrimination at Work?  . . . . . . . . . . . . . . . . . . . . . . . . . . . . . . . . . . . . . . . . . . . 25

Take Action with AAUW  . . . . . . . . . . . . . . . . . . . . . . . . . . . . . . . . . . . . . . . . . . . . . . . . . . . . . . . . . . . . . . . . . . . . . . . . . . . . . . 26

Bibliography . . . . . . . . . . . . . . . . . . . . . . . . . . . . . . . . . . . . . . . . . . . . . . . . . . . . . . . . . . . . . . . . . . . . . . . . . . . . . . . . . . . . . . . . . 27

AAUW • www.aauw.org                                                                                    THE SIMPLE TRUTH ABOUT THE GENDER PAY GAP | Fall 2018 Edition                                             3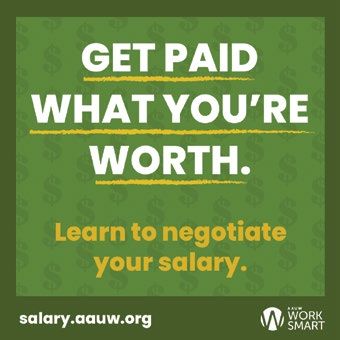
FOREWORD

    R    esearch has been a key element of AAUW’s work for women’s pay equity since the
         release of our 1896 report Compensation in Certain Occupations of Women Who Have
    Received College or Other Special Training. Research empowers our members and other
    advocates with the facts they need to express the problems associated with the gender
    pay gap: It’s real, it’s persistent, and it’s causing economic hardships for women and their
    families. And, as demonstrated by the fact that we’ve been working on this issue since
    1896, the gap is closing too slowly.

    This year AAUW released its strategic plan with a vision to achieve equity for all. Closing
    the gender pay gap is a core element of our work to improve women’s economic security,
    and our research informs and enhances our ongoing programs and advocacy that are
    pushing to end the pay gap. We continue to advocate for much-needed federal legislation
    that would strengthen fair-pay laws and level the playing field for women. We’ve also
    been proud to support and witness real progress at the local and state level, as lawmakers
    devise creative approaches to closing the gender pay gap. We promote best practices
    for employers, and we are working to empower women to secure their financial futures.
    In partnership with cities and organizations across the United States, our Start Smart and
    Work Smart salary negotiation workshops and newly-launched online e-learning tool are
    expanding to help millions of women secure the pay they deserve.

    Pay equity will continue to be an AAUW priority until the gap is fully eliminated. We hope this
    new edition of The Simple Truth motivates and empowers you as you join us in this cause.

                              Julia T. Brown, Esq.			               Kimberly Churches

                              Board Chair				                       Chief Executive Officer

4   THE SIMPLE TRUTH ABOUT THE GENDER PAY GAP | Fall 2018 Edition                             AAUW • www.aauw.org
INTRODUCTION

In 2017, women working full time and year-round in the United States typically were paid just
 80 percent of what men were paid, a gap of 20 percent (Fontenot et al., 2018).

The gap has narrowed since 1960, due largely to                         The pay gap follows women throughout their time in
women’s progress in education and workforce                             the workforce, and even after they leave the workforce.
participation and to men’s wages rising at a slower                     Employers’ use of women’s prior salary history to set
rate. At the rate of change between 1960 and 2017,                      their wages in new jobs means wage discrimination
women are expected to reach pay equity with men                         carries forward from job to job, compounding over
in 2059. But even that slow progress has stalled in                     time. And because women typically are paid less than
recent years. If change continues at the slower rate                    men during working years, women receive less income
seen since 2001, women will not reach pay equity                        than men do from Social Security, pensions, and other
with men until 2106 (figure 1).                                         sources when they retire. (Fischer & Hayes, 2013).
                                                                        Other benefits, such as disability and life insurance, are
The gender pay gap has lifelong financial effects. For
                                                                        also smaller for women because these benefits usually
one, it contributes directly to women’s poverty. In
                                                                        are based on earnings.
2017, 13 percent of American women ages 18–64 were
living below the federal poverty level, compared with                   The impact of the pay gap has also broadened in
9 percent of men. For ages 65 and older, 11 percent of                  recent years as a result of changes in family structure.
women and 8 percent of men were living in poverty                       Between 1967 and 2015, the proportion of mothers
(Fontenot et al., 2018).                                                working outside the home and contributing at least

    FIGURE 1: Women's Median Annual Earnings as a Percentage of Men's for Full-time, Year-round Workers
                                       1960-2017 and Projections
                                                                                                                                            100%
                 Projection of 1960 – 2017 Trend
                                                                                                                                            95%
                 Projection of 2001 – 2017 Trend

                                                                                                                                            90%
                                                                                                                    Equity in 2059
                                                                                                                                            85%

                                                                                                                                            80%
                                                                                                          Equity in 2106
                                                                                                                                            75%

                                                                                                                                            70%

                                                                                                                                            65%

                                                                                                                                            60%

                                                                                                                                            55%

                                                                                                                                            50%
                                                                           2000

                                                                                                                                     2030
                                                                                   2005

                                                                                                             2020

                                                                                                                         2025
                                                                                           2010
                                       1980
 1960

                                                          1990
                                                   1985
          1965

                                                                 1995

                                                                                                   2015
                     1970

                              1975

Source: AAUW analysis of Fontenot (2018)

AAUW • www.aauw.org                                                     THE SIMPLE TRUTH ABOUT THE GENDER PAY GAP | Fall 2018 Edition              5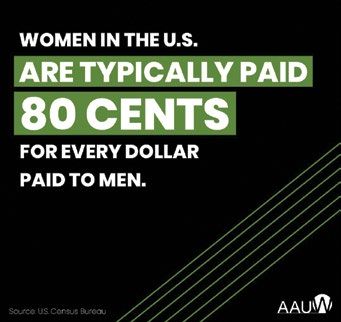
a quarter of the family’s earnings rose from less
    than a third (28 percent) to nearly two-thirds (64
    percent). Today, 42 percent of mothers with children
    under the age of 18 are their families’ primary or sole
    breadwinners (Glynn, 2016). As families increasingly
    rely on women’s wages to make ends meet, the
    gender pay gap directly affects more men and
    children as well.

    Closing the gender pay gap would have a large
    impact on women, their families, and the economy.
    Eliminating the gender pay gap by increasing
    women’s pay to match that of men of the same age
    and education level would cut the poverty rate for
    all working women in half, regardless of their family
    structure. Closing the gender pay gap would also
    provide a boost to the economy. Providing equal pay
    to women would increase the wages paid into the
    economy by $513 billion, which represents 3 percent
    of the 2016 gross domestic product (Milli et al., 2017).

    This guide provides key facts about the gender pay gap
    in the United States. Included are breakdowns of the
    gender pay gap by race and ethnicity, by education, by
    age, and by occupation, as well as a detailed discussion
    of the causes of the gender pay gap. In addition, the
    guide provides detailed recommendations about
    how individuals, employers, and policymakers can
    contribute to closing these pay gaps.

6   THE SIMPLE TRUTH ABOUT THE GENDER PAY GAP | Fall 2018 Edition   AAUW • www.aauw.org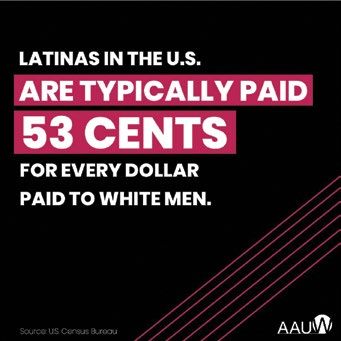
WHAT IS THE PAY GAP?

T    he pay gap is the difference in men’s and women’s median earnings, usually reported as
     either the earnings ratio between men and women or as an actual pay gap, as defined
below. The median value is the middle value, with equal numbers of full-time workers
earning more and earning less. In 2017, median annual earnings in the United States for
women and men working full time and year-round were $41,977 and $52,146, respectively
(Fontenot et al., 2018).

                   Women’s Median earnings                     [Men’s median earnings–Women’s median earnings]
Earnings Ratio =                                   Pay Gap =
                      Men’s median earnings                                   Men’s median earnings

                          $41,977                                             [$52,146–$41,977]
2017 Earnings Ratio =                = 80.499 ≈ 80%        2017 Pay Gap =                           = 19.501 ≈ 20%
                          $52,146                                                   $52,146

The ratio and gap above are calculated comparing           and the Bureau of Labor Statistics (U.S. Census
women of all races and ethnicities to men of all races     Bureau, 2016).
and ethnicities. The gap in the earnings for women of      The estimate of the pay gap using weekly earnings
different racial and ethnic groups is usually calculated   is based on the annual average of median weekly
with white, non-Hispanic men as the comparison             earnings for the previous year, usually released every
group. These comparisons are discussed in the              January by the Bureau of Labor Statistics (www.bls.
following sections.                                        gov/cps). The estimate of the pay gap using annual
Earnings can also be reported on a weekly basis. The       earnings is based on the CPS Annual Social and
gender pay gap in weekly earnings tends to be slightly     Economic Supplement, which is published each
smaller than the pay gap in terms of annual earnings.      September by the Census Bureau and the Bureau of
In 2017, the pay gap in median weekly earnings was 18      Labor Statistics. Compared with other government
percent (U.S. Bureau of Labor Statistics, 2018a).          surveys, the CPS provides more detailed information
                                                           on income. In recent years, this information has been
WHERE DO THE DATA COME FROM?                               published in the report Income and Poverty in the
Federal agencies, such as the U.S. Census Bureau, the      United States (Fontenot et al., 2018).
U.S. Department of Education, and the U.S. Bureau
of Labor Statistics, conduct surveys of individuals,       STATE-LEVEL DATA
households, and businesses to gather information           A pay gap can also be calculated for each state (figure
about people’s salaries and other earnings.                2). The American Community Survey (ACS) (www.
                                                           census.gov/acs) is a detailed annual survey distributed
Most reports on national workforce participation, pay,
                                                           to a broad sample of U.S. households; it supplements
and pay differences depend on data from the Current
                                                           the U.S. census of all Americans, which only occurs
Population Survey (CPS) (www.census.gov/cps), the
                                                           once per decade. The ACS is often used (including
country’s primary source of labor force statistics. The
                                                           in this report) to estimate more detailed analyses of
CPS is a monthly survey with a sample of 100,000
                                                           subpopulations and geographical areas, such as the
households, sponsored jointly by the Census Bureau

AAUW • www.aauw.org                                        THE SIMPLE TRUTH ABOUT THE GENDER PAY GAP | Fall 2018 Edition   7
state-level pay gap and the gap
FIGURE 2: Median Annual Earnings and Earning Ratio for Full-time,
for smaller racial/ethnic groups Year-round Workers, by State and Gender, 2017
(e.g., Native Hawaiian or other Men Women Earnings Ratio
Pacific Islander and American California $52,487 $46,783 89%
Indian or Alaska Native workers). District of Columbia $74,877 $66,679 89%
New York $55,636 $48,901 88%
The reason is that it includes more
Florida $42,261 $36,746 87%
households—approximately 3 Delaware $54,657 $47,052 86%
million per year—compared with Vermont $48,924 $41,976 86%
the 100,000 surveyed in the CPS Maryland $61,263 $52,381 86%
(U.S. Census Bureau, 2016). The Arizona $46,681 $39,675 85%
North Carolina $46,289 $38,784 84%
ACS results are released annually in
Rhode Island $55,183 $46,146 84%
September, and briefs based on the Nevada $45,439 $37,880 83%
survey can be found on the Census New Mexico $42,690 $35,523 83%
Bureau’s website. According to Massachusetts $65,939 $54,646 83%
Connecticut $62,976 $52,120 83%
ACS data, in 2017 the pay gap
Georgia $47,114 $38,958 83%
was smallest in California, where Maine $49,476 $40,618 82%
women were paid 89 percent of Minnesota $55,812 $45,798 82%
what men were paid. The largest Alaska $57,943 $47,472 82%
was in Louisiana, where women Tennessee $45,032 $36,812 82%
Oregon $50,965 $41,572 82%
were paid 69 percent of what men
Colorado $54,869 $44,733 82%
were paid (figure 2). Texas $49,414 $40,236 81%
Hawaii $51,594 $41,664 81%
United States $52,146 $41,977 80%
Pennsylvania $52,111 $41,929 80%
New Jersey $64,497 $51,538 80%
Wisconsin $51,346 $40,930 80%
North Dakota $51,563 $40,964 79%
New Hampshire $57,966 $46,044 79%
Virginia $57,690 $45,692 79%
Arkansas $43,266 $34,154 79%
Iowa $50,295 $39,658 79%
Montana $45,616 $35,964 79%
Kentucky $46,289 $36,487 79%
Missouri $47,436 $37,339 79%
Washington $60,893 $47,681 78%
Michigan $51,749 $40,453 78%
Ohio $51,000 $39,774 78%
Illinois $55,585 $43,149 78%
Wyoming $51,948 $40,200 77%
South Carolina $45,477 $35,142 77%
Nebraska $50,293 $38,726 77%
Kansas $49,267 $37,931 77%
Oklahoma $46,114 $35,488 77%
South Dakota $46,170 $35,424 77%
Note: National data include workers ages Mississippi $42,287 $32,441 77%
15 and older and are based on the Current Idaho $46,241 $34,665 75%
Population Survey. State-level statistics West Virginia $47,425 $35,078 74%
include workers ages 16 and older are based Alabama $48,199 $35,414 73%
on the American Community Survey. Indiana $50,782 $37,167 73%
Source: Fontenot et al. (2018), Utah $52,249 $37,252 71%
U.S. Census Bureau (2018a) Louisiana $50,445 $34,708 69%
8 THE SIMPLE TRUTH ABOUT THE GENDER PAY GAP | Fall 2018 Edition AAUW • www.aauw.orgHOW DOES THE PAY GAP AFFECT WOMEN
OF DIFFERENT DEMOGRAPHICS?
T he pay gap affects women from all backgrounds, at all ages, and of all levels of educational
achievement, although earnings and the gap vary depending on a woman’s individual situation.
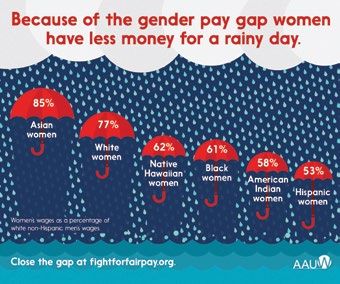
RACE/ETHNICITY
The overall gender pay gap is useful for understanding than men in the same group (figure 3). Among full-time
the impact of gender on women’s pay, but there is no workers in 2017, Hispanic or Latina, American Indian
single gender pay gap or race pay gap since women of or Alaska Native (AIAN), black or African American, and
different backgrounds have very different experiences Native Hawaiian or other Pacific Islander (NHPI) women
and earnings. However, across all racial and ethnic had lower median annual earnings compared with non-
groups, women working full time are typically paid less Hispanic white and Asian women.
FIGURE 3: Median Annual Earnings, by Race/Ethnicity and Gender, 2017
$80,000
$70,000 $66,221
$58,014
$60,000
$51,824
$50,000 $45,506
$40,370 $42,135
$36,568 $38,887
$40,000 $35,963 $35,879
$31,364 $33,571 78%
78%
$30,000
89% 85%
$20,000 86% 86%
$10,000
$0
Hispanic or Latina/o American Indian Black or Native Hawaiian and White Asian
or Alaska Native African American Other Pacific Islander (non-Hispanic)
Source: U.S. Census Bureau (2018a)
Because non-Hispanic white FIGURE 4: Women’s Earnings as a Percentage of White Men’s Earnings,
men are the largest and most by Race/Ethnicity, 2017
Current American
advantaged demographic group in
Population Community
the labor force, they are often used Survey (CPS) Survey (ACS)
as a benchmark for the earnings Hispanic or Latina 53% 54%
of women of different races and Black or African American 61% 62%
ethnicities. Compared with the White (non-Hispanic) 77% 78%
Asian 85% 89%
salaries of white men, Asian women’s
Native Hawaiian or Other Pacific Islander -- 62%
salaries show the smallest gender
American Indian or Alaska Native -- 58%
pay gap, at 85 percent of white Note: Based on median annual earnings of full-time, year-round workers. CPS includes
men’s earnings. The gap was largest workers 15 and older, ACS includes workers 16 and older. The CPS is the preferred data
source for income estimates, but lacks sufficient sample size for reporting on smaller
for Hispanic women, who were paid demographic groups. See page 7 for a more detailed description of the CPS and ACS.
only 53 percent of what white men Source: U.S. Census Bureau (2018a, 2018b)
were paid in 2017 (figure 4).
AAUW • www.aauw.org THE SIMPLE TRUTH ABOUT THE GENDER PAY GAP | Fall 2018 Edition 9Though these are the major racial and ethnic divisions are on average paid better than the typical white
for which the U.S. government routinely provides man, but Burmese, Hmong, and Laotian women on
pay breakdowns, it’s important to recognize that the average are paid significantly less—60 percent or less
figures can obscure substantial variation within those of what white men are paid (National Partnership for
groups. For instance, among Asian women in the Women and Families, 2018).
United States, women of Indian and Chinese descent
AGE
Earnings for both female and male full-time In 2017, for full-time workers ages 20–24, women were
workers tend to increase with age, though paid 90 percent of what men were paid on a weekly
earnings increase more slowly after age 45 and basis. As workers grow older and progress in their careers,
even decrease after age 55. The gender pay gap median earnings for women grow more slowly than
also grows with age, and differences among older median earnings for men, resulting in larger gaps for
workers are considerably larger than differences women (figure 5). Women 55–64 years old are paid 78
among younger workers. percent as much as men in the same age range, a gap
that is more than double the gap for women ages 20–24.
FIGURE 5: Median Weekly Earnings, by Gender and Age, 2017
$1,200
■ Women ■ Men $1,103 $1,098
XX% Women’s earnings as a $1,062
$1,016
percentage of men’s earnings
$1,000
$821 81% 78% 78%
$800
77%
88% $860 $855 $856
$570 $782
$600 $724
$459 90%
$400 88% $514
$402
$200
$0
16 to 19 years 20 to 24 years 25 to 34 years 35 to 44 years 45 to 54 years 55 to 64 years 65 years and older
Note: Based on median usual weekly earnings of full-time wage and salary workers, 2017 annual averages
Source: U.S. Bureau of Labor Statistics (2018c)
DISABILITY
Disability status is a challenging demographic to paid significantly less than people without a disability.
capture because it includes many different disabilities In 2017, median pay for women with disabilities was
and conditions. In the current ACS questionnaire, 72 percent that of men with disabilities; women with
disability is measured by answering questions related a disability made 48 percent as much as men without
to six disability types: hearing, vision, cognitive, a disability (figure 6). (These data include all workers
ambulatory, self-care, and independent living (U.S. regardless of full-time or year-round status.)
Census Bureau, 2017). People with disabilities are
10 THE SIMPLE TRUTH ABOUT THE GENDER PAY GAP | Fall 2018 Edition AAUW • www.aauw.orgThere are many factors that contribute to the pay FIGURE 6: Median Annual Earnings by Disability
gap for individuals with disabilities, ranging from Status and Gender, 2017
lack of access to educational and employment $50,000
opportunities to direct bias and discrimination.
One likely factor is a provision of the Fair Labor $40,952
$40,000
Standards Act, which makes it legal to pay some
people with disabilities less than minimum wage.
$29,771
About 150,000 Americans with disabilities are paid $30,000 $27,310
less than minimum wage, in some cases as little as 73%
pennies per hour (U.S. Department of Labor, 2018; $19,697
$20,000
U.S. Department of Justice, 2015).
72%
SEXUAL ORIENTATION AND GENDER IDENTITY $10,000
A study of the pay received by gay men, lesbians,
and bisexual men and women found that all three $0
With a disability No disability
groups have labor market outcomes that diverge
■ Women ■ Men
from heterosexual workers. Gay men are paid less
than straight men, while lesbians are paid more than Source: U.S. Census Bureau (2018a)
straight women, but both differences are attributed
primarily to differences in family structure: Gay men in the workplace because of their gender identity, as
do not receive the “fatherhood bonus” that many well as discrimination and obstacles in other domains
straight men receive, while lesbians are more likely that further harm their economic security (U.S. Equal
than straight women to avoid the “motherhood Employment Opportunity Commission, 2018a; Center
penalty” due to a lower likelihood of having children for American Progress, 2015).
(see below on the causes of the pay gap). Bisexuals
People who transition from male to female gender
seem to face lower earnings primarily as a result of
expression experience a drop in pay after the transition,
discrimination (Mize, 2016).
while those who transition from female to male
However, the gender pay gap is consistent across gender expression see no difference in pay or even a
sexual orientation: Regardless of sexual orientation, small increase (Grant et al., 2011; Schilt and Wiswall,
women tend to have lower earnings than men. As a 2008). The experiences of transgender people provide
result, eliminating the gender pay gap would lower insight into gender stereotypes and bias and how these
poverty rates for couples that include at least one factors play a role in the gender pay gap.
woman (Williams Institute, 2015).
While the U.S. Equal Employment Opportunity
When analyzing the gender pay gap, it’s also important Commission (EEOC) does currently assert that
to include people who do not identify with the gender lesbian, gay, bisexual, and transgender workers are
they were assigned at birth. The Williams Institute protected from wage discrimination under Title VII of
estimates that 1.4 million adults in the United States the Civil Rights Act of 1964 (U.S. Equal Employment
identify as transgender (2016). More than one-quarter Opportunity Commission, 2018a), these groups still
of respondents to a survey of transgender people lack uniform federal legislative protections against
reported an income of less than $20,000 annually, workplace discrimination. Federal court rulings and
while another analysis found that 15 percent of state and local laws are inconsistent, meaning that
transgender people have earnings less than $10,000 workplace protections for LGBT workers are not
annually, compared to 4 percent of the general sufficiently robust or comprehensive with respect to
population (Grant et al., 2011). Transgender people challenging their wage gaps.
frequently experience harassment and discrimination
AAUW • www.aauw.org THE SIMPLE TRUTH ABOUT THE GENDER PAY GAP | Fall 2018 Edition 11HOW DOES EDUCATION AFFECT
THE PAY GAP?
A s a rule, earnings increase as years of education increase for both men and women. Though
more education is an effective tool for increasing earnings, women’s median earnings are less
than men’s median earnings at every level of academic achievement (figure 7). In Graduating to a Pay
Gap: The Earnings of Women and Men One Year after College Graduation, AAUW found that just one
year after college graduation, women were paid 82 percent of what men were paid (AAUW, 2012).
FIGURE 7: Median Weekly Earnings, by Level of Education and Gender, 2017
$2,000
■ Women ■ Men
XX% Women’s earnings as a $1,737
$1,750 percentage of men’s earnings
$1,500 $1,378
$1,250 $860 74%
$1,000 74% $1,291
$917
$724
$797
$1,013
$750 76%
$584
77%
$500 77% $700
$610
$447
$250
$0
Less than a High School graduate Some College or Bachelor's degree Advanced degree
high school diploma Associate degree
Note: Based on median usual weekly earnings of full-time wage and salary workers, ages 25 and older, 2017 annual averages.
Source: U.S. Bureau of Labor Statistics (2018b)
Across all racial and ethnic groups, American women women gain degrees in more lucrative majors and
now earn more college and postgraduate degrees than pursue higher-paying occupations, women still tend
men (U.S. Department of Education, 2016b). Though to be concentrated in lower-paying subfields and are
education does not eliminate the gender pay gap, paid less across fields, even with advanced degrees
the success of women in postsecondary education is (Carnevale, 2018).
helping to narrow the overall gender pay gap. Without Furthermore, earnings at different education levels are
women’s greater educational attainment, the current affected by race and ethnicity, as well as gender. White
gender pay gap would be larger (Blau and Kahn, 2017). women are paid more than black and Hispanic women
However, women with college degrees who work full at all education levels (figure 8). Research suggests that
time make, on average, 26 percent less than their male differences in education and other measurable factors
peers with college degrees (figure 7). It is important explain part of the difference in earnings between
to note that this gap is larger than the gap for women racial and ethnic groups. However, as is the case with
overall; although women with degrees have higher gender, part of the racial and ethnic pay gap cannot be
earnings than women without degrees, men with explained by other factors known to affect earnings and
degrees have even higher earnings. And even when is likely due to discrimination.
12 THE SIMPLE TRUTH ABOUT THE GENDER PAY GAP | Fall 2018 Edition AAUW • www.aauw.orgFIGURE 8: Median Weekly Earnings of Women, by Race/Ethnicity and Level of Education, 2017
$1,600
$1,462
$1,400 $1,306
$1,200 $1,155$1,133
$1,090
$1,031
$1,000 $915 $897
$800 $717 $710
$663 $633
$627 $591
$600 $575 $539
$431 $450 $446 $438
$400
$200
$0
Less than a High School graduate Some College or Bachelor's degree Advanced degree
high school diploma Associate degree
■ Hispanic or Latina ■ Black or African American ■ White (non-Hispanic) ■ Asian
Note: Based on median usual weekly earnings of full-time wage and salary workers, ages 25 and older, 2017 annual averages.
Source: U.S. Bureau of Labor Statistics (2018b)
As discussed above, the gender pay gap persists across and Hispanic women working full time are paid
education levels and is worse for black and Hispanic considerably less than men from these groups, and
women, even among college graduates. As a result of they struggle to pay off student loans promptly:
the pay gap, women who complete college degrees Four years after graduation, black and Hispanic
are less able than men initially to afford college and women had paid off less than 10 percent of their
then less able to pay off their student loans promptly debt—much less than other women and men (figure
afterwards. As a result, women pay more in interest 9). While repaying student loans, approximately 1
and make payments for a longer time. Women take in 3 female college graduates experience difficulty
on larger initial loans than men, with black women meeting their financial obligations, compared to
holding more debt than any other group when 1 in 4 men; more than half of black women with
graduating with a bachelor’s degree. AAUW’s research bachelor’s degrees experience financial difficulties
estimates that women hold nearly two-thirds—or while repaying student loans (AAUW, 2018a).
almost $900 million—of outstanding student debt in
the United States (AAUW, 2018a).
Student debt and the pay gap
FIGURE 9: Cumulative Student Debt for 2007-08 College Graduates, by
mean that women have a more Gender and Race/Ethnicity
difficult time making ends meet Total average Total average Percentage of
while they are repaying their debt owed, debt owed, debt paid off,
loans. In 2012, among students 2009 2012 2009-12
Men $22,656 $12,793 44%
who graduated in 2007–08,
Women $24,126 $16,105 33%
women working full time had paid
Asian $19,687 $7,679 61%
off 33 percent of their student
White (non-Hispanic) $24,479 $15,417 37%
loan debt on average, while men Black or African American $26,535 $24,116 9%
working full time had paid off Hispanic or Latina $21,626 $21,026 3%
44 percent of their debt. Black Source: AAUW analysis of U.S. Department of Education (2015)
AAUW • www.aauw.org THE SIMPLE TRUTH ABOUT THE GENDER PAY GAP | Fall 2018 Edition 13WHAT CAUSES THE PAY GAP?
T he gap of 20 cents on the dollar between men and women working full time and year-
round is a statistical fact, though the overall pay gap summarizes a huge diversity of
women and life circumstances. The origins of the pay gap are also more complicated than
a single cause. From birth, gendered perceptions and expectations mean that boys and girls
have different experiences and take different paths through education and training on their
way to the workforce. Factors such as race, class, sexual orientation, and disability mean
different women have different opportunities and advantages. Once in the workforce, women
and men again face gendered perceptions, expectations, and other biases.
As a result of the cumulative impact of gendered OCCUPATIONAL SEGREGATION
experiences and biases, women and men participate Early in boys’ and girls’ educational experiences, there
in the workforce in different ways and are treated are gendered expectations regarding what boys and girls
differently by employers. As noted above, women’s are “good” at or “should” be focusing on. These different
greater educational attainment is helping to shrink expectations, as well as external pressure to conform to
the gap overall. Furthermore, unionization exerts a stereotypes about gender roles, follow women and men
larger positive effect on women’s wages than men’s, into classes and extracurricular activities, their college
also decreasing the size of the gap (U.S. Bureau of majors, and their career directions.
Labor Statistics, 2018c). But the remaining 20 cent
In 2017 the U.S. civilian workforce included 160 million
pay gap is the result of the cumulative effect of
full- and part-time employed workers. Of these, 53
the ways that men’s and women’s experiences and
percent were men, and 47 percent were women (U.S.
treatment in the workforce still differ and reduce
Bureau of Labor Statistics, 2018d). But women and
women’s earnings.
men tend to work in different kinds of jobs. Women are
Men and women may be steered toward different disproportionately represented in education, office and
industries and occupations. Sectors and jobs administrative support, and health care occupations.
where men tend to work are, on average, better Men are disproportionately represented in
compensated than those where women tend to work. construction, maintenance and repair, and production
Moreover, due to work and home structures still built and transportation occupations (U.S. Bureau of Labor
around the presumption that women will be primary Statistics, 2018e). Segregation by occupation is a
caretakers, women are more likely to drop out of major factor behind the pay gap. Even though a pay
the workforce temporarily as a result of parenting or gap exists within nearly every occupational field, jobs
other family obligations. Women of color experience traditionally associated with men tend to pay better
outcomes and pay that are worse than would be than traditionally female-dominated jobs that require
expected as a result of race and gender separately, the same level of skill (Hegewisch & Hartmann, 2014).
suggesting that gendered racism is a distinct
Occupational segregation is facilitated through the
contributor to the gap. The remaining gap apart from
practice of “steering.” Steering occurs when women are
these factors cannot be explained by other observable
channeled into jobs with lower pay (or lower long-term
characteristics. Many researchers attribute it to direct
pay potential) than other similar jobs, based on the
gender bias and discrimination.
14 THE SIMPLE TRUTH ABOUT THE GENDER PAY GAP | Fall 2018 Edition AAUW • www.aauw.orgperception of “women’s work.” Therefore, compensation for the occupation as a whole actually decrease, even
disparities can arise where employers track women for men in the field (Levanon et al., 2009).
into low-paying jobs or limit their opportunities for Women are not drawn to low-paying fields because
promotions or transfers to better jobs. they desire low pay; the work that women do is valued
Occupational gender segregation has decreased over less than work done by men because that work is
the last 40 years, largely due to women moving into done by women. Men are paid more watching cars (as
formerly male-dominated jobs, especially during the parking lot attendants) than women are paid watching
1970s and 1980s, and to faster growth of more evenly children (as child care workers), but few would argue
mixed-gender occupations in the 1990s. But integration that the former is more intrinsically valuable work (U.S.
has stalled since the early 2000s. Occupational Bureau of Labor Statistics, 2018e).
segregation also continues to affect some women The research and data indicate, therefore, that women
more than others: Of all racial and ethnic groups, experience pay gaps in nearly every line of work,
Hispanic women and men are the least likely to work in regardless of occupational qualifications or setting.
the same jobs (Hegewisch & Hartmann, 2014). Among the 114 occupations held by at least 50,000
Working in traditionally male fields will likely improve men and 50,000 women in 2017, 107 had a statistically
wages for individual women, but it is unlikely to significant pay gap favoring men and six had non-
eliminate the pay gap. Women in such male-dominated significant gaps. Only one occupation had a “reverse”
jobs as computer programming still face a pay gap gap favoring women. Considering the gap in pay, along
compared with men in the field, even though women with the number of women employed in an occupation,
in such jobs may be paid higher salaries than women allows for a rough estimate of how much women in
in traditionally female fields. And moving into a higher- that occupation could gain from equal pay: $19.6 billion
paying field can have diminishing returns for women for financial managers, $19.5 billion for doctors and
over time. A study of 50 years of U.S. workforce data surgeons, $10.7 billion for lawyers, and $10.0 billion for
concluded that when an influx of women enters a chief executives. Below are the gender pay gaps for the
previously male-dominated profession, average wages 10 largest occupations for women (figure 10).
FIGURE 10: Women Employed, Earnings, Pay Ratio, and Total Occupation Gap, Largest Occupations for
Women, 2017
Women Men's Median Women's Median Gender Occupation
Employed Earnings Earnings Pay Ratio Gap
Registered nurses 2,092,489 $71,590 $65,612 92% $12,509,000,000
Secretaries and administrative assistants 2,060,289 $42,566 $38,470 90% $8,439,000,000
Elementary and middle school teachers 1,933,074 $55,197 $50,766 92% $8,565,000,000
Customer service representatives 1,196,513 $37,623 $32,893 87% $5,660,000,000
First-line supervisors of retail sales workers 1,177,835 $47,774 $35,217 74% $14,790,000,000
Nursing, psychiatric, and home health aides 1,071,789 $30,125 $26,816 89% $3,547,000,000
Accountants and auditors 1,014,827 $77,320 $60,280 78% $17,293,000,000
Office clerks, general 734,622 $39,160 $35,226 90% $2,890,000,000
First-line supervisors of office and
729,985 $57,466 $46,555 81% $7,965,000,000
administrative support workers
Bookkeeping, accounting, and auditing clerks 723,342 $45,254 $39,939 88% $3,845,000,000
Source: U.S. Census Bureau (2018a)
AAUW • www.aauw.org THE SIMPLE TRUTH ABOUT THE GENDER PAY GAP | Fall 2018 Edition 15THE MOTHERHOOD PENALTY
Becoming a parent produces very different
professional outcomes for women and men. Mothers
working full time are paid 71 percent as much as
fathers (National Women’s Law Center, 2018). Taking
time away from the workforce or cutting back
hours, both more common scenarios for mothers
than fathers, hurts earnings (Bertrand et al., 2010).
Many employers and industries still prioritize long,
continuous, traditional work hours rather than flexible
schedules, a preference that tends to put women
with children at a disadvantage (Goldin, 2014). In
2017, 71 percent of mothers of children under age
18 participated in the labor force, compared with 93
percent of fathers of children under age 18 (U.S. Bureau
of Labor Statistics, 2018f).
Many working mothers also encounter a “motherhood new fathers. In the United States, there is no national
penalty,” which extends beyond their actual time out of paid parental leave right or system and only 15 percent
the workforce. Experimental studies have documented of workers receive paid parental leave from their
that employers are less likely to hire mothers (including employers (Raub et al., 2018, U.S. Bureau of Labor
mothers who never left the workforce) than they are Statistics 2017). As a result, most new parents must
to hire women without children, and when employers cobble together other types of paid leave, take shorter
do make an offer to a mother, they offer her a lower leaves than they would prefer, or return to work as
salary than they offer to other women (Correll & soon as possible after childbirth to avoid lost wages.
Benard, 2007; Kricheli-Katz, 2012). The magnitude Another factor making it difficult for women to
of the penalty for mothers in the workforce has participate fully in the American workforce is
remained steady for the past few decades or even the expectation they will continue to be primary
increased slightly for some mothers after accounting caretakers. Compounding this is limited availability
for education and work experience (Lee et al., 2018). and high price of child care, especially care for young
Fathers, in contrast, do not suffer a penalty compared infants and toddlers. The average price of child care
with other working men. Many fathers actually receive in the United States is $8,800 per child per year, and
higher wages after having a child, known as the the average for infants in child care center settings is
“fatherhood bonus” (Killewald, 2013; Budig, 2014). $11,100. Costs are much higher in cities and states with
The very different experiences of women and men higher costs of living (Child Care Aware of America,
who become parents are the result of gendered 2017). Paying for child care for one or more children
norms and expectations, institutional systems built may be impractical or impossible for parents with low
around a worker who is not a primary caretaker, and incomes, who are disproportionately women. As a
a lack of systemic supports for new parents in the result, mothers who might otherwise remain in the
United States. Nearly every other country in the world workforce may lose years of earnings and salary history
mandates access to paid leave for new mothers, and as they care for their children.
most developed countries provide similar leave for
16 THE SIMPLE TRUTH ABOUT THE GENDER PAY GAP | Fall 2018 Edition AAUW • www.aauw.orgDIRECT GENDER AND RACE DISCRIMINATION AND BIAS
Not all of the gender and race pay gaps can be researchers found an unexplained gap of 6 percent
explained by observable differences in college major, between comparable men and women in the field, and
occupation, work hours, and time out of the workforce. a recent study of the American workforce as a whole
Direct discrimination and bias against women in the found an unexplained gap of 8 percent (Jagsi et al.,
workplace are also culprits in the pay gap. 2012; Blau & Kahn, 2017).
Each year, the EEOC receives thousands of sex, As noted above, women of different racial and ethnic
race, and other pay discrimination complaints, and groups in the United States have widely varying gaps
many of these are decided or resolved in favor of the in their earnings when compared to white men. These
person who filed the charge (U.S. Equal Employment statistics reflect cumulative disadvantages resulting
Opportunity Commission, 2018b). from different circumstances and opportunities,
including direct and structural racial bias, the effect of
In part due to persistent sex discrimination, women are
gender bias, and the intersectional effect of belonging
also less likely than men to reach the highest-paying
to groups that experience unique stereotypes and bias
leadership and executive positions. In 2015, women
(e.g. black women). For instance, while all women are
held only 26 percent of private-sector executive
underrepresented in executive positions relative to
positions, and women of color are particularly unlikely
their labor force participation, black women are the
to hold such positions (AAUW, 2016). In addition,
most underrepresented of any group (AAUW, 2016).
women make up just 22 percent of chief executives
of nonprofit organizations with annual budgets of $50 The intersectional impact of race and gender biases
million or more—despite making up about 75 percent of contributes to the overall gender pay gap, as women
the nonprofit workforce—and female chief executives of color experience pay outcomes that are worse
of nonprofits experience a pay gap relative to men who than would be predicted by the additive effect of
lead organizations of similar size (AAUW, 2018b). race and gender separately (Blau and Kahn, 2017).
In other words, when closely examining the impact
How do we know that discrimination and bias
of race and gender (as well as other factors) on
directly affect women’s pay? Researchers look for the
the pay of black men, black women, white men,
“unexplained” pay gap after statistically accounting
and white women, it is clear that black women
for other factors. For instance, after accounting for
experience a large gap that cannot be attributed to
college major, occupation, economic sector, hours
other observable characteristics, such as occupation
worked, months unemployed since graduation, GPA,
and education, or by race or gender separately (Paul
type of undergraduate institution, institution selectivity,
et al., 2018). Black women’s education and other
age, geographical region, and marital status, AAUW
labor force characteristics are now such that they
found a remaining 7 percent difference between the
would be expected to be paid more than black men
earnings of male and female college graduates one
if gender bias were not a factor. Yet they are still paid
year after graduation. That gap jumped to 12 percent
less (Paul et al., 2018). Women of different racial and
10 years after college graduation (AAUW, 2012; AAUW
ethnic backgrounds all have different experiences
Educational Foundation, 2007). Other researchers
of discrimination, but biases based on race, gender,
have reached similar conclusions about gender
and the intersection of race and gender all contribute
discrimination and the pay gap when controlling
measurably to the overall gap.
for certain factors. For instance, a study of medical
AAUW • www.aauw.org THE SIMPLE TRUTH ABOUT THE GENDER PAY GAP | Fall 2018 Edition 17CONCLUSION
T he gender pay gap is persistent and ongoing: It has closed by less than a nickel during
the 21st century. Statistics show clearly that women experience a pay gap in every state,
at every age, across all racial and ethnic groups, and in nearly every occupation.
Women working full time in the United States are paid 20 percent less than men, despite
greater educational attainment. This gap is a result of gender norms and bias that are woven
throughout women’s experiences in the workforce. Estimates of the “unexplained” pay gap
are often treated as estimates of the effect of direct pay discrimination on women’s earnings,
but the impact of occupational segregation, motherhood penalties, and racial biases on
women’s careers and earnings cannot be dismissed, even if researchers can statistically
account for them.
Moreover, there are factors that exacerbate the pay gap over a woman’s career. For
example, the common employer practice of basing a worker’s starting pay and pay
increases on previous pay carries forward any earlier pay gap from job to job. Additionally,
the practice of penalizing workers for discussing wages in the workplace makes it harder
for individual women to detect or address the effects of bias and discrimination, making the
gap resistant to change.
Closing the gender pay gap requires addressing all of the causes of the gap by changing
cultural norms, improving employer behavior, and implementing public policy initiatives.
AAUW takes a multipronged approach that calls on individuals, employers, and policymakers
to end the gender pay gap for the benefit of women, their families, and society.
18 THE SIMPLE TRUTH ABOUT THE GENDER PAY GAP | Fall 2018 Edition AAUW • www.aauw.orgRECOMMENDATIONS
T he gender pay gap is unlikely to go away on its own, but there are many things that can
make a difference. Here are some steps that individuals, employers, and policymakers can
take to ensure fair pay.
INDIVIDUALS
Because most employers have latitude when it salary negotiation workshops. Start Smart is designed
comes to pay, negotiating one’s salary can pay off. to help college women who are about to enter the
While women can’t negotiate around discrimination, job market, and Work Smart offers training to women
it is helpful for them to know their market value and already in the labor force, training them to negotiate
to push for better wages. Traditionally, it has been for a new job, raise, or promotion. These workshops
socially acceptable for men to negotiate for raises help women determine their market worth based on
because negotiating conforms to the stereotype of their skills, experience, performance, qualifications, and
men as assertive. But negotiation is especially tricky responsibilities on the job. And they provide the tools
for women because some behaviors that work for and business strategies women need to successfully
men, like self-promotion and assertiveness, may negotiate for fair pay for the rest of their careers.
backfire on women (Carter & Silva, 2011; Bowles & Additionally, individuals can also take steps to influence
Babcock, 2013). Knowing what your skills are worth, employers and governments—letters to your legislators
making clear what you bring to the table, emphasizing and local papers, blogs, and tweets are just a few
common goals, and maintaining a positive attitude are examples. Joining an organization like AAUW can
some negotiation tactics that have been shown to be make all of these activities easier, especially if you use
effective (Babcock & Laschever, 2008). our templates and resources and connect with our
To empower women with the skills they need to network of activists.
successfully negotiate salary and benefits, AAUW offers
EMPLOYERS
Equal pay is important for legal and ethical reasons, are paid fairly and how fair and transparent their
but it can also be good for employers’ bottom lines employer’s approach to pay is, but women are more
and employee recruitment and retention. Believing likely to feel “in the dark” about compensation in the
that an employer is fair improves workers’ morale workplace (Payscale, 2017; Glassdoor, 2015).
(Cohen-Charash & Spector, 2001; Kim, 2009). Work There are many practices employers can voluntarily
performance has also been linked to the perception implement to help close the wage gap, including
of organizational justice (Colquitt et al., 2001). In other analyzing their wage data and conducting regular pay
words, workers who believe that they are paid fairly are audits; prohibiting retaliation against their employees
more likely to contribute their best effort to the job. for discussing, disclosing or inquiring about their
Surveys have also found that employee satisfaction wages; and eliminating the practice of using prior
is highly connected to whether employees feel they salary history to set the wages of new employees.
AAUW • www.aauw.org THE SIMPLE TRUTH ABOUT THE GENDER PAY GAP | Fall 2018 Edition 19Conducting Pay Audits and responsibility. Employers then compare
Consider the example of one employer that wages of predominantly female jobs with those of
voluntarily decided to audit its pay practices: In 2015, predominantly male jobs of comparable skill levels. If
Salesforce performed a comprehensive pay audit they find that women are consistently paid less than
and analysis of 17,000 employees that led to salary men for jobs requiring similar levels of knowledge
adjustments for 6 percent of employees and a 33 and responsibility, the employer makes the necessary
percent increase in the number of women who were salary increases. The state’s efforts have been
promoted that year (Zarya, 2016). Salesforce’s actions hugely successful: Since the 1970s, Minnesota has
garnered attention across the country. virtually eliminated the pay gap in public-sector
jobs of comparable value (Legislative Office on the
Understanding the critical role employers play in
Economic Status of Women, 2016). Companies must
ensuring equal pay for the nation’s workforce, the
be sure that they continue to analyze pay decisions—
Obama administration announced a White House
when salaries are set, when job functions change,
Equal Pay Pledge for private sector companies
when bonuses are awarded or raises given—to
committed to equal pay for their employees. These
ensure that salaries remain equitable.
companies committed to conducting annual
gender pay analyses across occupations; reviewing
Prohibiting Retaliation for Wage Disclosure
hiring and promotion processes and procedures to
One significant reason the gender pay gap is closing
reduce unconscious bias and structural barriers; and
so slowly is that pay disparities are notoriously difficult
embedding equal pay efforts into broader company
to detect. Generally, salaries are not public. Because
initiatives (The White House, 2016). After the end
many employees have no way of knowing when they
of the administration, Simmons College now hosts
are shortchanged, it’s hard for them to contest pay
the Employers for Pay Equity Consortium. As of
discrimination on their own.
September 2018, more than 35 companies had joined
the consortium, including Delta Airlines, Deloitte, Furthermore, employees may face retaliation for
Facebook, Gap Inc., General Motors, Johnson & inquiring about wages because some workplaces
Johnson, Microsoft, PepsiCo, and Staples. have pay secrecy policies that punish or even fire
employees for disclosing or inquiring about their own
Employers can use audits to monitor and address
wages or the wages of a co-worker. Such punitive
gender pay differences to great effect. For example,
pay-secrecy policies make it difficult for workers to
Minnesota requires public-sector employers to
remedy wage disparities because they cannot find out
conduct a pay-equity study every few years and
if they’re being paid less.
eliminate pay disparities between female-dominated
and male-dominated jobs requiring comparable In 2011, a national survey by the Institute for
levels of expertise (Minnesota Management and Women’s Policy Research (IWPR) found that about
Budget). Employers use a job-evaluation tool to half of employees said they worked in a setting
compare jobs on such dimensions as the complexity where managers either formally prohibited or
of issues encountered; the depth and breadth of discouraged discussions of wages and salaries
knowledge needed; the nature of interpersonal (Institute for Women’s Policy Research, 2011).
contacts required; and the physical working According to IWPR, pay secrecy was particularly
conditions. This allows employers to identify different common in the private sector, where 61 percent of
jobs—for example, delivery van drivers and clerk employees are either discouraged or prohibited from
typists—that require similar levels of knowledge discussing wage and salary information.
20 THE SIMPLE TRUTH ABOUT THE GENDER PAY GAP | Fall 2018 Edition AAUW • www.aauw.orgIn contrast, only 14 percent of public-sector Banning the Use of Prior Salary History
employees in the IWPR study reported that pay The practice of using past salaries to set current
discussions were either discouraged or prohibited. wages perpetuates the gender pay gap because it
This higher degree of transparency in the public sector assumes that prior salaries were fairly established
may be related to the greater gender pay equity found by previous employers. Relying on salary history
in the federal government. Federal workers can easily allows a new employer to continue underpaying a
see how their salaries compare with others at their woman who faced a pay gap and lost wages due to
grade level and geographical location. The U.S. Office bias or discrimination at a previous job. Salary history
of Personnel Management makes public the salary questions can also introduce bias and discrimination
and wage range for each level of federal worker and into the recruitment process of a company that may
additional locality pay for areas where the cost of be attempting to avoid it.
living is higher (U.S. Office of Personnel Management,
Employers should prohibit the use of salary history
2016). Among white-collar federal workers, women
and instead use market research to determine
were paid 87 percent of what men were paid in 2012,
what the position is worth to the organization. If a
compared with 77 percent in the workforce as a whole
woman starts her career with a pay gap tainted by
in 2012 (U.S. Office of Personnel Management, 2014).
prior discrimination, it’s likely to follow her from job
In recognition of this problem, President Obama to job. As discussed below, there are also state and
signed an executive order in 2014 banning federal efforts working to eliminate these practices,
retaliation for wage disclosure for federal but in the meantime, employers can take this
contracting employers, reaching approximately important action on their own.
26 million workers. Moreover, there are limited
protections under state laws and the federal
National Labor Relations Act, and the EEOC recently
issued guidance describing when employers’
retaliation for employees’ wage disclosure or
inquiries may violate Title VII of the Civil Rights Act
of 1964. However, these protections do not reach
all employees and circumstances.
Therefore, as we continue to fight for uniform
federal protections, as a best practice, AAUW
recommends that employers do not impose punitive
pay-secrecy policies in the workplace. They hurt
employees’ ability to share information to facilitate
equal opportunities in the workplace and impede
effective enforcement of pay discrimination laws. A
more open approach can foster the perception that
compensation is handled fairly and can improve
employee morale (Payscale, 2017).
AAUW • www.aauw.org THE SIMPLE TRUTH ABOUT THE GENDER PAY GAP | Fall 2018 Edition 21You can also read