U.S. Equity Review and Outlook - 1Q 2021 - Eagle Global Advisors
←
→
Page content transcription
If your browser does not render page correctly, please read the page content below
U.S. Equity
Review and Outlook
1Q 2021
1Q 2021 Eagle U.S. Review

   •   The S&P 500 Index increased an additional 6.2% in the first quarter bringing its 12 month
       return to 56.4%.

   •   Eagle portfolios generally kept pace with the S&P 500 Index during the first quarter and
       outperformed the index for the last 12 months.

   •   Sector allocation was slightly positive due to the overweight in Communication Services and
       an underweight in Consumer Staples and Health Care. Stock selection hampered
       performance due to poor selection in Information Technology and Financials. In the strong
       upmarket, cash was a drag.

   •   Equities rallied in March due to the longstanding narrative surrounding stimulus, vaccine
       developments and stabilizing interest rates and inflows.

   •   The rally was underpinned by a better-than-expected Q4 earnings season and continued
       confidence in a central bank backstop, a sign of economic resilience.

   •   Behaviors are starting to return to normal and the market recovery is ushering in the roaring
       2020s with signs of shortages in autos and semiconductor chips.

   •   Investors seemed to put much stock in the (FOMO), (TINA), (BTD) mantras fear-of-missing-
       out, there-is-no-alternative, buy-the-dip.

                                                    Source: S&P                                        2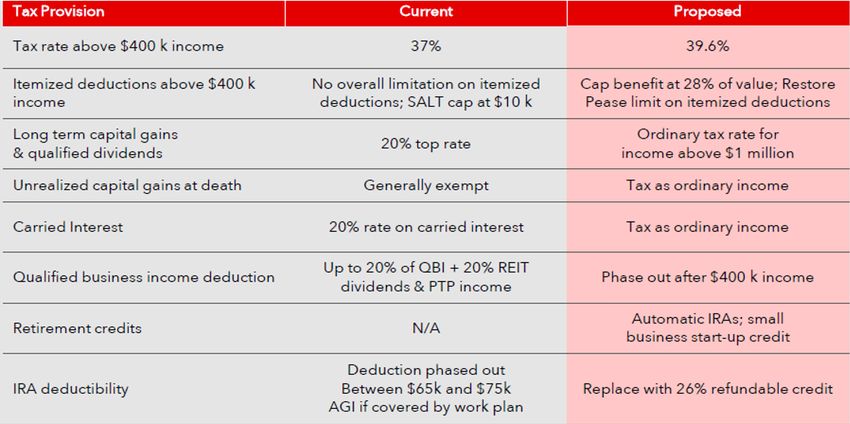
Global Scorecard

                                Broad Market Performance

                                                    1Q 2021

                                    S&P 500                                6.17%

                               MSCI AC World                         4.57%

                                  MSCI EAFE                        3.48%

                                   MSCI EM                    2.29%

     •   The S&P 500 led the global equity markets due to a stabilizing interest rates,
         stronger currency, and increased stimulus.

     •   Investors are looking to a strong recovery in 2021 and 2022 earnings. The forward
         12-month P/E ratio for the S&P 500 is 22.5. The P/E ratio is above the 5-year
         average (17.8) and above the 10-year average (15.9).

                                               Source: MSCI, S&P                             3
U.S. Market Scorecard

               Market Cap Breakdown                                            Growth vs. Value

                           1Q 2021                                                   1Q 2021

           S&P Small Cap                        18.24%
                                                                        S&P Value                  10.77%

            S&P Mid Cap                      13.47%

                                                                       S&P Growth          2.12%
           S&P Large Cap             5.12%

       •   Small Cap and Value led for the quarter.

       •   The Value rally has strengthened as the confidence in the cyclical recovery grows.

                                                         Source: S&P                                        4
U.S. Market Scorecard

                                        S&P Sector Performance

                                                            1Q 2021
                                              Energy                                     30.85%
                                           Financials                           15.99%
                                           Industrials                    11.41%
                                            Materials                    9.08%
                                          Real Estate                    9.02%
                              Communication Services                    8.08%
                                         Health Care              3.18%
                                   Cons Discretionary             3.11%
                                              Utilities           2.80%
                              Information Technology             1.97%
                                        Cons Staples            1.15%

     •   Most sectors increased during the quarter led by Energy, Financials, Industrials and
         Materials as cyclical sectors continued to rebound.

     •   Defensive Consumer Staples and former leader Information Technology lags for the
         quarter.

                                                          Source: S&P                             5
1Q 2021 Performance Attribution
Eagle Return Eagle Return S&P 500 Excess Return
Period
(Gross) (Net) Return (Gross)
Quarter 5.59% 5.34% 6.17% -0.58%
For the quarter ended 3/31/21
Attribute Impact Contributors Detractors
Communication Services - Information Technology
STOCK SELECTION Negative Health Care - Financials
Consumer Staples - Industrials
Underweight Health Care, - Overweight IT and Cash
SECTOR Consumer Staples - Underweight Energy and
Positive
ALLOCATION Overweight Financials, Materials
Communication Services
LARGE CAP
Negative Large Cap underperformed S&P 500 by 105 bps
BIAS
GROWTH
Negative Growth underperformed S&P 500 by 405 bps
BIAS
Source: Eagle Global Advisors 61Q 2021 Stock Review
OUTPERFORMERS
Amthem, Inc., Amgen Inc. - Health Care
Facebook, Inc., Alphabet Inc. - Communication Services
Caterpillar Inc., Trane Technologies Inc. - Industrials
JPMorgan Chase & Co., Truist Financial - Financials
UNDERPERFORMERS
Amazon - Consumer Discretionary
Intercontinental Exchanges, Inc.,
- Financials
Arthur J. Gallager
SBA Communications Corp. - Real Estate
Merck - Health Care
Apple Inc., Palo Alto, Salesforce - Information Technology
The securities listed above do not represent all of the securities purchased, sold, or recommended to clients. A complete list of each security that contributed to the performance of the
U.S. Equity Composite is available upon request. Please contact Eagle Global Advisors at 713-952-3550 for additional information. Past performance is no guarantee of future results.
7Changes Made In The 1st Quarter
New Purchases/Increases
Action Security Sector
Bought American Tower Corporation Real Estate
Bought Thermo Fisher Scientific Health Care
Bought Wells Fargo Financials
Increased American Express Financials
Full Sells/Trims
Action Security Sector
Sold Arthur J. Gallagher Financials
Sold CVS Health Corporation Health Care
Sold SBA Communications Corp. Real Estate
The securities listed above represent all of the securities purchased or increased during the quarter. This is not a recommendation to buy or sell any security. There can be
no assurance that the portfolio will continue to hold the same position in companies described herein, and the portfolio may change any portfolio position at any time.
81Q 2021 Purchases/Increases
American Express Co. (AXP): American Express is a leading issuer of personal, small business, and corporate credit cards. The
company will benefit from the reopening of the economy and the wide vaccine distribution as it should enable more Travel and
Entertainment (T&E), a key driver for its earnings growth. It also benefits from lower unemployment and a better economy
leading to an improving customer spend, higher balances and faster card spend as well as lower reserve build and/or reserves
release.
American Tower Corporation (AMT): The sale of SBA Communications was motivated by tax loss harvesting. We monetized the
loss in SBAC and put the proceeds into AMT, which is another tower company.
Thermo Fisher Scientific (TMO): Thermo Fisher Scientific, Inc. engages in the provision of analytical instruments, equipment,
reagents and consumables, software and services for research, analysis, discovery, and diagnostics. The modest guidance for
2021 and market related “sell the winners” put pressure on the stock allowing us to buy at an attractive entry price. Share
repurchases in January and March signal underlying value for long-term holders. By redirecting coronavirus-related cash flow
windfall toward M&A, TMO is likely to emerge stronger post pandemic.
Wells Fargo (WFC): Wells Fargo & Co. is the third largest U.S. bank by deposits with significant market share in commercial
banking, mortgage banking, and retail brokerage. It is a turnaround story with upside potential on the costs savings program as
well as capital deployment given the excess capital on the balance sheet. We believe the efficiency ratio could decrease from
77% (2021) to around 60% over next 5 years. The bank is asset sensitive and benefits from the improving outlook for rates. Its
strong balance sheet with good asset quality should lift net income through reserve release. Also, we are seeing steady
improvement on the regulatory front even though there is no clarity on the timing of the removal of the asset cap and consent
order. Valuation is attractive at 0.8x P/B.
9Q1 2021 Sells/Trims
Arthur J. Gallagher (AJG): We believe AJG’s stock is fairly valued at current expectations. The current valuation is near historical
highs and above the levels of peers. The high valuation is pricing in strong execution during the pandemic, robust margin
expansion and a resilient organic growth trend.
CVS Health Corp (CVS): The recent outperformance of CVS provided Eagle an attractive exit price helping reduce our
overweight in health care providers and service companies also called MCOs. We are maintaining our investments in UNH and
ANTM, which are competitors to Aetna, the MCO “Managed Care Organization” division of CVS. The proceeds were invested in
TMO, a leading Life Science Tools & Service Health Care Company.
SBA Communications Corp (SBAC): The sale of SBA Communications was motivated by tax loss harvesting. We monetized
the loss in SBAC and put the proceeds into AMT, which is another tower company.
10Sector Analysis
11Eagle Outlook For 2021
• Eagle believes earnings for 1Q 2021 will be in the 30% range, well above the 5-year average of 4.1%.
• Eagle believes earnings growth will be in the range of 28% and revenue growth above 10% for
2021 and fully recover by 2022 exceeding $200 on the S&P 500.
• GDP growth will strongly rebound in 2021 and interest rates will trend higher.
• Fears of a Covid-19 resurgence is largely negated by vaccine optimism.
• Massive government fiscal and Federal Reserve monetary responses have supported the rebound.
• Improving economics and earnings battle with Covid-19, interest rates spike, and China hegemony
leading to increased volatility.
• Estate tax rollbacks, income tax increases, corporate tax increases and wealthy investor tax increase
may weigh on fourth quarter market sentiment as tax law changes move forward.
• Studies from the CSFB forecast show an average decline of 7.0% in S&P 500 earnings if Democrats
increase corporate tax rates to 28.0% from current 21.0% and change corporate tax rules.
• Capital Gains and Dividend tax rates over $1m could rise to 39.6% under Biden/Democrats
potentially increasing investors equity and bond discount rates currently near all time lows.
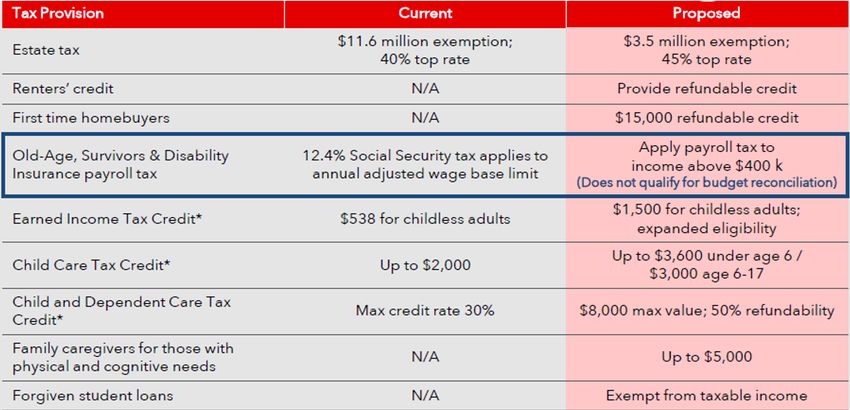
12Proposed Individual Tax Changes
Source: MUFG. (1) Tax Policy Center “TPC Finds the Ways & Means Pandemic Relief Plan Mostly Helps Low and Moderate Income Households, But Higher
Income Families Benefit as Well”. Howard Gleckman. Tax Policy Center “An Unpaid Analysis of Former Vice President Biden’s Tax Proposals”. Tax Foundation
“Details and Analysis of President-elect Joe Biden’s Tax Proposals, October 2020 Update. PWC “2021 Tax Policy Outlook: The Changing Horizon” January 2021.
13Proposed Individual Tax Changes
Source: MUFG (1) Tax Policy Center “TPC Finds the Ways & Means Pandemic Relief Plan Mostly Helps Low and Moderate Income Households, But Higher
Income Families Benefit as Well”. Howard Gleckman. Tax Policy Center “An Unpaid Analysis of Former Vice President Biden’s Tax Proposals”. Tax Foundation
“Details and Analysis of President-elect Joe Biden’s Tax Proposals, October 2020 Update. PWC “2021 Tax Policy Outlook: The Changing Horizon” January 2021.
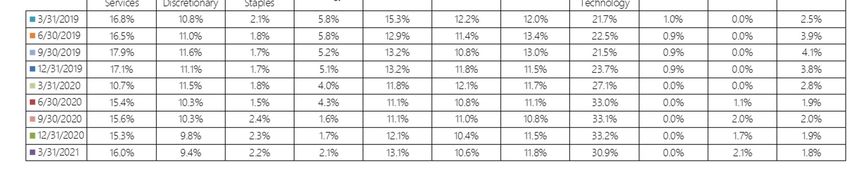
14Sector Allocation
As of 3/31/2021
Sector Over / Under Weight vs. S&P 500
Sector Eagle S&P 500
Communication Services 5.1%
Communication Services 16.0% 10.9% Information Technology 4.3%
Information Technology 30.9% 26.6% Industrials 2.9%
Industrials 11.8% 8.9% Financials 1.8%
Financials 13.1% 11.3%
Real Estate -0.4%
Real Estate 2.1% 2.5% Energy -0.7%
Energy 2.1% 2.8%
Utilities -0.9%
Utilities 1.8% 2.7%
Health Care -2.4%
Health Care 10.6% 13.0%
Materials -2.7%
Materials 0.0% 2.7%
Consumer Discretionary -3.0%
Consumer Discretionary 9.4% 12.4%
Consumer Staples -3.9%
Consumer Staples 2.2% 6.1%
-8% -6% -4% -2% 0% 2% 4% 6% 8%
Source: S&P 15Holdings and Characteristics
As of 3/31/2021
C h ar acter istic Eagle S&P 500 Top 10 H oldin gs Sector
Weighted Average Market Cap $569 Billion $413 Billion 1 Apple Inc. Information Technology
Weighted Median Market Cap $270 Billion $159 Billion 2 Facebook, Inc. Class A Communication Services
12M Trailing Price/Cash Flow 21.44 20.40
3 Microsoft Corporation Information Technology
12M Trailing P/E 36.78 32.60
4 Amazon.com, Inc. Consumer Discretionary
12M Fwd P/E 22.81 21.63
5 Alphabet Inc. Class A Communication Services
Yield 1.3% 1.5%
6 Invesco QQQ Trust Information Technology
P/B 4.82 4.44
7 JPMorgan Chase & Co. Financials
Return on Equity (ROE) 14.5% 13.0%
8 Alphabet Inc. Class C Communication Services
12M FWD EPS Growth 21.94% 20.80%
Earnings Growth Next 5 Years 17.10% 15.40% 9 Truist Financial Corporation Financials
Number of Holdings 46 500 10 Honeywell International Inc. Industrials
Turnover Rate 25%-30% NA
EGA’s top ten holdings represent our 10 largest holdings as of March 31, 2021. This is not a recommendation to buy or sell any security.
There can be no assurance that the portfolio will continue to hold the same position in companies described herein, and the portfolio may change any portfolio position at any time.
Source: S&P 16U.S. Equity Composite
Y ear Q1 Q2 Q3 Q4 Y TD S&P 500
Gross Net Gross Net Gross Net Gross Net Gross Net
1997 2.43% 2.18% 19.99% 19.74% 6.93% 6.68% 5.41% 5.16% 38.53% 37.26% 33.36%
1998 15.35% 15.10% 6.56% 6.31% -8.77% -9.02% 23.62% 23.37% 38.62% 37.34% 28.57%
1999 4.92% 4.67% 4.84% 4.59% -3.82% -4.07% 18.51% 18.26% 25.38% 24.20% 21.03%
2000 4.05% 3.80% -3.13% -3.38% -3.33% -3.58% -9.36% -9.61% -11.68% -12.59% -9.15%
2001 -12.10% -12.35% 5.89% 5.64% -11.51% -11.76% 9.12% 8.87% -10.12% -11.05% -11.91%
2002 -0.53% -0.78% -12.02% -12.27% -14.03% -14.28% 7.22% 6.97% -19.33% -20.18% -22.15%
2003 -1.50% -1.75% 13.30% 13.05% 1.43% 1.18% 9.74% 9.49% 24.22% 23.05% 28.62%
2004 1.71% 1.46% 1.46% 1.21% -2.84% -3.09% 9.03% 8.78% 9.32% 8.25% 10.92%
2005 0.67% 0.42% 2.80% 2.55% 6.49% 6.24% -1.08% -1.33% 9.01% 7.95% 4.88%
2006 5.65% 5.40% -0.01% -0.26% 1.45% 1.20% 6.79% 6.54% 14.45% 13.35% 15.79%
2007 0.60% 0.35% 7.23% 6.98% 4.01% 3.76% -0.73% -0.98% 11.38% 10.30% 5.50%
2008 -8.18% -8.42% -0.59% -0.83% -10.43% -10.66% -20.39% -20.60% -34.91% -35.57% -37.00%
2009 -7.36% -7.58% 8.29% 8.04% 16.36% 16.09% 5.38% 5.12% 23.01% 21.85% 26.46%
2010 5.29% 5.04% -12.59% -12.81% 11.39% 11.12% 11.38% 11.13% 14.32% 13.09% 15.06%
2011 6.21% 5.97% -0.48% -0.17% -15.07% -15.28% 12.49% 12.23% 1.00% 0.03% 2.11%
2012 11.61% 11.35% -3.03% -3.27% 7.35% 7.10% -2.31% -2.55% 13.49% 12.42% 16.00%
2013 9.74% 9.49% 3.52% 3.28% 5.25% 5.00% 10.00% 9.74% 31.53% 30.30% 32.39%
2014 1.50% 1.26% 6.47% 6.22% 2.37% 2.12% 5.78% 5.53% 17.02% 15.92% 13.69%
2015 2.25% 2.00% 1.52% 1.28% -8.29% -8.52% 5.04% 4.79% -0.01% -0.96% 1.38%
2016 -0.82% -1.06% 1.15% 0.91% 5.16% 4.91% 6.03% 5.78% 11.86% 10.80% 11.96%
2017 5.77% 5.52% 2.84% 2.59% 5.15% 4.90% 5.37% 5.12% 20.51% 19.37% 21.83%
2018 -0.42% -0.66% 4.22% 3.97% 4.98% 4.73% -13.89% -14.10% -6.21% -7.11% -4.38%
2019 11.92% 11.67% 5.89% 5.64% 0.83% 0.59% 9.55% 9.30% 30.92% 29.70% 31.49%
2020 -18.97% -19.18% 22.63% 22.35% 10.20% 9.94% 12.38% 12.12% 23.05% 21.89% 18.40%
2021 5.59%* 5.34%* 5.59%* 5.34%* 6.17%
*Preliminary
Annualized Returns
MRQ* YTD* 1 Year* 3 Years* 5 Years* 10 Years*
E GA U S Eq uit y (% g ro s s ) 5. 6 5. 6 60. 4 17. 0 16. 7 13. 6
E GA U S Eq uit y (% net ) 5. 3 5. 3 58. 9 15. 9 15. 6 12. 5
S&P 500 6.2 6.2 56.4 16.8 16.3 13.9
*Preliminary
See p.19 for additional performance calculation information and GIPS performance disclosures.
17U.S. Equity Composite
EGA U.S. Equity Composite
January 1, 2010 through December 31, 2020
See p.19 for additional performance calculation information and GIPS performance disclosures.
18Composite Disclosures EGA US Equity Composite - The EGA US Equity Composite consists of those equity-only portfolios invested in US large capitalization growth equities. The Eagle equity investment philosophy focuses on identifying the securities of large capitalization companies with improving growth potential that are not fully recognized by current valuations. • For GIPS purposes, Eagle Global Advisors, LLC is an independent investment advisor, registered with the SEC, actively managing individual investment portfolios containing domestic equity, international equity, master limited partnerships, and domestic fixed income securities, (either directly or through a sub-advisory relationship), for mutual funds, high net worth individuals, retirement plans for corporations and unions, financial institutions, trusts, endowments and foundations. SEC registration does not imply a certain level of skill or training. • Eagle Global Advisors, LLC claims compliance with Global Investment Performance Standards (GIPS®) and has prepared and presented this report in compliance with GIPS standards. Eagle Global Advisors, LLC has been independently verified for the periods 1/1/1997 to 12/31/2019. The verification reports are available upon request. A firm that claims compliance with the GIPS standards must establish policies and procedures for complying with all the applicable requirements of the GIPS standards. Verification provides assurance on whether the firm’s policies and procedures related to composite and pooled fund maintenance, as well as the calculation, presentation, and distribution of performance, have been designed in compliance with the GIPS standards and have been implemented on a firm-wide basis. Verification does not provide assurance on the accuracy of any specific performance report. GIPS® is a registered trademark of CFA Institute. CFA Institute does not endorse or promote this organization, nor does it warrant the accuracy or quality of the content contained herein. Only direct trading expenses are deducted when presenting gross of fee returns. In addition to management fees, actual client returns will be reduced by any other expenses related to the management of an account such as trustee fees or custodian fees. The reporting currency is the U.S. dollar. Returns are calculated net of non-reclaimable foreign withholding taxes on dividends, interest, and capital gains. Reclaimable withholding taxes are not accrued, but are cash basis as received. Eagle uses the asset-weighted standard deviation as the measure of composite dispersion of the individual component portfolio gross full period returns around the aggregate composite mean gross return. The 3 year annual standard deviation and internal dispersion are calculated using Gross of Fees returns. If the composite contains 5 portfolios or less (
You can also read