UNICEF Presentation to Executive Board - Informal Session on Management Efficiencies
←
→
Page content transcription
If your browser does not render page correctly, please read the page content below

UNICEF Presentation
to Executive Board
Informal Session on
Management Efficiencies
4 April 2018

                          © UNICEF/UNI197921/Schermbrucker
Commitment to Efficiency - 10 Year Trend
6,500 6,281
UNICEF has 6,080
5,906
demonstrated efficiency 6,000 5,703
by progressively 5,500 5,150
5,316 5,242
5,645
controlling the growth of 4,913 5,463
5,000 5,295
Institutional Expenditure, 5,113
4,500 4,246 4,832
delivering more in 4,016 4,681 4,711
3,896 4,471
programme expenditure 4,000
while keeping 3,500 3,795
management costs in 3,472 3,433 Total expenditure
3,000
control.
2,500
Programme assistance
2,000
2021 Programme Institutional IB
assistance; growth since 1,500
2012: 59% 1,000 636
544 531 590 611 617
462 451 441 469 484
500
2021 Institutional Budget;
growth since 2012: 34% -
2011 2012 2013 2014 2015 2016 2017 2018 2019 2020 2021
Efficiency Commitments for 2018 – 2021
1. Management costs as a proportion of Total Integrated Budget (IB) are projected to decline
   from 7.2% (2014-2017 MTR of IB) to 6.7% (2018-2021 Approved IB).
2. Management costs as a proportion of total Institutional Budgeted are projected to decline
   from 69% to 65%.
3. Management costs are anticipated to increase at a slower rate of 12% over the course of
   the 2018-2021 quadrennium, compared to an anticipated 19% increase in programme
   expenditures.
4. A greater proportion of management costs will be funded by Cost Recovery, increasing
   from 63% to 71%, freeing up Regular Resources for programmes.
5. A lower proportion of management costs will be funded by Regular Resources, declining
   from 37% to 29%, thereby freeing up funds to support programmes and other non-
   management related costs.

  3

Examples of how commitments will be
achieved:
1. Travel costs unrelated to direct programme implementation for the period of 2018-2021
   will be subject to a 15% reduction
2. Centrally processing of UNICEF financial and administrative transactions through the
   Global Shared Services Centre will generate projected savings of $25M
3. UNICEF country offices worldwide will increase collaborating with other UN agencies on
   the ground to deliver local business solutions in IT, procurement, and cash transfers to
   implementing partners allowing the organization to save about $4M annually.
4. Simplification and modernization of UNICEF operational processes are growing with
   estimated savings of $20M
5. Minimized fraud risk and strengthened follow-up to substantiated investigations of fraud
   through an enhanced Anti-Fraud Strategy

  4
Overview of the UNICEF Anti-Fraud Strategy
• An anti-fraud strategy for implementing partners is a key component
Prevention Detection Response
Committee Oversight
Executive and Line Management Functions
Internal Audit and Investigations, & the Ethics Office
Anti-Fraud Policy Hotlines and whistle-blower Internal investigation and
Anti-Fraud Strategy mechanisms remediation protocols
Fraud and misconduct risk Internal assurance and Enforcement and accountability
assessment monitoring protocols
Standards of conduct: Anti-fraud strategy for Disclosure protocols
[Harassment-Sexual, Bullying, implementing partners
Coercion, etc.] Data & analytics
Employee and third-party due
diligence
Communication and training
Process-specific anti-fraud controls
5
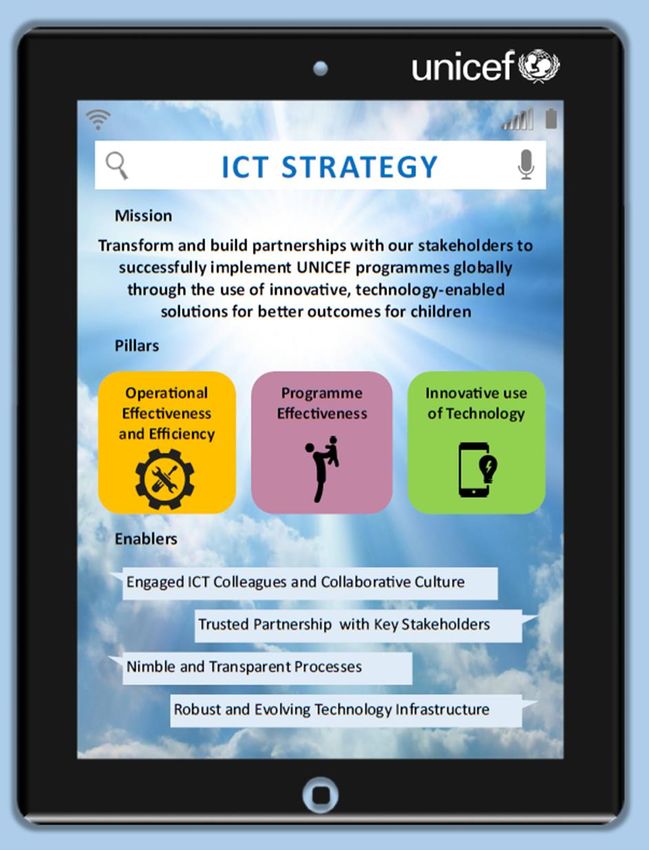
Fraud Investigations in 2017
• 74 new                                        Investigation Types in 2017
  investigations open
  in 2017                                     Conflicts of interest

                                  Bribery, corruption or kickbacks
• Largest category of
  which related to        Sexual harassment & sexual exploitation
  misuse of
  programme funds                     Inappropriate staff conduct
  by third parties with
                                               Fraud and forgery
  27% (20 out of 74
  cases)                    Fraud involving misuse of programme
                                    funds by third parties

                                                                      0   5   10   15   20   25
 6
Anti-Fraud Strategy for Implementing Partners
Prevention
Enhanced training for those dealing with IPs on what to look for and how to manage risk
Increased due diligence and Accountability
Anti-fraud clauses in all IP contracts; Competitive and transparent IP Partner selection
process
Detection
In addition to HACT, increased independent spot checks, QA, site visits and monitoring by
the COs and ROs (training and guidance on what to look for); Hotline displayed at
programme sites
Transaction Level Monitoring
Response
Global fraud loss and remedial action plan for instances of fraud by the IP
Consequences of negative spot checks (UNICEF must stop working with the IP until they
have taken remedial action)
Regular reporting to regional and global offices
Formal roll-out of Strategy
7 and supporting tools planned for Q2 2018
Revenue recognition policy change
• UNICEF revised its Revenue Recognition Policy in 2017, to address recommendation of the UN Board of Auditors that
  UNICEF’s policy lacked “clarity and consistency”
• The new policy adopts a simplified approach requiring less judgment to be exercised and making it easier to
  understand by internal and external users of UNICEF’s financial information
• UNICEF now recognizes revenue based on full contract value at the signing
  of a Donor Agreement, regardless of its duration and whether it is earmarked

• The accumulated surpluses (reserves) UNICEF holds now represent the
  funding secured for activities taking place in the future
                                                                                                 Not affected:
• For planning purposes, UNICEF will prepare estimates of the funding that will be available     - Budget issuance
                                                                                                 - Budget Utilization
  for spending on an annual basis. These estimates could include funding from multi-year         - Donor Reporting
  agreements signed in previous years where the programmatic activities are not yet complete.

4
Management Efficiencies
    in Human Resources

                     © UNICEF/NYHQ2011-0098/NOORANI
9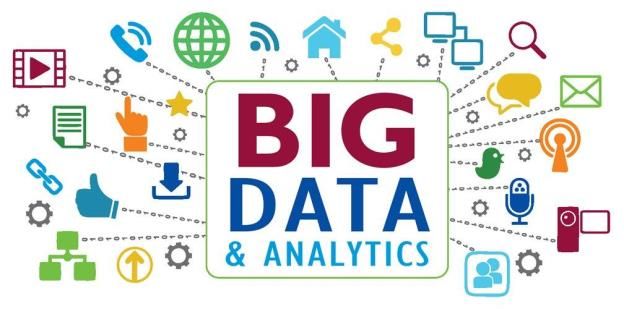
Global Staff Count – by staff category
      As of 28 February 2018   ▪ Since the end of 2016, there has been a net 5% increase
                                 in the total number of UNICEF staff, with the majority being
                                 IP (+231) and NO (+343) staff.
                               ▪ The number of GS staff increased more slowly, adding only
                                 a net of 70 staff members in the same period.
                                      Staff Turn Over
                                            Rate           Regular     Temporary
                                            2016             8%          18%
                                            2017             7%          15%

      As of 31 December 2017                 As of 31 December 2016

 10
All Staff – Overall Gender Diversity
As of 28 February 2018
▪ The overall Gender Parity has
remained constant at 47% for Female
and 53% for Male since 2016.
▪ Despite this ratio, the female
population has increased by 5%,
while the male population increased
by 4% between 2016 and February
2018.
As of 31 December 2017 As of 31 December 2016
11IP Staff – Geographical Diversity
As of 28 February 2018
▪ The number of IP staff from
Programme Countries increased by
8% from 2016 to Feb 2018, while
there was only a 4% increase in the
number of staff from Industrial
Countries.
As of end of December 2017 As of end of December 2016
12Efficiencies in HR
▪ Recruitment
✓ Delegated authority to RDs/Directors for most positions bringing to
94% of the workforce under their direct accountabilities and oversight.
✓ Sourcing of candidates from Talent Groups or through Lateral
Reassignment
✓ Talent Management System (TMS) launched in 2016 to modernize
and simplify online recruitment system
13All IP regular and emergency recruitment
(except SSR and mobility)
Average Time to Recruit (Days) Average Time to Recruit (Days)
– Regular Recruitment – Emergency Recruitments
KPI: 90 days KPI: 60 days
80 57
Feb-18 79 60 51 50
Jul - Dec 2017 78 40
Jan - Jun 2017 91 20
2016 81 0
Feb-18 As of December As of December
0 20 40 60 80 100 2017 2016
▪ Decentralization of the recruitment processes to the Regional Offices and HQs Divisions for P-1 to P-4 posts was crucial to gain efficiency.
During the first semester 2017 (January-June), there was an increase in the average time to recruit (+10 days), which was expected during
the transition period when offices needed to adjust to the new ways of recruitment.
▪ During the period of July – December 2017, there was globally an improvement in the average time to recruit (with 13 days reduced) once
the new policy was fully implemented.
▪ During the second half of 2017, major improvement was achieved in the P-5 recruitment cases (with 16 days reduced), while recruitment of
P-1 to P-4 levels also gained efficiency with reduction by 4 days in the average time to recruit.
▪ In the emergency recruitment, the average time to recruit slightly improved from 57 days in 2016 to 51 days as of February 2018 as
compared to the KPI.
14Use of Different Recruitment Methods
(All Regular IP recruitment, excluding SSR and Mobility)
▪ The use of Direct Selection and Lateral Reassignments is well
supported by stakeholders. HRBPs should continue to promote
the use of these methods.
▪ Simplified and streamlined recruitment processes should
continue to be implemented for efficiency.
15Efficiencies in HR
▪ New HR operating model
✓ Roll out in HR Business Partner function as strategic partners and “one
stop shops” for all divisions. The HRBPs formulate partnerships across
the HR function(GSSC, COEs) to deliver value-added service to
management and employees that reflects the strategic directions of
the organization. They support all staff through the employee life cycle.
✓ GSSC: efficient processing of HR services from onboarding to offboarding
✓ Centres of Expertise-COEs: designing and make available customized
frameworks and services to HRBPs in support of business needs
16 16HR Operating Model
New HR operating model to offer strategic support through the “one stop shop
approach” in strong partnership with GSSC and the COEs
HR Business Partners GSSC: Shared Services Centres of Expertise - COEs
• Establish relations with • Deliver HR Services
business clients: Divisions • Create/ design HR
• Manage routine processes frameworks
• Contribute to Division's effectively and efficiently
strategic plans • Develop and introduce
• Uses integrated HRIS to strategic HR initiatives
• Develop organizational provide basic information
capabilities • Often depend on the HRBP
• Support the objectives of to roll out programs to the
• Implement HR practices getting the basics on HR business
operations right
• Represent central HR
• Log HR issues and coordinate
with GSSC, COE, etc.
• Full membership to the front
office of business units
17 17Management Efficiencies
in ICT
© UNICEF/NYHQ2011-0098/NOORANI
18
18Ongoing factors guiding ICT-enabled change
UN/HLCM/HLCP
Cyber Security
UN Interagency Reform
Data Innovation Labs
Tech- Priority Integrated Partnerships
19 19Systems of Systems of
Record Innovation
20 20
Management Efficiencies – UNICEF | for every childStrategic Priorities ICT
Efficiency And Effectiveness Programme Effectiveness Innovate use of technology
Systems of Record Systems of differentiation Systems of Innovation
Engagement
VISIO
N
Budget
21 21OMP 2018-2021 Key Strategic Shifts - Enablers ▪ Increase portion of ICT investments in information systems supporting programme effectiveness vs internal efficiency and effectiveness ▪ Resilient and mobile connectivity and access to UNICEF Resources by Staff ▪ Creation of Knowledge Sharing Platform through completion of the ECM project and internal Digital Workplace ▪ Creation of a platform for UNICEF Supporters 22
ICT 2018-2021 KPIs in UNICEF Strategic Plan
▪ Enablers
   – Through strengthened ICT governance, ICT investments are considered with a strong focus on value for money
   – Strengthen internal and external collaboration through integrated ICT platforms in one single framework
   – Global presence safeguarded through resilient facilities and systems, and a standard operating environment and
     connectivity

▪ Indicators
             % of information systems supporting programme effectiveness and innovation efficiency           50%
    25%      and effectiveness

             % of staff having full access to all relevant core UNICEF information systems and are mobile
    83%      enabled                                                                                         100%

    0.6        External engagement index                                                                     1.0

    0.6      Internal knowledge platform utility index                                                       1.0

               % average availability of core ICT systems and services across UNICEF (less than 5 hours of
    99.9%                                                                                                    99.9%
               downtime/month)
   23
Platforms and Service Delivery
Network and
Converged
LIGHT Connectivity Move to Cloud
Communications
Management
Seamless Adequate Better
Seamless
connectivity bandwidth video integration
conferencing
Security
Reduced costs Mobility
operations
Seamless
audio Faster
Disaster Value
conferencing application
recovery agility demonstration
deployment
2425
Management Efficiencies
through the GSSC
© UNICEF/NYHQ2011-0098/NOORANI
25Effectiveness & Efficiency Initiative - 2012
HQ
HQ Functions
Functions Transaction
Review Efficiency Global
Review
Shared
Effectiveness & Efficiency
Services
Centre
Business Process
Simplification
26 26Drivers of Change - GSSC
Reduce transaction processing costs
Free up time of programme assistants and operations staff
to deliver even more value
Reduce Organizational risk to avoid costs due
to fraud and human error
Improve quality
27Original GSSC Scope
Finance & HR Admin & Customer
Master Data Payroll Care
Management
• On-boarding • IT user/systems
• Invoice processing
• Personnel maintenance administration services
• Payment processing
• Off-boarding • Business user support
• Bank reconciliation
• Payroll (All staff)
• General ledger clearing
• Selected asset
accounting
• MDM for vendors,
customers & banks
28Cost Savings 29 29
GSSC Business Case – Cost Savings from
Consolidation
      Step 1:                           • Baseline transaction processing time with country offices
      Determine benchmark data for
      FTE analysis to calculate As-is   • Minutes x Volume = full-time equivalent (FTE)
      global transactional costs
                                        • “As-is” Global Transaction Cost = Total FTEs X FTE Cost by country

      Step 2:                            • One-Time project implementation Cost +
      Calculate implementation
                                         • Annual running costs of Centre for selected location
      and annual costs

                                         • As-is” FTE Cost –“To-be” FTE Cost = Transactional cost savings
      Step 3:
      Complete overall cost-benefit      • Savings achieved through labour arbitrage and efficiency gains
      analysis

 30
Cost savings methodology
Before the GSSC, over 40% of the UNICEF workforce
performed operational transaction – significantly higher
than the 15% industry median.
Lift & Shift of
Functions from
30%
Functions were centralized at the GSSC: Consolidation of
high-cost to low- fewer staff
Functions from 150 cost location processing due
✓ Invoice processing offices worldwide to economies of
✓ Payment processing scale
✓ Bank reconciliation
✓ General ledger clearing
✓ Selected asset accounting
✓ MDM for vendors, customers & banks
Shift of functions from high-cost to low-cost
location:
✓ On-boarding
✓ Personnel maintenance
✓ Off-boarding
✓ Payroll (All staff)
✓ Customer Care
31Savings Calculation 2017
(First Full Year Of Operations)
• Transaction volumes were
approximately 12.65% higher
than the original business case $41 M $15.9 M $25 M
Global transaction GSSC Estimated cost
volumes.
processing costs Operating Costs savings
• Based increased volumes, the
GSSC saved offices the
equivalent of 866,140 hours in
transaction processing time each
year.
• The shift of UNICEF’s
Contributions Unit from NY to
GSSC in April 2018 will generate
additional estimated savings of
$590,000.
32GSSC Drives Efficiency – Against Industry
Benchmarks
Functions Measure Top Quartile Bottom Quartile GSSC
# AP Invoices per FTE/Day
Invoice Processing 41 19 30
# AP Disbursements per
Payment Processing FTE/Day 29 9 40
# FTEs per 1,000 Employees
Payroll - Manage Pay 0.7 2 0.8
HR - Manage Employee # Employees per FTE
432 189 380
Information
% Calls Resolved at 1st & 2nd
Customer Care Levels 72%
78%
33More efficient GSSC generates additional
savings
Generating more efficiency at the
GSSC allows us to take on more
functions and save UNICEF more
time and costs. $2.5 million
Simplify processes in HR,
Payroll & Customer Care,
Medical
$3.5 million
additional savings from
50,000 transaction costs and
additional hours increased productivity
saved by offices
$400,000
E- banking & move
additional processes from
country offices in Finance,
HR, Payroll
34Additional Savings with Business Operations
Strategy (BOS)
BOS is the UNDG multi-agency framework guiding UN operations collaboration at the
country level.
• Savings achieved through UNICEF
BOS KPI 2017 2018 2019 2020 2021
collaboration with other agencies at
country level
a. % of Country
• Designed to facilitate UN Country Offices
Teams (UNCT’s) joint programme implementing
Business 25% 40% 50% 60% 65%
delivery through common business
Operations
operations supporting the delivery of Strategies
the UNDAF.
• BOS is on the SG agenda (100% b. Annual cost
implementation by 2021). avoidance ($US)
$3 million $5 million $6 million $7 million $8 million
• UNICEF has adopted a BOS KPI in
its Strategic plan.
35BOS – UNICEF Strategy
• UNICEF developed corporate-wide strategy and approach
• Strengthened internal governance for BOS with full corporate support
• Strengthen data collection and analytics to maximize cost savings potential
• Use of the cost benefit tool accepted by other agencies for robust business case analysis of cost savings
• Strengthen knowledge management and capacity development through dedicated BOS site and
community site.
• Further analysis of data can provide more opportunities (vertical integration, simplification, common back
office, etc.)
3637
Reduce Organizational RiskCost avoidance – Reduce Risk of Fraud &
Human Error
TRANSACTIONAL DETECTIVE DETECTIVE STRENGTHENED
LEVEL REPORTING - REPORTING – INTERNAL
MONITORING TRANSACTIONAL DATA ANALYTICS COMPLIANCE
• Segregation of duties check • Payments checked where • High volume low value • Strengthened QA
• High values to permitted payees automated payments installed transactions with same function
• Late or exceptional invoices • Exception reporting of abnormal vendor • Automated Bank
• Review of updated bank accounts transactions • Identify misuse of FI Interfaces for payments
• Identify reactivation of dormant documents, FC, petty cash, and bank reconciliation
vendors etc. reduces fraud risk
3839
Improve QualityImprove Quality & Transparency
Improve Quality of Service Improve Data Quality
• Improve Customer Service to staff and country offices • Improved Financial Reporting
• Dedicated QA functions to ensure processes are completed o More accurate GL account coding
consistently and within agreed Service Level Agreement • Improved Master Data
• Provide faster response times and more accelerated for o Completeness, Accuracy and Validity of Data records
Emergency Countries • Improved Payment Transactions
• Adoption of a regionalized approach to functional teams o Reducing rejected payment from Banks (0.05%)
within the GSSC to better leverage time zones, language, • Improved Financial Controls
culture and office specificities to improve service quality o All transactions have supporting documents loaded
• Real-time performance monitoring allows the Centre to
identify quality issues early and take corrective measures
40Looking Forward 41
Next Steps

        Further Reduce                              Strengthen                             Improve GSSC
    Transaction Processing                          Analytical                               Efficiency
       Time & Costs for                             Reporting
          Countries
• Aim to accelerate GSSC related         • Strengthen data analytics to identify   • Measure GSSC productivity against industry
  processes by 10%                         best opportunities to save money          benchmarks and drive efficiency through
• Benchmark processes in Country         • Simplify policies and processes           strong performance management
  Offices                                • Identify additional functions for       • Automate processes using latest technology
• Recommend best practice approaches       vertical or horizontal integration to   • Allows GSSC to take on more with existing
• Drive change into offices through        achieve savings                           resources and save costs for UNICEF
  communications and capacity building

  42
Thank You 43 © UNICEF/SUDA2014-XX228/Noorani
You can also read