UNITED NATIONS ECONOMIC COMMISSION FOR LATIN AMERICA AND THE CARIBBEAN - ECLAC
←
→
Page content transcription
If your browser does not render page correctly, please read the page content below
UNITED NATIONS                                         Distr.
                                                       LIMITED
ECONOMIC COMMISSION
FOR LATIN AMERICA                                      LC/MEX/L.426
AND THE CARIBBEAN -                                    29 February 2000
ECLAC
                                                       ORIGINAL: ENGLISH

    THE FISCAL IMPACT OF TRADE LIBERALIZATION AND COMMODITY
                        PRICE FLUCTUATION

                The case o f Dominican Republic, 1980-1998

00-2-8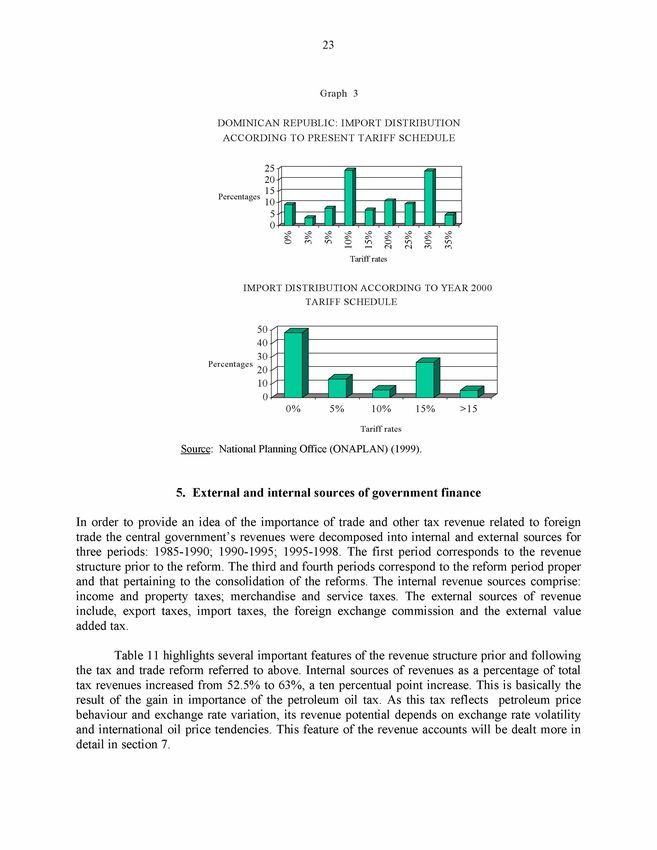
iii

                                                                    CONTENTS

                                                                                                                                                        Page

SU M M A R Y ...............................................................................................................................              1

       1.    Introduction.................................................................................................................               3

      2.     The 1970’s: the prelude to economic re fo rm ......................................................                                         4

      3.     M acroeconom ic overview: 1980-1998 .................................................................                                       6

      4.     Commercial regime; tariff and fiscal reform s.......................................................                                       12

      5.     External and internal sources o f government finance.........................................                                              23

      6.     Fiscal sustainability and tariff reduction scenarios..............................................                                         28

      7.     The fiscal im pact o f commodity price variations................................................                                          31

      8.     Conclusion...................................................................................................................              33

REFERENCES .........................................................................................................................                    35

Appendix              ...............................................................................................................................   39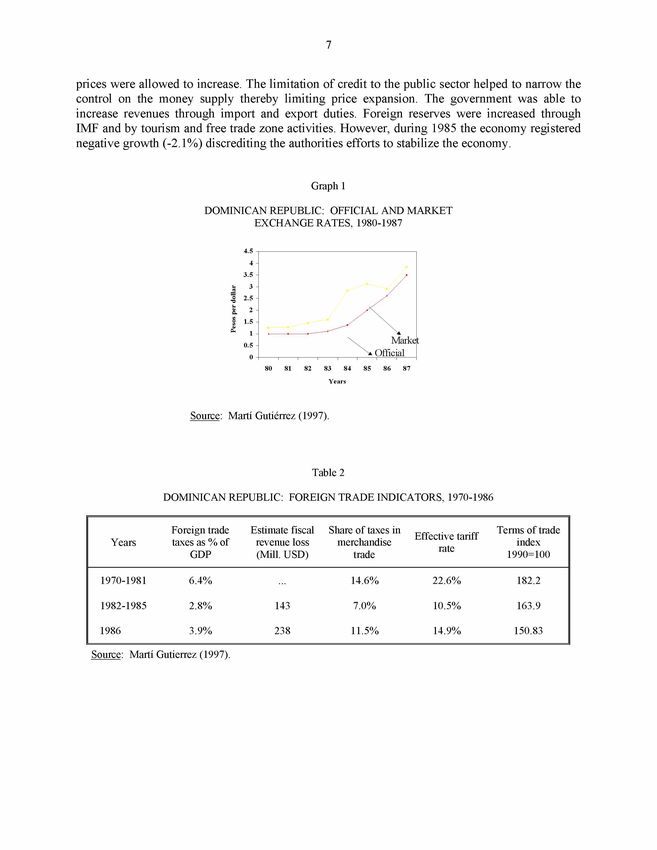
SUM M ARY

D uring the 1980’s, the D om inican Republic made attempts at macroeconom ic reform that saw
little success. A decade later a stabilization and structural reform package was implemented. This
package included, among other aspects, inflation control through monetary restraint and a tax and
tariff reform w hich sought to increase the efficiency of the prevailing tax structure and eliminate
its relative price distortion while maintaining fiscal equilibrium. Price stabilization was achieved,
nominal im port tariff rates w ere reduced and the economy started on a grow th trajectory that has
lasted into the present.

         The tariff and tax reforms saw light in September 1990 and June 1992, respectively. The
tariff reform sought to simplify the existing tariff structure and reduce the tariff dispersion as well
as the average effective rate of protection. Accordingly, the tariff interval was initially reduced
from 0%-200% to 5%-35% and then to 0%-35%. The tariff rates w hich w ere seven in num ber at
the beginning of the reform increased to nine by 1997. The average tariff rate was estimated at
17.3% in 1997.

         The tariff reform was also accompanied by the elimination of m ost im port prohibitions,
licenses and exem ptions increasing thus the im port tax base as well as the virtual elimination of
export taxes. The elimination of export taxes coupled with the recent reforms regarding the oil
tax differential have shielded the perform ance of budget accounts from commodity price
volatility.

        N onetheless an im plicit export tax to traditional exporters exists as these have to surrender
their foreign exchange earnings to the Central Bank. The quasi-fiscal revenue potential o f this
im plicit tax depends on the difference between the official exchange rate and the market
exchange rate.

        Still, external sources o f revenue are im portant as they represent 36% o f total fiscal
revenues and 6% o f GDP as o f 1998. Im port taxes represented during 1995-1998 more than a
quarter o f total fiscal revenues and 4% o f GDP. This dependence on trade taxes, w hich is one of
the highest in Latin A m erica and selected Caribbean countries, has becom e a source of concern
as the D om inican Republic is opening up to external competition (the country is part o f several
regional agreements and since M arch 1995 is a m em ber o f the W orld Trade Organization (WTO).
In 1998, it signed free trade agreements with the Caribbean Community (CARICOM ) and the
Central American Comm on M arket (CACM). In short, how can the country carry out an outward
looking econom ic policy w hile maintaining the present w eight o f trade taxes in fiscal revenue?

        In 1998, a tariff reform was elaborated seeking to reduce the tariff interval from the
present 0% -35% to 0%-15%, diminishing effective rates o f protection and the average mean tariff
rate. W hile the proposal is still under inspection by the legislative power, if implem ented it could
decrease trade taxes substantially and endanger fiscal stability, especially since the present fiscal
account surplus falls short o f the sustainability surplus boundary line by 1.5% o f GDP.
2
A reduction in internal interest rates could diminish the sustainability surplus boundary
line. Additionally, the fiscal reform — also in the legislative cham ber— w hich seeks to increase
the value added tax rate from 8% to 12% coupled with substantial decrease in governm ent
subsidies (which the privatization law [1997] ultim ately seeks to achieve) to state owned firms
could generate earnings to com pensate the fiscal gap and provide the necessary m aneuver margin
to distribute income. First approxim ation calculations indicated that even if the tariff proposal is
carried out and all governm ent subsidies to state owned firms were eliminated, the resulting
surplus would, other things being equal, fall short of the sustainability surplus by 1% of GDP.3
1. Introduction
D uring the 1980’s, the D om inican Republic 1 made attempts at macroeconom ic reform that saw
little success. A decade later a stabilization and structural reform package was implemented. This
package included, among other aspects, inflation control through monetary restraint and a tax and
tariff reform w hich sought to increase the efficiency of the prevailing tax structure and eliminate
its relative price distortion while maintaining fiscal equilibrium. Price stabilization was achieved,
nominal im port tariff rates w ere reduced and the economy started on a grow th trajectory that has
lasted into the present.
However, fiscal performance remained dependent on an array o f foreign trade taxes,
specifically on im port taxes (27% o f total fiscal revenues and 4.2% o f GDP for 1990-1998). W ith
time as the oil tax becam e a m ajor source o f revenue (14.7% o f total revenue for 1990-1998), 2
budget accounts becam e dependent, as well, on international oil prices and exchange rate
variations. Following a 1996 reform, the oil tax was made less vulnerable to changes in both
these variables. The w eight o f trade taxes rem ains a concern as the D om inican Republic registers,
w ith few exceptions, the highest ratio o f trade taxes to total fiscal revenue o f Latin American and
Caribbean countries.
In 1998, a tariff reform proposal was elaborated w hich plans to reduce present nominal
tariff rates — so as to diminish effective rates of protection— , and to simplify the present tariff
structure characterized by a w ide tax rate dispersion. W hile the proposal would certainly yield a
decrease in trade revenue taxes a fiscal reform project, also under current discussion, could
com pensate this revenue loss.
The aim of the paper is to examine the fiscal im pact of trade liberalization and commodity
price fluctuation for 1980-1998. The paper is divided into five sections. The first section
describes, albeit briefly, the economic situation during the 1970’s that led to the first attempts at
economic reform. This prelude is followed by an analysis o f macroeconom ic performance for
1982-1998, that distinguishes four periods corresponding to the initial attempts at monetary and
fiscal stabilization (1982-1986), an interlude characterized by aggregate dem and and public
works expansion (1986-1990), a macroeconom ic reform package (1991-1995), and the deepening
o f econom ic reform s (1995-1998).
The Dominican Republic has 7.8 million inhabitants (est. 1997) and a gross domestic product
(GDP) per capita of 1 460 US dollars (Britannica, Book of the Year, 1998).
2 The oil tax is a tax levied on imported oil.4
The third section describes the evolution of the commercial regim e and focuses on the
tariff and fiscal reforms (1990-1992, 1997-1998). The fourth section decomposes the revenue
side of the fiscal accounts between internal and external sources of revenue and examines the
im portance of trade tax revenues, im port taxes and export taxes as percentages of total tax
revenue and GDP. It also provides a com parison o f trade taxes between the D om inican Republic
and 19 other Latin American and Caribbean countries. The fifth section analyses the concept of
budget sustainability and assesses w hether tariff reform proposals w ould generate a fiscal
revenue w ithin a fiscal sustainability region. Finally, the sixth section examines the fiscal im pact
o f commodity price fluctuation. As export taxes are virtually nil, the focus is on the oil tax.
2. The 1970’s: the prelude to econom ic reform
D uring the 1970 s the economy o f the D om inican Republic followed a path o f im port substitution
w hose goals consisted in weakening the link between GDP growth and traditional exports,
loosening balance-of-paym ents constraints and prom oting high em ploym ent levels. W ithin this
strategy, the prom otion o f national and foreign investm ent became a national priority.3 The
initial results w ere impressive. The economy registered on average a 12% rate of growth between
1970 and 1973 w ith one digit inflation. M oreover, the budget accounts registered a surplus and
the current account deficit was by m ost definitions manageable.
Eventually, as happened in other im port substitution cases, the economy showed signs of
deep disequilibria. The overall rate o f growth dropped by 50% and the ratio o f industrial GDP to
aggregate GDP began to decrease indicating the beginnings of a deindustrialization process. In
addition, the m arket understood the official exchange rate to be overvalued and was prepared to
pay a higher premium for every dollar bought (even though the real exchange rate was
overvalued by 15%) reflecting devaluation w orries over a m erchandise trade deficit that had
reached 7% o f GDP on average between 1978 and 1981 (see table 1). 4 Following the fall in
GDP growth the coefficient o f fiscal flexibility fell. 5
In accordance with the overall performance, econom ic sectors slowed their development.
Agricultural production was ham pered by a lack of incentives and industry showed signs of
inefficient m anagem ent due to exaggerated protection and state subsidies. Unilateral transfers to
state owned firms increased from 186 million dollars during 1970-1973 to 589 million dollars for
the period 1978-1981. This affected fiscal performance and was not balanced by an increase in
3 Ceara Hatton (1990) labels the development strategy followed during this time an import
substitution strategy. Pons (1995) refers to a strategy based on promoting national investment and
especially of attracting foreign investment. In any case, the import substitution model is not unique to this
period of time. An early application is found for the period 1938-1961 during the dictatorship of Rafael
Leonidas Trujillo (1930-1961).
4 The current account gap was also of the order of -6% or -7% of GDP as the service balance
was in deficit and unilateral transfers (which started to be an important source of foreign exchange from
1978 onwards) did not compensate both deficits. The service gap became positive starting in 1985.
5 The coefficient of fiscal flexibility measures changes in tax revenue brought about by
changes in income maintaining constant a given tax structure. Here we measure tax flexibility in absolute
rather than in relative terms.5
tax collection as the tax-G D P ratio, decreased by 4.7 percentage points between 1970-1973 and
1978-1981 (see table 1).
D uring 1981 and 1982 a consensus em erged that achieving macroeconom ic balance via
m arket mechanisms rather than by targeting specific sector developm ent through relative price
distortions was a necessary step for long run growth.
T a b le 1
D O M I N I C A N R E P U B L IC : S E L E C T E D A V E R A G E M A C R O E C O N O M IC A N D
F IS C A L I N D IC A T O R S , 1 9 7 0 -1 9 8 1
M A C R O E C O N O M IC IN D IC A T O R S
GDP E x change r er ^ x R eal w age
E x tern a l
Y ears In fla tio n rate In d e x IC OC
g r o w th gap
O P 1970=100 1970=100
1 9 7 0 -1 9 7 3 1 1 .9 7 .8 1 1 .1 4 9 5 .0 8 1 .9 1 7 .9 3 9 .0 -2 .8
1 9 7 4 -1 9 7 7 5 .7 12.1 1 1 .1 9 8 4 .1 7 8 .4 1 9 .8 4 8 .5 -0 .2
1 9 7 8 -1 9 8 1 4 .7 1 0 .2 1 1 .2 5 8 4 .2 7 5 .0 1 6 .6 4 4 .7 -6 .5
F is c a l In d icators
Y ears S a v in g s G ap F is c a l F is c a l T a x -G D P F is c a l r ev en u e C o e ffic ie n t o f fis c a l
G ap r e v e n u e -G D P v e lo c ity fle x ib ility
ratio R atio
1 9 7 0 -1 9 7 3 4 .2 1 1 7 .8 15.3 5 .5 1.2
1 9 7 4 -1 9 7 7 6 .5 -0 .1 17.3 14.1 6 .4 0 .6
1 9 7 8 -1 9 8 1 4 .5 -1 14.3 1 0 .6 7 .0 0 .7
S o u r c e : E la b o ra ted o n th e b a s is o f ta b le s 19 an d 2 0 .
N o te : O = o f fic ia l e x c h a n g e rate; P = p a r a lle l e x c h a n g e rate; IC = in d u str ia liza tio n c o e ffic ie n t; O C = o p e n n e s s
c o e ffic ie n t; R E R = real e x c h a n g e rate. F is c a l r ev e n u e v e lo c ity is d e fin e d as th e ratio o f n o m in a l G D P to
f is c a l rev e n u e. T h e c o e ffic ie n t o f fis c a l f le x ib ility is th e rate o f c h a n g e o f th is ratio.
Betw een 1980-1998, tw o stabilization attempts that followed this train o f thought were
undertaken. The first one took place between 1982 and 1986 and failed due to a lack o f political
consensus. The second attempt, based on monetary and fiscal restraint, initiated in 1990 and was
followed by a fiscal and tariff reform. Both reform s sought to liberalize the economy. This
attempt — so far successful— has been followed by a deepening o f structural reforms. In between
both attempts, the years 1986-1990 w itnessed an experim ent to spur growth via increases in
aggregate demand coupled w ith restrictions on foreign exchange and trade flows that
m aterialized in an increasing reliance in trade taxes to balance the budget. The following section6
describes in chronological order m acroeconom ic policies during 1980-1998 and their
performance results. Em phasis is placed on the commercial regim e adopted and on their tariff and
fiscal policies.
3. M acroeconom ic overview: 1980-1998
a) Initial attem pts at m onetary and fiscal stabilization (1982-1986)
In January 1983 prevailing economic im balances led the authorities to sign an agreement
w ith the International M onetary Fund (IMF). The agreem ent com bined a restrictive monetary
policy w ith active budget control through a freeze on expenditure and tax hikes. In addition the
governm ent im posed tight foreign exchange controls to fix an exchange rate parity. Betwen 1982
ad the end o f 1983 M1 and M 2 growth had decreased by from 13.1% and 16% to 6.7% and 9.1%,
respectively, from the previous year and the annual rate o f inflation dropped from 60% 1982 to
6.0% in 1983. The budget deficit as a percentage o f GDP was h alf a percentage point low er in
1983 than in 1982.
The 1983 programm e finally fell prey to a contradiction that arose out o f rhetoric and
practical politics. On the one hand the governm ent vow ed to accomplish the goals o f the
program m e; on the other governm ent officials criticized the programm e for its negative effects on
em ploym ent and on poverty. 6
From a trade perspective the years 1983-1985 saw a decrease in the term s o f trade due to
the fall in the unit price o f traditional export products. Despite the unfavourable external
conditions, the authorities opted for a trade liberalization strategy reflected in a low er share o f
foreign trade taxes in GDP and o f taxes in merchandise foreign trade (see table 2 ).
The end result o f the programm e was a sharp drop in foreign capital flows and a surge in
capital flight. M oreover, by January 1985 as the lack o f consistency and credibility took hold
over agent’s decision m aking process, the governm ent allowed the currency to float against the
dollar and later fixed a unified exchange rate for all financial transactions. Interest rates as well as
prices were adjusted. The currency depreciated by 30% (see Graph 1). These measures ultimately
increased the dem and for dollars and according to some authors (i.e., Pons, 1995) pushed the
economy into a de facto dollarization.
The w orsening o f economic conditions led to a stand-by agreem ent w ith the IMF that was
signed in April 1985. The agreement was designed to overhaul the financial system and stimulate
the economy. The new IMF program m e stimulated D om inican agriculture as previously fixed
Pons (1995, p. 415) refers to the end of the 1983 reform efforts in the following way: “This
policy failed because the IMF was constantly being attacked by public officials while the government tried
to execute IMF recommendations.. ..the government ended up discrediting its own policies...at the end of
April 1984...government policy makers attempted to take advantage of the Holy Week vacation to raise
prices of all essential products.” By 1984, the rate of inflation was 39%, M1 and M2 growth, 49% and
30% respectively.7
prices w ere allowed to increase. The lim itation of credit to the public sector helped to narrow the
control on the money supply thereby lim iting price expansion. The governm ent was able to
increase revenues through im port and export duties. Foreign reserves w ere increased through
IMF and by tourism and free trade zone activities. However, during 1985 the economy registered
negative growth (-2.1% ) discrediting the authorities efforts to stabilize the economy.
G rap h 1
D O M I N I C A N R E P U B L IC : O F F IC IA L A N D M A R K E T
E X C H A N G E R A T E S , 1 9 8 0 -1 9 8 7
Years
S o u r c e : M artí G utiérrez ( 1 9 9 7 ).
T a b le 2
D O M I N I C A N R E P U B L IC : F O R E IG N T R A D E I N D IC A T O R S , 1 9 7 0 -1 9 8 6
F o r e ig n trade E stim a te fis c a l Share o f ta x e s in T erm s o f trade
E ffe c tiv e ta r iff
Y ears ta x e s as % o f r ev e n u e lo s s m e rc h a n d ise in d e x
rate
GDP (M ill. U S D ) trade 1990=100
1 9 7 0 -1 9 8 1 6 .4 % 14 .6 % 2 2 .6 % 1 8 2 .2
1 9 8 2 -1 9 8 5 2 .8 % 143 7 .0 % 10 .5 % 1 6 3 .9
1986 3 .9 % 238 11 .5 % 1 4 .9 % 1 5 0 .8 3
Source: Martí Gutierrez (1997).8
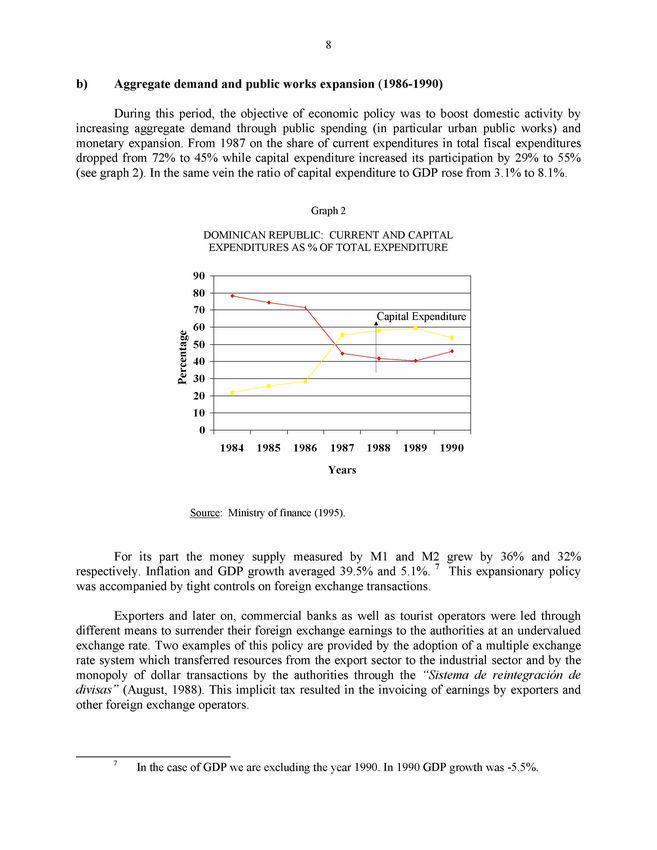
b) Aggregate demand and public works expansion ( 1986-1990)
D uring this period, the objective o f econom ic policy w as to boost domestic activity by
increasing aggregate dem and through public spending (in particular urban public w orks) and
monetary expansion. From 1987 on the share o f current expenditures in total fiscal expenditures
dropped from 72% to 45% w hile capital expenditure increased its participation by 29% to 55%
(see graph 2). In the same vein the ratio o f capital expenditure to GDP rose from 3.1% to 8.1%.
G rap h 2
D O M I N I C A N R E P U B L IC : C U R R E N T A N D C A P IT A L
E X P E N D IT U R E S A S % O F T O T A L E X P E N D IT U R E
Years
S o u r c e : M in istry o f fin a n c e (1 9 9 5 ).
For its part the money supply m easured by M1 and M 2 grew by 36% and 32%
respectively. Inflation and GDP grow th averaged 39.5% and 5.1%. 7 This expansionary policy
was accompanied by tight controls on foreign exchange transactions.
Exporters and later on, commercial banks as well as tourist operators w ere led through
different means to surrender their foreign exchange earnings to the authorities at an undervalued
exchange rate. Two examples o f this policy are provided by the adoption o f a multiple exchange
rate system which transferred resources from the export sector to the industrial sector and by the
m onopoly o f dollar transactions by the authorities through the “Sistem a de reintegración de
d ivisa s” (August, 1988). This im plicit tax resulted in the invoicing o f earnings by exporters and
other foreign exchange operators.
In the case of GDP we are excluding the year 1990. In 1990 GDP growth was -5.5%.9
In 1987 the country was forced into a balance-of-paym ents crisis as capital outflows
coupled w ith an increasing current account deficit (99% increase between 1986 and 1987) led to
reserve losses w hich amounted to 2.5% o f GDP, in that year, and then increased to 4.3% and
8.7% in 1989 and 1990 respectively.
The lack o f foreign reserves forced the governm ent to delay paym ents on short term debt
(mainly paym ents for oil, medicine, and food imports). M oreover, in M ay 1989, the governm ent
suspended servicing m ost o f its foreign debt and did not pay its debt to foreign banks. Finally, in
the m onth o f Septem ber the monetary authorities announced the total suspension o f paym ents of
its commercial bank debt reaching 800 m illion dollars. Suppliers cut o ff their credits as well as
the delivery o f their goods to the D om inican Republic w hich included oil, food, medicines, raw
materials. This in turn led to a fuel and energy scarcity.
M eanw hile despite foreign exchange controls the parallel exchange rate depreciated and
eventually acted as a centre o f gravity o f the official exchange rate (see table 3). The devaluations
o f the peso shot up inflation while the decrease in the supply o f production inputs and basic
foodstuff led to a contraction in GDP growth.
T a b le 3
D O M I N I C A N R E P U B L IC : D E P R E C IA T I O N R A T E S O F T H E O F F IC IA L A N D P A R A L L E L
EXCHANG E RATES
J a n u a ry -D ec em b er , 1 9 8 7 -1 9 9 0
(P e r ce n ta g e )
1987 1988 1989 1990
O ffic ia l e x c h a n g e rate 57 26 0 81
P a ra llel e x c h a n g e rate 58 27 30 58
N o t e : E la b o r a ted o n th e b a s is o f ta b le 2 1 , A p p e n d ix .
c) The beginnings o f stabilization and structural reform (1990-1995)
In 1990 a stabilization package, term ed the N ew Econom ic Program m e (NEP, hereafter)
was launched (see table 4). The main objective was to bring down the rate o f inflation through
the curtailm ent o f governm ent expenditure and a unified exchange rate regime. The reduction in
the fiscal deficit was to be accomplished by the contraction o f subsidies to state owned
enterprises and by increasing revenues by increasing trade taxes. The Central B ank engaged in a
reduction o f the money supply by contracting credit, exerted a m ore pronounced control on the
level o f international reserves and started to repay the external debt. The first effects were
contractionary. Investm ent and public expenditure fell by 20% and 10% respectively. GDP and
GDP per capita decreased by 5.5% and 7.4%.10
The NEP also included a series of structural reforms namely, the tariff, tax and financial
reforms. The tariff reform (September, 1990) aimed at reducing tariff rates and their dispersion as
well as the average effective rate o f protection. The tax reform (June, 1992) sought to increase
tax collection and its efficiency. Both reforms are discussed in greater detail in section 5.
From 1991 to 1992 the economy began to show signs o f recovery. The GDP growth rate
reached 8% in 1992. Inflation declined from 79.7% in 1990 to 5.2% in 1992 and the consolidated
public sector deficit w hich had reached 5% o f GDP in registered a 1.6% surplus. In short, overall
macroeconomic conditions im proved despite a deficit of 63 million dollars in the global balance
of payments.
D uring 1993-1995, governmental authorities, led by favourable expectations o f the state
of the economy, adopted once again expansionary policies. This resulted in a decrease in the
central governm ent’s budget surpluses registered following the im plem entation o f the 1990
programme. On average for the period 1990-1992 the central governm ent registered a +2.3%
budget surplus in term s o f GDP w hich decreased to +0.1% for 1993-1995.
GDP growth decreased from 8.0 in 1992 to 4.3% in 1994 and inflation increased to
14.3%. Finally in 1995 new stabilization policies were adopted and the authorities announced
their com mitment to fiscal and monetary discipline as a vehicle to ensure long term stable
growth.
T a b le 4
D O M I N I C A N R E P U B L I C : M A I N S T A B IL I Z A T IO N M E A S U R E S A D O P T E D
B E T W E E N 1990 A N D 1992
F is c a l p o lic y P e tr o le u m p r ic e s w e r e d o u b le d . T h e o il ta x o r p e tr o le u m d iffe re n tia l b e c a m e
a n im p ortan t so u rc e o f fis c a l in c o m e 2% o f G D P o n a v e ra g e b e tw e e n 1991
an d 1 9 9 5 an d 14% o f a ll ta x r e v e n u e s o n a v era g e b e tw e e n 1991 an d 1 9 9 5 .
E lim in a tio n o f su b s id ie s to e le c tr ic ity , su g a r a n d w h ea t.
T em p orary ta x o n im p o rts in itia lly se t at 15% b u t to b e lo w e r e d to 4% in June
1 9 9 5 an d that a ffe c te d 4 0 % o f a ll im ports.
T em p orary in c re a se in ta r iff rates b y 1.3 an d e lim in a te d b y S e p te m b e r 199 6 .
Im p le m e n ta tio n o f a fo r e ig n cu rren cy tr a n sa c tio n o f 2 .5 % w h ic h w a s red u ced
to 1.5% .
M o n eta ry p o lic y In terest rate lib er a liz a tio n .
In ternal c re d it red u ction .
E x c h a n g e rate p o lic y U n ific a tio n o f e x c h a n g e rates an d b e g in n in g s o f a m a n a g e d flo a tin g e x c h a n g e
rate r eg im e.
Source: WTO (1996), IMF (1995).11
d) Reform deepening (1995-1998)
D uring this period the D om inican economy experienced high rates of grow th (7% on
average) w ith one digit inflation rates (7.3% on average). Growth has been led by the dynamism
of non-tradable sectors (construction, tourism, com m unications) while inflation has been kept in
check by the use of a nominal exchange rate anchor coupled with restrictive monetary policy
measures.
Overall, fiscal policy succeeded in obtaining balanced budgets 8 and increasing the share
o f taxes in GDP (13.8% in 1995 and 15% in 1998). Seen from the expenditure side, the focus of
fiscal policy (especially since 1996) has been to reduce the share o f capital expenditures and to
increase that of current expenditures. 9 The projected increase in current expenditure sought to
respond to social objectives.
Yet, the bad financial state of public firms has generated a flow of unilateral governm ent
transfers that represented in 1998, 29% o f all current expenditure and 22% total expenditure,
constraining the governm ent’s capacity to initiate social programmes. The current privatization
process should help to cut expenses on this item and thus increase its discretionary spending
capacity.
From the revenue side, fiscal performance is seen to depend on trade taxes as these
accounted for more than a quarter of total revenue, highlighting thus the dependency of fiscal
perform ance on these taxes. D espite m anifest intentions to the contrary, reducing trade taxes may
be far from being simple as other sources of revenue such as the value added tax revenues (18%
and 19% o f all tax revenues in 1995 and 1998) have barely increased in importance. This has
forced the authorities, in some instances, to rely on excise taxes to achieve fiscal equilibrium.
M ore recently, the authorities have taken steps to reduce tariff rates and increase internal
tax collection. In 1997, the governm ent im plem ented a 0% tax rate on im ported inputs and
machinery. Also in 1997 and 1998 a tariff and a tax reform proposals w ere submitted to the
legislative cham ber for discussion. The tariff reform contemplates the reduction of tariff rates and
their dispersion. The tax reform includes a proposal to increase the value added rate from 8% to
12% (see section 5).
The performance of national exports has stagnated while free trade zone exports are
increasingly growing in importance. 10 D ue to high levels of consumption, and appreciated
aexchange rate im ports have sharply increased especially since 1996, contributing to highlight the
role of tariffs as an im portant revenue source. The overall result has been a trade deficit that in
1998 reached 16% o f GDP. However, the current account deficit is 2.4% o f GDP due to the
growth of rem ittances and a positive service balance.
8 Refers to the Central Government’s budget following the cash flow methodology.
9 Current expenditure was to represent 60% of all government expenditure and capital
expenditure 40%.
10 However the government has introduced a bill (Ley de Fomento a la Exportación), that is
likely to provide incentives to the exports of traditional products such as for example tax drawbacks.12
The capital/financial account has reduced its capital outflow and has become, as expected,
an im portant source o f balance o f paym ents financing needs. Indeed, in 1995 net official capital
outflows w ere estimated at 20 million dollars and private capital outflows were o f the order o f 40
million dollars. W hile these figures represented an im provem ent over earlier years (in 1990 net
official capital outflows w ere 300 million dollars and in 1994 private capital outflows w ere 150
million dollars) the 1995 financial situation highlighted an im portant source o f balance of
paym ents vulnerability. By 1998, total capital outflows am ounted to 1 113 million dollars while
inflows w ere 2 821 million dollars. Still, the level o f reserves is by m ost standards low (1 or 1.4
m onths o f imports).
4. Com m ercial regime; tariff and fiscal reforms
a) The com m ercial regime
The D om inican Republic has partaken in different trade agreements and participated in
regional blocs and more recently has becom e a m em ber o f the multilateral trading system. 11
The country signed in 1983 together w ith 27 other Central American and Caribbean
nations the Caribbean B asin Initiative (CBI) w hich allows these countries exports to enter the
U nited States m arket on a preferential basis. The exceptions to the rule apply among other
products to textiles, canned tuna, leather, and plastic. 12 Similarly the country is part since 1989
o f the Lom é Convention. Finally in 1998 the D om inican Republic signed free trade agreements
w ith Central A m erica and the Caribbean which contemplate negotiations on services and
investment. 13
11 The Dominican Republic joined the WTO in March 1995.
12 The CBI had initially a duration of 12 years from its entry into force (January 1984).
However, in 1990 it acquired permanent character.
13 Trade between the Dominican Republic and Central America is minor. Total Dominican
exports to Central America amounted in 1997 to 41.5 million dollars (0.9% of total exports) while its
imports were 162 million dollars (2% of total imports). The same is true of the commercial relations
between the Dominican Republic and CARICOM (Dominican exports were 17 and million dollars in
1996). See Centre for the Promotion of Exports (CEDOPEX) (1997; 1998).13
Table 5
DOMINICAN REPUBLIC: SELECTED FISCAL MEASURES, 1995-1998
Date Measure
January 1995 USD 10 tax per passenger on all airlines with scheduled flights from and to
the Dominican Republic. A tax of USD 5 is established for charter airlines
and air cargo lines will be subject to a tax of USD 0.03 per pound
transported. The USD 0.03 tax was reduced to USD 0.02 in February.
June 1995 The 15% foreign exchange surcharge applied to 41% of imports was
eliminated.
1996 Increase by 10% the tax charged to hotel, motel and aparthotel users.
1996 Increases in subsidies to state-owned firms (205 million Dominican pesos to
The Dominican Corporation of Electricity; 110 million pesos to the State
Sugar Council and 35 million pesos to the Autonomous University of Santo
Domingo).
1996 Oil taxes will be used for the payment of the external debt.
1996 Increase of 30% in the pension earnings between 0 and 5 000 Dominican
pesos and 10% those above 5 000 Dominican pesos.
December 1996 The oil tax differential becomes a fixed amount per type of product. For
gasoline the oil differential is fixed at 12.48 pesos per gallon and will
decrease to 12.17 pesos in 1997.
December 1996 Increase in internal oil prices.
1997 Application of inflation adjustment to the income tax.
1997 0% tariff rate applied to the import of inputs, equipment and machinery for
the agricultural and textile sectors.
1997 Creation of the Dirección General de Impuestos Internos. This institution
unified the Dirección General del Impuesto sobre la Renta and the Dirección
General de Rentas Internas with the aim of centralizing in one institution the
task of tax collection reducing operative costs and eliminating the duplication
of functions.
March 1998 Increase in the exempted tax base of the tax income.
Source: IMF (1996), Central Bank of the Dominican Republic; ECLAC (1999).
A t the same tim e the D om inican Republic has had a history o f maintaining restrictions to
both im ports and exports. For a long tim e it oriented its trade policy objectives around a gam ut of
trade policy instrum ents: tariffs, contingents, licenses, prohibitions, exem ptions and concessions.
These instrum ents were applied through different laws, decrees, resolutions, and adm inistrative
dispositions. According to the W TO (1996) prior to the 1990 tariff reform, there w ere 27 fiscal14
laws that adm inistered the regim es applied to im ports and 140 taxes and duties. Imports were
subject to three types o f fixed exchange rates. Tariff rates com prised: excise, ad valorem and
com posite rates.
W hile m ost im ports w ere subject to these restrictions there w ere a few exceptions, namely
the activities w hose goal was to promote the tourism sector and free trade zones. The
com bination o f tariff and non-tariff barriers for m ost tradables and the exem ptions granted to
certain activities fostered a process o f developm ent o f a dual economy w ith dynamic and
stagnating sectors. This duality is m anifest when com paring free trade zone exports to national
exports (see table 6 and section 3.d above).
Im port prohibitions w hich were especially prom inent since 1979 included textiles, food
and electronic products, textiles, shoes, cars, and luxury items. Im port prohibitions w ere justified
on the grounds o f encouraging national production and o f enabling the country to balance its
external accounts. Between 1979 and 1986 there w ere eight decrees that prohibited among others
im ports o f textile products shoes, belts, and pastas. The 1990 reform did not explicitly suppress
im port prohibitions, how ever since the reform these have not been enforced.
Table 6
DOMINICAN REPUBLIC: NATIONAL AND FREE TRADE ZONE EXPORTS, 1980-1998
Free Trade
National Free Trade Zone exports as
Year Exports % Growth Zone exports % Growth
% of total
(Mill. USD) (Mill. USD) exports
1980 960.4 117.1 10.8
1981 1 184.7 23.3 128.2 9.5 9.7
1982 756.9 -36.1 155.1 21 17
1983 781.5 3.2 181.2 16.8 18.8
1984 870.3 11.4 195.7 8.0 18.3
1985 734.9 -15.6 214.7 9.7 22.6
1986 726.7 -1.1 246.7 14.9 25.3
1987 708.5 -2.5 332.3 34.7 31.9
1988 898 26.7 519.9 56.5 36.7
1989 928.3 3.4 735.3 41.4 46.4
1990 744.1 -19.8 838.6 14.0 52.9
1991 659.6 -11.4 1 052.8 25.5 61.4
1992 564.5 -14.4 1 194.2 13.4 67.9
1993 504 -10.7 2 608.9 118.5 83.8
1994 626.2 24.2 2 716.1 4.1 81.2
1995 758 21.0 2 907.4 7.0 79.3
1996 835.7 10.3 3 107.3 6.9 78.8
1997 958.2 14.7 3 596.4 15.7 78.9
1998 942.3 -1.7 3 930.3 9.3 80.6
Source: Consejo Nacional de Zonas Francas (1998).15
M ost im port quotas permits and licenses were eliminated at the beginning of 1990.
A ccording to the W TO (1996) the governm ent denies the existence o f laws that allow for the
application of quantitative restrictions to imports. There are nonetheless tariff contingents for
some agricultural products (corn, milk, beans, onions, rice, chicken, sugar, garlic). In 1998 the
governm ent established quotas that are subject to preferential tariff rates for the im ports of these
agricultural products. 14 The quotas will be applied from 1999 to the year 2005 (see tables 7a-7d
for the years 1999, 2000, 2002, 2005).
Table 7a
DOMINICAN REPUBLIC: QUOTAS FOR AGRICULTURAL
PRODUCTS AND TARIFF RATES THAT APPLY
BEYOND THE QUOTA FOR 1999
Product Quota (t) Tariff rate beyond quota
Corn 858 200 60
Milk 33 600 83
Beans 14 400 95
Onion 3 000 97
Rice 15344 114
Garlic 3600 119
Chicken 8500 136
Sugar 24000 94
Source: National Planning Office (ONAPLAN) (1999).
Note: The tariff rates applied to quotas oscillate between 5% and 40%.
14 In the Uruguay Round of the General Agreement on Tariffs and Trade (GATT) agricultural
products were consolidated at a tariff of 40%. The Dominican Republic tried for some time to change this
consolidated tariff. Prior to 1998 the quotas for these products were still in the process of being
negotiated. In November 1999 a new round of the Agricultural Agreement within the WTO framework
will begin.16
Table 7b
DOMINICAN REPUBLIC: QUOTAS FOR AGRICULTURAL PRODUCTS
AND TARIFF RATES THAT APPLY BEYOND THE QUOTA FOR 2000
Product Quota (t) Tariff rate beyond quota
Corn 897 000 57
Milk 35 000 79
Beans 15 000 94
Onion 3 125 97
Rice 15 755 111
Garlic 3 750 109
Chicken 9 000 130
Sugar 25 000 92
Source: National Planning Office (ONAPLAN) (1999).
Note: The tariff rates applied to quotas oscillate between 5% and 40%.
Table 7c
DOMINICAN REPUBLIC: QUOTAS FOR AGRICULTURAL PRODUCTS AND
TARIFF RATES THAT APPLY BEYOND THE QUOTA FOR 2002
Product Quota (t) Tariff rate beyond quota
Corn 974 600 50
Milk 37 800 69
Beans 16 200 92
Onion 3 375 97
Rice 16 577 106
Garlic 4 050 105
Chicken 10 000 117
Sugar 27 000 89
Source: National Planning Office (ONAPLAN) (1999).
Note: The tariff rates applied to quotas oscillate between 5% and 40%.17
Table 7d
DOMINICAN REPUBLIC: QUOTAS FOR AGRICULTURAL PRODUCTS AND
TARIFF RATES THAT APPLY BEYOND THE QUOTA FOR 2005
Product Quota (t) Tariff rate beyond quota
Corn 1 091 000 40
Milk 42 000 56
Beans 18 000 89
Onion 3 750 97
Rice 17 810 99
Garlic 4 500 99
Chicken 11 500 99
Sugar 30 000 85
Source: National Planning Office (ONAPLAN) (1999).
Note: The tariff rates applied to quotas oscillate between 5% and 40%.
Im port licenses for agricultural products are still in force. 15 In 1998 (decree 114-98) the
governm ent further elim inated non-tariff barriers to the im ports of agricultural products in order
to comply w ith W TO agreements. These non-tariff barriers w ere being im plem ented through 31
decrees and 22 governmental resolutions and affected mainly, rice, m eat and chicken imports.
Imports are also subject to non-tariff taxes. These are mainly the value added tax (with a
8% tax base) and a selective tax on consum er products (STCP) (with a 5-80% tax base interval).
The im ported products that are subject to the STCP are basically: alcoholic beverages, tobacco
products and luxury goods. The im ported products that are value added tax exem pt are books,
petroleum and oil products, milk, and corn among others. An additional im port tax established in
1987 was eliminated in 1995.
Exports restrictions have experienced the same evolution as im port ones. D uring the
1980's there was an increasing anti-export bias. This was the result o f overvalued and multiple
exchange rate regimes, export restrictions and excessive protection of certain national economic
sectors. This was reflected in export perform ance which decreased from 735 million dollars to
504 million dollars between 1985 and 1993 (see table 6). The legislation that has supported
export prom otion has lacked consistency. The prom otion and industrial protection law sought to
develop an industrial sector oriented towards the internal m arket and the creation of a
15 Depending on the circumstances this can lead to unwarranted price variations especially if
accompanied by price manipulation. In 1998, the authorities overissued import permits for rice leading to
an excess supply of rice which lowered its price. The government was forced to sustain its price by buying
rice in order to avoid the negative effects of the fall in the price of rice on national producers. Import
permits for a given product can lead to a bargaining process between the government and the producers
affected by the import of that product.18
m anufacturing sector oriented towards exports. The latter sector was designed to have its own
export laws w hile the national sector w as subject to a set o f restrictions, some o f w hich still exist
today. The way the difference in treatm ent has affected both free trade zone and national export
performance is reflected clearly in table 6.
Until recently export taxes w ere applied to basic commodity exports: bananas, bovine
meat, cocoa, coffee, fish and sugar. Among these the m ost im portant products subject to taxes
w ere coffee and cocoa. D uring the period 1985-1990 export taxes represented 2.0% o f fiscal
revenues.
In M arch 1990, the im plem entation o f the export taxes on those products was eliminated
and in April 1992 the tax was suppressed. H ow ever there still exists a 1.5% com mission on all
foreign exchange rate transactions. The com mission is payable to the central bank. Additionally
traditional exporters m ust surrender their foreign exchange earnings to the Central B ank and
obtain national currency at the official exchange rate. 16 N on-traditional exporters w ere also
subject to this requirem ent but only up until 1994. This requirem ent can be seen as an im plicit tax
on export activities and a quasi fiscal source o f revenues. The larger the spread between official
and parallel exchange rates the bigger is this im plicit export tax (see table 8). 17
As can be seen from the above description o f the commercial regime, m ost restrictions on
im ports and exports have been eliminated. However, the elimination o f im port prohibitions,
restrictions, tax exem ptions coupled with an increase in non-tariff im port taxes resulted in an
increase in foreign trade and the im port tax base.
D uring the 1990's the trade coefficient increased substantially (see table 19 in the
appendix). Also national im ports (i.e., im ports that do not fall w ithin free trade zones) have
doubled their rate o f growth. D uring 1985-1990, these increased by 6.6%. For 1991-1998, the
rate o f growth o f imports reached on average 13.8%. This increase has been brought about partly,
by the im port o f those goods that w ere subject to prohibition and im portant restrictions during the
1970’ s and 1980’s. These represented in 1998, 23% o f all national imports. This provides an idea
o f the extent to w hich the im port tax base would have been reduced in 1998 had these goods been
subject to say prohibition.
16 These traditional products are coffee, sugar, cacao, tobacco, and mineral products other than
nickel.
17 Most minimum prices for export products were suppressed by 1995 save traditional exports.
Until 1992, the governmental institution Center for the Promotion of Exports (CEDOPEX) was in charge
of export control, contingents, licenses and prohibitions. From 1992 on restrictions to exports were
eliminated.19
Table 8
DOMINICAN REPUBLIC: EXPORT TAX REVENUE OF TRADITIONAL PRODUCTS,
1985-1998
Exports of traditional Implicit export tax as
Year Official rate Parallel rate products percentage of total fiscal
(Mill. USD) income
1986 2.89 2.89 547.0 -
1987 3.51 3.84 542.0 7.0
1988 5.81 6.12 711.0 5.66
1989 6.35 6.97 747.0 8.72
1990 8.65 11.13 629.0 24.50
1991 12.58 13.06 556.0 2.33
1992 12.5 12.77 421.0 0.72
1993 12.5 12.67 363.0 0.34
1994 12.62 13.16 486.5 1.31
1995 12.87 13.6 591.3 1.92
1996 12.9 13.77 623.9 2.25
1997 14.02 14.27 667.7 0.55
1998 14.7 15.27 515.5 0.81
Source: Elaborated on the basis of ECLAC (1999) and the Central Bank of the Dominican
Republic (1997-1998).
b) The 1990 tariff reform and the 1998 proposal
The 1990 tariff reform intended to rationalize and simplify the tariff structure as well as to
make it more progressive. It established a new tariff structure w ith seven initial ad valorem tax
rates comprised w ithin the interval 5%-35%. This m eant a decrease in the ceiling rate by 165
percentage points. Prior to the 1990 reform the tariff rate structure was com prised within the
interval 0%-200%.
The tariff rates w ere to be applied on the cif value o f the im ported merchandise rather
than on the fob value as was done prior to the reform. To avoid a sudden im pact on given
protection structures and ensure a soft landing, the authorities im plem ented a tariff surcharge set
at 30% for 1991, 20% in 1992, and 10% in 1993. The im port surcharge was finally suppressed in
1994. A lso a temporal tariff o f 15% was applied to all im ports with the exception o f basic food
products. This temporal tariff was eliminated by the second h alf o f 1995. Finally a tax on foreign
exchange transactions o f 2.5% w as im plem ented w hich was eventually reduced to 2% and later to
1.5% (see section 4 a above).20
In 1991 the authorities added an additional 0% tariff rate to the prevailing tariff schedule.
The 0% rate was applied to basic imports. This increased the num ber of tariff rates from seven to
eight. In 1993, the governm ent increased the 0% tariff rate to 3%. The 3% tariff rate was
expanded to cover agricultural inputs that w ere subject to tariff rates equal or greater than 5%.
Finally, in 1997 the authorities increased the num ber o f tariff rates to nine as they decided to
reinstate a 0% tariff rate on agricultural and textile inputs.
The tariff reform simplified somewhat the tariff structure. However, according to some
the average tariff effective rate increased from 16.1% to 23.2% during 1990-1995. According to
the W TO, how ever the average tariff rate was 17.5% in 1995 (with a standard deviation o f 10.2%
and a coefficient o f variation o f 57%). In term s o f sectors the tariff rates o f agriculture, mining
and industry w ere 17.3%, 6.4% and 18.1% respectively. In 1997, our own calculations yield an
average tariff rate o f 17.3%.
The tariff rates m ost commonly found in 1995 w ere 5%, 10%, 25% and 30% accounting
for 10.4%, 28%, 13.3%, and 15.6% o f all imports. In 1997 these tariff rates accounted 7.5%,
24.1%, 9.5%, and 23.9% o f all imports.
A ccording to the W TO, the D om inican tariff structure that em erged out of the reform was
progressive (i.e., a positive effective rate o f protection). The tariff rates applied to manufactured
products are higher than those applied to products w hich are semi-elaborated (i.e., 20.7% for
finished products, 14% for semi-elaborated products and 15% for raw materials).
The effective rates o f protection o f the new tariff structure remained high. The median
effective rate o f protection for the D om inican industry was estimated w ithin an interval o f 133%
to 188% (Fundación Econom ía y Desarrollo, 1996). O ther sources estimated the m edian rate of
protection to be at 123% for the D om inican industry in 1993 (W orld Bank, 1995).
D espite this tariff reform, as mentioned earlier, imports were still subject to several other
taxes such as value added tax (8%) and excise taxes. The excise taxes applied to im ports vary
between 5% and 80%. D ifferent excise tax rates were applied to im ports and national products. In
1995, the rates applicable to both national and im ported products were unified to 20% and 25%
for alcoholic beverages. Once these all trade taxes are taken into account the effective tariff rate
may be much higher than that derived from the tariff schedule p e r se.The favoured case to
illustrate this point is that of automobiles (see table 8).21
Table 9
DOMINICAN REPUBLIC: AUTOMOBILE TARIFF RATE
Description Value (US dollars) Percentage
Value (fob) 15 000
Freight 2 250 15
Insurance 300 2
Value (cif) 17 550
Import duty 5 265 30
Consular tax 200
Final value of import 23 015
External value added tax 1 841.3 8
Excise tax 13 809 60
Sale price 38 665.3
Effective tariff rate 91
Source: WTO (1996).
Finally, In N ovem ber 1998, a new project for tariff reform (Proyecto de reform a
arancelaria y com pensación fisca l) was submitted to congress. This project seeks to reduce
gradually the tariff structure from a rank o f 0% -35% to five tariff rates w ithin a rank o f 0%-20%
in 1999 and in the year 2000 to four tariff rates w ith a rank o f 0%-15%. The reform will provide a
higher tariff rates for finished products while at the same time result in reduction o f the median
effective rate o f protection. (see table 10 and graph 3). 18 The average tariff rate would be 6.3%.
c) The 1992 fiscal reform and the 1997 proposal
In 1992 the governm ent im plem ented a fiscal reform w hose basic aim was fiscal
equilibrium. The reform tried to adopt simpler fiscal laws to increase the am ount o f revenue and
the efficiency o f tax collection. To this end the fiscal reform m odified personal and corporate
taxes, the value added and excise taxes on consumption.
18 It is important to note the similarity between the proposed tariff schedule and the tariff
schedule that has currently been adopted by Central American countries and which mainly has four tariff
rates (0%, 5%, 10% and 15%). 0% is applied to capital goods, 5% and 10% are applied to intermediate
goods and inputs, and 15% to final consumption goods.22
Table 10
DOMINICAN REPUBLIC: PRESENT AND PROSPECTIVE TARIFF SCHEDULES
Regarding personal and corporate tax laws, the reform increased the allotted am ounts that
are regarded as exem pted. The reform established three tax rates that could be applied to personal
income and one rate for corporate income. The new law established that public firms had to pay
the same corporate taxes as private firms. Fiscal incentives w ere suppressed with a few
exceptions (i.e., productive activities undertaken under the free trade zone regim e).
The value added tax rate was increased from 6% to 8%. The application o f this tax was
extended to cover services. All exports as well as some national produced and im ported goods are
exem pted. The excise tax on consum ption w hich was a specific tax becam e an ad valorem tax.
Fifty individual laws that contained more than a 100 tax rates were suppressed and were replaced
by the new tax code. The new code contemplates rates that comprise 10% to 15% for national
products and seven types that are comprised in the interval 5% to 80%. The reform also reduced
the temporal surcharge on im ports established in 1987 from 15% to 10%. This surcharge was
elim inated in June 1995.
The 1997 tax reform proposal included an increase in the personal income tax base
exem ption and a fixed charge o f 10% on the income tax; an increase in the value added tax rate
from 8% to 12% as well as an extension o f its base; an excise tax on petroleum products and an
increase in the tax rate applied to alcoholic beverages (Pellerano, 1997).23
G raph 3
D O M IN IC A N RE PU B L IC : IM PO R T D IS T R IB U T IO N
A C C O R D IN G TO PR E SE N T T A R IFF SC H E D U L E
25
20
15
Percentages
10
1bet
‘!=H
5
0
vCJ \0 \0 \0
1
\0 \0
-
\0 \0 \0
ON oN oN oN oN o '' O '' O '' O ''
^ ^ (N (N m m
Tariff rates
IMPORT D ISTRIBU TIO N ACCORDING TO YEAR 2000
TARIFF SCHEDULE
Percentages
Tariff rates
Source: National Planning Office (ONAPLAN) (1999).
5. External and internal sources o f governm ent finance
In order to provide an idea of the im portance of trade and other tax revenue related to foreign
trade the central governm ent’s revenues w ere decom posed into internal and external sources for
three periods: 1985-1990; 1990-1995; 1995-1998. The first period corresponds to the revenue
structure prior to the reform. The third and fourth periods correspond to the reform period proper
and that pertaining to the consolidation o f the reforms. The internal revenue sources comprise:
income and property taxes; m erchandise and service taxes. The external sources of revenue
include, export taxes, im port taxes, the foreign exchange com mission and the external value
added tax.
Table 11 highlights several im portant features of the revenue structure prior and following
the tax and trade reform referred to above. Internal sources o f revenues as a percentage o f total
tax revenues increased from 52.5% to 63%, a ten percentual point increase. This is basically the
result o f the gain in im portance o f the petroleum oil tax. As this tax reflects petroleum price
behaviour and exchange rate variation, its revenue potential depends on exchange rate volatility
and international oil price tendencies. This feature of the revenue accounts will be dealt more in
detail in section 7.24
The external sources o f revenue have decreased by little more than four percentage points
due basically to the elimination o f the foreign exchange com mission as a source o f governmental
revenue and o f export taxes. The revenue derived from the external value added increased in
w eight probably reflecting the increase in the value added tax rate from 6% to 8% (this fact is
also patent in the behaviour o f the internal value added tax).
However, im port taxes remained, in term s o f percentage o f total revenue, at the same level
as before on average (27% o f all fiscal revenues). In addition, not taking into account the external
value added tax, foreign trade taxes still account for more than 25% o f total fiscal income.
Relative to GDP, im port taxes represented 3.2% in 1985 and 4.3% in 1998. In the same
vein external sources o f revenue have increased from 4.2% in 1985 to 5.8% in 1998.
The im portance o f im port and in general foreign trade taxes can be attributed, in part, to
foregone adm inistrative costs o f im plem enting internal taxes versus trade taxes. According to
Pellerano (1997), the adm inistrative costs o f foreign trade taxes represent between 1 and 3
percentage points o f fiscal revenue w hile the adm inistrative costs o f im plem enting the value
added tax and incom e taxes am ount to a range between 5 and 10 percentage points o f fiscal
income. In addition the high propensity to im port (see section 4a) coupled with the recent high
rates o f economic growth generates an increasing and predictable source o f fiscal revenue.
Finally, the dependency on im port taxes allows the authorities to use the official exchange rate as
an instrum ent to increase governm ent taxation.
Table 11
DOMINICAN REPUBLIC: AVERAGE GOVERNMENT REVENUE AS A PERCENT OF TOTAL
GOVERNMENT REVENUE, 1980-1998
1985-1990 1990-1995 1995-1998
Internal sources of revenue 52.5 57.7 63.0
Income taxes 18.3 16.6 17.8
Property taxes 1.1 0.6 0.7
Merchandise and services 25.4 34.0 38.4
Internal value added tax 6.6 8.0 9.4
Petroleum differential 2.0 14.1 15.2
Other 18.5 11.0 13.7
Non-Tax income 7.7 6.5 6.1
External sources of revenue 41.1 36.9 36.3
Export taxes 2.0 0.0 0.0
Import taxes 26.7 27.1 27.0
Foreign exchange a/ 3.7 0.1
Value added tax 3.5 5.6 8.8
Other 1.4 0.4 0.4
Source: Elaborated on the basis of table 26, Appendix.
Note: The decomposition does not include capital income.
a/ Not available for 1985-1987.25
Table 12
DOMINICAN REPUBLIC: GOVERNMENT REVENUE AS A PERCENT OF GDP.
SELECTED YEARS, 1980-1998
1985 1990 1995 1998
Total tax revenues 11.4 11.8 13.7 15.0
Total Revenue 12.2 12.9 14.7 15.8
Internal sources of revenue 6.8 7.0 8.8 10.0
Income taxes 2.1 2.7 2.6 2.8
Property taxes 0.2 0.1 0.1 0.1
Merchandise and services 3.7 3.2 5.2 6.2
Internal value added tax 0.5 1.2 1.3 1.5
Petroleum differential ... 0.2 2.3 2.6
Other 3.3 1.8 1.6 2.1
Non-Tax income 0.7 1.0 1.0 0.8
External sources of revenue 4.2 4.5 5.3 5.8
Export taxes 0.3 0.0 0.0 0.0
Import taxes 3.2 2.6 4.0 4.3
Foreign exchange 1.4 0.1 0.0
Value added tax 0.5 0.4 1.3 1.4
Other 0.2 0.1 0.1 0.1
Source: Table 26 Appendix.
Note: The decomposition does not include capital income.
Indeed, devaluations, a frequent feature o f the D om inican economy, increase tariff im port
revenue income. This follows from our estimates o f the demand for imports w hich yield an
elasticity w ith respect to relative price changes below unity (0.62; see appendix A.2 for results).
This result, probably due to lack o f substitutes, indicates that any im port price increase will result
in higher im port tariff revenue (table 13).
Table 13
DOMINICAN REPUBLIC: EXCHANGE RATE DEVALUATIONS AND IMPORT
REVENUES, 1980-1998
1980 1985 1990 1995 1998
Selected National 1520 1286 1793 3164.2 4896.6
Exchange rate 1.26 3.12 8.65 12.87 14.70
National Imports in pesos 1915.2 4012.3 15509.45 40723.2 71980.0
Hypothetical tariff rate 10 10 10 10 10
Tax Import Revenue 191.5 401.2 1550.9 4072.3 7198
Source: Central Bank of the Dominican Republic.
Note: National imports comprise durable consumer goods, equipment, machinery and intermediate goods.26
The fiscal dependency o f the D om inican Republic on foreign trade taxes and more
precisely on im port taxes has generated debate and concern. Indeed not only does the Dominican
Republic have one o f the highest trade taxes to total fiscal revenue ratios in Latin Am erica (see
table 14) but also as the D om inican Republic seeks to carry out a policy o f opening up trade and
decreasing trade barriers and tariffs, the question remains o f how to decrease trade tariffs without
endangering fiscal stability.
Such an analysis can be carried out by first defining the concept o f fiscal sustainability
and then estimating the revenue loss due to different tariff reduction schedules. The next section
addresses both issues. 19
19 The concept of sustainability centres on the relation between internal debt and the primary
(or operational) surplus (or deficit) and expresses that relation as a function of the rate of interest minus
GDP growth. The higher the rate of growth of GDP for a given interest rate and internal debt-GDP ratio,
the greater is the deficit-GDP ratio sustainability area. In the same way, the greater the difference between
the rate of interest and GDP growth for a given internal debt-GDP ratio, the greater is the budget surplus
required to remain in the sustainability area. Two other ways to analyse budget accounts and the impact of
a given tariff structure on fiscal performance are the concept of “prudent” fiscal deficit and an analysis of
optimal taxation. Akin to the concept of sustainability, the idea of “prudent” fiscal deficit places emphasis
on macroeconomic magnitudes: “one way to decide whether a public deficit is ‘prudent’ is to determine
whether financing it is consistent with other macroeconomic objectives ...growth of private investment,
control of inflation.”(World Bank, 1988, p.58). One should add that the notion of “prudent” budget deficit
also should involves an assessment of its magnitude or size. In other words, fiscal prudence should also
depend on the level of the budget deficit relative to GDP. In the case of the Dominican Republic, as
shown in table 21, in the appendix, the central government’s budget accounts have remained, by most
accounts, manageable and in fact prudent. The fiscal balance as a percentage of GDP reached -1.2%, 1.2%
and 0.5% for 1980-1990, 1991-1995, and 1996-1998 respectively. Lastly, the question of tariff optimality
can be viewed from the angle of maximizing government revenue subject to a given constraint. One could
envision total government revenues from tariffs as a function of two components. First, a given tax rate
multiplied by a variable tax base (in this case the import base). This component would allow to examine,
other things being equal, the fiscal effect of changing the import base via institutional arrangements for a
given tax rate. The second component would involve a variable tax rate multiplied by an import demand
function with given parameters. Total government revenue will be maximized at the point where the
marginal gain from expanding the import base for a given tariff rate equals the revenue gain from
increasing the tariff rate on a given import demand function.You can also read