United Way of Sarnia-Lambton Strategic Plan 2017 - Public version
←
→
Page content transcription
If your browser does not render page correctly, please read the page content below

United Way of Sarnia-Lambton

Strategic Plan
2017

Sarnia-Lambton – Our focus. Our priority.

                   Public version
It's a fact that people donating to charity increasingly want to know that their
  donations are making a difference and that the organizations they donate to are
  spending their money efficiently. Donors want to be sure that they are investing in
  charities that are deserving of support.

  While donors are drawn to causes that resonate with them and generally appreciate
  the vital importance of the nonprofit sector, a common measuring stick they use to
  evaluate the effectiveness of an organization (or to compare two organizations) is
  that of “overhead” or administrative and fundraising costs. In fact, donors and
  potential donors are expressing significant unease on this topic:

▪ A 2013 survey by the Muttart Foundation found 74% of Canadians believe charities
  spend too much on salaries and administration; A World Vision survey showed
  32% of people surveyed believe 100% of money raised should go “to the cause”; A
  2007 Statistics Canada survey of Canadians found that 30% of potential donors
  believe money donated would not be spent efficiently.
  These concerns were spelled out bluntly in MoneySense magazine’s 2015 annual
  rating: “Let’s face it, most of us would prefer our hard-earned dollars go to charities
  that concentrate on their cause, rather than bloated institutions that soak up
  donations to support their own operation.” While the donor desire for investing in
  solidly managed charities is one shared by charities themselves, Imagine Canada
  observes that a focus on overhead is an indication that the nonprofit sector is not
  well understood and that evaluation of the sector is based on the wrong metrics.

  December 2016 Money Sense Magazine reported that Bigger doesn’t mean
  better. “Smaller charities are particularly good at keeping costs down and
  directing funds to the cause. While a quarter or the 100 largest charities in
  Canada earned an A for charity efficiency this year, we give top arks to nearly
  half of the smaller organizations in this category.”

  Lawyer Alexandra Tzannidakis says, “Spending money on a solid administrative
  structure can be vital to the success of a charity’s efforts. Indeed, the demonization
  of overhead costs has led to a situation where many charities are really under-
  spending in that area and doing themselves, their beneficiaries, and their donors a
  disservice in the process.”]

  From the article; Measuring impact, not administration: A primer on Charity
  overhead by Sarah Fish, February 10, 2016

  Lawyer Mark Blumberg defines overhead as "the ongoing expenses of a charity that
  cannot be directly attributed to any specific charitable activity, but may still be
  necessary for the charity to function.” Blumberg agrees. “Some charities may be
  able to have overhead of 10%-15%, but many will quite legitimately have higher
  overhead expenses, including administration and fundraising, more likely in the
  range of 20%-35%. You need to look closely at the individual charity, how it is
  operating and what it is spending money on. It may be that a charity with 20%

                                                                                           2
overhead should be spending 25% while another charity with 15% overhead
probably should be at 10%.”

A further opportunity that faces the United Way of Sarnia-Lambton, is multiple
streams of revenue opportunities. No longer just the campaign and campaign
revenue, but Future Fund revenue, stocks, equities donations, memorial gifts,
dividend income, even revenue positive back office support has helped enable the
United Way of Sarnia-Lambton to cut cost percentages even more and become more
diversified in its “investments” etc. The United Way of Sarnia-Lambton now has
multiple revenue streams.

          United Way of Sarnia-Lambton philosophy:

 High Impact, and Low Cost can co-exist for sustainability
                    and growth.

                                                                               3
Introduction

The United Way of Sarnia-Lambton has had updated Long Range Strategic Plans
since the mid 1990’s starting with the publication of Building for our Future in
April 1995. The most recent of our Long Range Plans, Fifty More Years, was
published in 2007 and is currently available on the United Way of Sarnia-Lambton
website; www.theunitedway.on.ca. The Long Range Plan, Fifty More Years was
published in recognition of the 50th anniversary of our founding in 1957 in Sarnia,
when we were known as the Sarnia Community Chest.

The current recession has been a challenge for United Ways throughout North
America and the United Way of Sarnia-Lambton is no exception. Like other United
Ways, we have lost donors and struggled to achieve our goals. Fortunately, the
United Way of Sarnia-Lambton has reached its financial targets and has achieved
increases over the past several years.

It will come as no surprise how the environment and society as a whole has
changed; aging population, low oil prices, low interest rates, increasing roles of
women, weather disasters that are becoming closer to home are examples of change
that is affecting United Ways, including the way in which United Way of Sarnia-
Lambton operates. Technology continues to change the way we do business which
has enabled great cost efficiency to those who have used it properly and creatively;
social marketing has changed the way we recruit, publicize and the way we share
ideas. The changes in media have changed the way we work with our media
partners.

To be clear, technology is a tool; fundraising is still very much an old school
process; a face to face activity.

                                                                                      4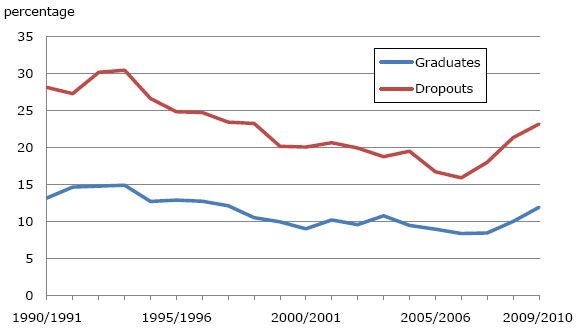
In addition, with increasing competition for fundraising, volunteer recruitment,
decreasing bingo revenues, government cutbacks, etc., organizations like the United
Way have had to be both creative in their operations and efficiencies, while at the
same time, be more effective in using contributed money for a better community; to
put it a different way, High Impact. The aging population has also added new
dynamics to the way we operate and allocate funds, particularly in Sarnia-Lambton,
as well as the increasing role women are having in both our society and in charitable
giving.

                                                                                   5
Threats
Aging population. In Lambton, the average tax filer is five years older than
the average Canadian and Ontario tax filer. As workers retire, it is more
difficult to reach them to solicit donations. 17% of people living in Lambton
County are over the age of 65 and this number is expected to increase to 28%
by 2017.
Decreasing donors. Increasing churn; not just in Sarnia-Lambton, but
throughout North America.
Decreasing Industrial base. Companies leaving, reducing their workforce,
or closing have had an effect on the annual campaign, and on the services
that is funded. The source of 70% of United Way of Sarnia-Lambton
campaign revenue is industry based.
More competition from other charities, plus businesses for disposable
income . Increasing hydro rates, taxes, user fees etc.
Decreasing bingo revenues.
Shortage of Loaned Representatives. United Way of Sarnia-Lambton went
from a high of five in 1985 to one in each of the past two years.
Traditional media changing. Newspapers are now providing video; radio
stations providing text and photos; both with no firm deadlines; all media
providing 24/7 media coverage. The vast majority of our traditional donors
still get their news from traditional sources; with growing dependency on
Social Media.
Low oil prices. Have had an effect on our unemployment rate locally,
corporate profits among three of our four largest corporate donors, and
share prices, therefore investments of many of our Leaders of the Way and
retiree donors. Resulting Unemployment rate according to the Sarnia-
Lambton workforce development Board is 10.8%; higher than our Economic
Region ( which is 8.6%), and both Chatham Kent (8.0%), and Windsor Essex
at (8.0%).
Low interest rate environment. Effects our interest revenue from
campaign dollars which is invested exclusively in GICs.
JA
N
Sarnia Lambton 10.8
Chatham-Kent 9.0
Windsor Essex 8.0
6
Economic Region 570          8.6

   Current Indicators
            2016 Unemployment Rate (%)

                                         7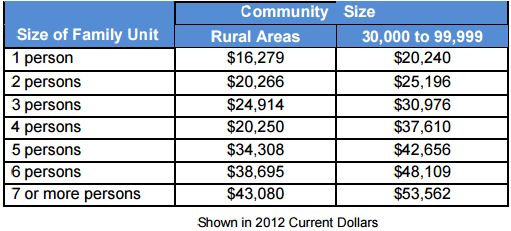
Opportunities
Cost cutting; thereby increasing efficiency and contributing to maximize
return on investment.
Technology; for cost cutting, revenue generation and community investment.
Increasing willingness for partnerships among many community groups.
New media and working on new opportunities with what we know as
traditional media.
Increasing number of Leadership Donors.
CRM; that is Customer Relationship Management.
Further development of the Leaders of the Way Program.
Various sectors of the campaign.
Partnership/Memorandum of Understanding with United Way Worldwide;
tapping into those resources.
Growth in the Future Fund capital.
Expected transition of wealth from one generation to another.
Positive tax rules that encourages the donation of appreciated equities and
other assets.
8Total Values in Donated Equities Year over Year
$90,000
$80,000
$70,000
$60,000
$50,000
$40,000
$30,000
$20,000
$10,000
$0
2012 - 2016
Strengths
Staff; Low turnover rate has resulted in capability of our staff and board.
Note: in 2015, the average donation value of each “Stock” Donor was $2,082.44
Our staff have accentually become part of our brand; studies show donors
are increasingly becoming concerned about turnover rates. (It was recently
announced that the average length of time a Fundraiser stays with an
organization is 1.6 years; down from 1.8 just a few years ago. (Canada Helps)
Board of Directors. Low turnover rate of a well diverse, high profile Board of
Directors.
Supportive Board of Directors with a variety of backgrounds; much younger
than many other not for profit Boards. More than 50% of our volunteer
Board of Directors are women in 2016 and an even greater percentage in
2017.
Reputation of both our organization and our people
Financial stability.
Multiple streams of income.
Experience with measurable outcomes.
Learned a great deal from our local economics of the mid 1990s.
Diverse support base.
Growth in Leadership donors .
United Way of Sarnia-Lambton is generally regarded as an innovator in our
community.
Positive working relationship with our media partners.
Caring supportive community.
9 A Sarnia-Lambton strength shows that the percentage of tax filers from
Sarnia and towns within Lambton County are continuing to be better than
both the provincial and federal averages.
Our success in soliciting and receiving gifts of stocks and corporate shares.
10Percent of Taxfilers who report Charitable Donations on
Income Tax Returns
40
35
Canada
Ontario
Percent (%)
30
Sarnia
Corunna
25 Forest
Petrolia
20 Watford
15
Years 2004 - 2014
In the chart above, you will note that a higher percentage of Lambton County
taxfilers report making charitable donations on their annual tax returns than the
Canadian and Provincial averages, but all locations have a decline percentage over
the 10 year period. This is no surprise and we have been talking about it for some
time. Fewer donors raising more money is not only an issue for the United Way of
Sarnia-Lambton, but it is also a challenge for all not for profit organizations across
North America.
Population growth; Released February 8, 2017
New census data shows the population of Sarnia fell below the national growth rate
over the last five years.
Statistics Canada released the first batch of numbers from the 2016 census on
Wednesday and the population of Sarnia decreased by 1.1 per cent since the last census
in 2011.
The city’s growth rate was below the national growth rate of 5.0 per cent, while the
population of Ontario increased by 4.6 per cent.
When the 2016 census was taken last May, the population of Sarnia was 71,594,
compared with 72,366 from the 2011 census.
Canada’s population on census day was 35,151,728, Statistics Canada reported.
The national census is conducted every five years. This information published is the first
of several releases of data to come from Statistics Canada over the next year that will
11eventually paint a detailed picture of the country, right down to the local level -
including age breakdowns of the population, family makeup, languages spoken,
immigration and ethnic origin, the level of education attained and income earned.
Future census releases will give more insight to explain the reasons behind the
population changes - whether it’s related mostly to changes in birth and death rates,
immigration or interprovincial migration.
Ontario is still the country’s most populous province, with a population of 13,448,494.
The population of other provinces and territories: Quebec, 8,164,361; British Columbia,
4,648,055; Alberta, 4,067,175; Manitoba, 1,278,365; Saskatchewan, 1,098,352; New
Brunswick, 923,598; New Brunswick, 747,101; Newfoundland and Labrador, 519,716;
Prince Edward Island, 142,907; Northwest Territories, 41,786; Nunavut, 35,944 and
Yukon, 35,874.
Here is a local breakdown of census population information for communities in the
Sarnia region:
Community 2016 2011 % change
Sarnia 71,594 72,366 -1.1
St. Clair 14,086 14,515 -3.0
Dawn-Euphemia 1,967 2,049 -4.0
Brooke-Alvinston 2,411 2,548 -5.4
Enniskillen 2,796 2,930 -4.6
Oil Springs 648 704 -8.0
Petrolia 5,742 5,528 3.9
Point Edward 2,037 2,034 0.1
Plympton-Wyoming 7,795 7,576 2.9
Lambton Shores 10,631 10,656 -0.2
Kettle Point 1,011 936 8.0
Warwick 3,692 3,717 -0.7
12Weaknesses
Not all funded agencies yet see the value in promoting their United Way
funding; however, this is improving. Many do not understand that what is
good for United Way is good for them. They tend to see United Way as
fundraising competition and having too many rules. It is a challenge getting
some agencies to fulfill the commitments of the contracts we sign with them
and their board, despite numerous efforts such as providing staff training
materials, signature of contracts by both EDs and Board Presidents, etc.
Concern, like elsewhere with the decreasing number of donors
Levels of participation (percentage of taxfilers who claim charitable
donations on their tax returns) in Lambton County as well as the rest of the
province and country continue to decline over the years.
13Main competitors
Since the United Way of Sarnia-Lambton is not a national organization that raises
funds Canada wide, it may be more accurate to look at our major competitors
locally. Perhaps the most effective and accurate method of looking at our
competitors is to look at the Donor Option results from our most recent campaign.
It is difficult to define exactly who our largest “competitors” are for fundraising
revenue; however, based on the Donor Option results from the 2010 and 2015
Campaigns, the total money that was directed to specific agencies from Lambton
County donors may be one reasonable measure of who our primary campaign
competitors might be.
In terms of total dollars donated, our main competitors in Lambton are church
groups and other religious organizations. Below is a specific list in order of the
number of donors designating to other charities through the United Way Donor
Option program.
2010 Campaign
1. Grace United Church
2. St. Joseph’s Hospice
3. Salvation Army (Funded Agency)
4. Women’s Interval Home (Funded Agency)
5. Canadian Mental Health Assoc.(Funded Agency)
6. Lambton Elderly Outreach (Funded Agency)
7. Canadian Cancer Society
8. Sarnia Lighthouse Community Church
9. Sarnia and District Association for Community Living (Funded Agency)
10.Sarnia Humane Society
11.Victorian Order of Nurses (Funded Agency)
12.YMCA (Funded Agency)
13.Inn of the Good Shepherd
14.Sarnia Lambton Rebound (Funded Agency)
15.Big Brothers (Funded Agency)
16.Big Sisters (Funded Agency)
17.Stroke Recovery (Funded Agency)
18.Canadian Red Cross (Funded Agency)
19.Huron House Boys Home
20.Redeemer Lutheran Church
[12 are funded agencies; 3 are places of worship plus Salvation Army]
142015 Campaign
1. Temple Baptist Church
2. Christ Lutheran Church
3. Grace United Church
4. St. Joseph’s Hospice
5. Sarnia Lighthouse Community Church
6. Inn of the Good Shepherd
7. Salvation Army (Funded Agency)
8. Women’s Interval Home
9. Canadian Mental Health Association (Funded Agency)
10.Sarnia and District Humane Society
11.Forward City Church Inc.
12.International Symphony Orchestra
13.Canadian Red Cross, Sarnia-Lambton Branch (Funded Agency)
14.Sarnia-Lambton Rebound (Funded Agency)
15.Redeemer Lutheran Church
16.Rayjon Share Care of Sarnia Inc.
17.Big Brothers Big Sisters (Funded Agency)
18.Multiple Sclerosis Soc. Of Sarnia-Lambton (Funded Agency)
19.Family Counseling Centre (Funded Agency)
20.Lambton Elderly Outreach (Funded Agency)
[8 are funded agencies; 6 are places of worship plus Salvation Army]
What is interesting to note is that both the Canadian Cancer Society and
the Stroke Recovery Association (Now known as ABI, New Beginnings,
Stroke Recovery), have dropped out of the top 20 list and both have
merged with neighbouring branches.
15 Goals:
Growth in terms of greater community impact.
To invest the maximum amount if money possible in quality community
programs and services with a measurable return on investment; promote
those successes, and increase market share (See agenda below and following
pages) 100% of announced Campaign achievement to be invested in local
community programs and services annually.
Increase the number of funded programs and other strategic partnerships
Campaign growth
Decreasing costs thereby increasing impact of donated dollars
Increase number of donors; reverse the trend
Specifically, raise more money and other resources
Grow the Future Fund
Continue with current and additional streams of income
Increase returns on investment for both the Future Fund, and campaign
interest revenues
Community Impact Agenda
Healthy, Resilient, Successful Kids
Key Elements:
School Readiness/Low Absenteeism
Nutrition
High School Readiness
Criminal Involvement
Community Indicators:
Secondary School Graduation Rates
Youth Criminal Rates
16Healthy, Safe and Independent Seniors
Key Elements:
• Home Safety & Fall Prevention
• Nutrition
• Health
• Social Interaction
Community Indicators:
• Seniors aged 90+ living at home
• Hospital visits for fall injuries
Empowering and Strengthening Self Sustaining Families
Key Elements:
• Reduced Crime
• Financial Health
• Mental Health
Community Indicators:
• Reduced time on Social Assistance
• Adult Crime Rates
17Sarnia-Lambton Taxfilers
Taxfilers in Sarnia-Lambton are more generous in terms of their charitable giving.
These figures report only donations that are eligible for Tax Credits with CRA and do
not include contributions to non-registered not for profits, or support of special
fundraising events and lotteries.
18The current environment - the road travelled
The United Way of Sarnia-Lambton has been fortunate to not only have reached its
campaign goals in the past several years, but to have annual year over year growth.
That has not been the case for many United Ways in Canada and in Michigan. The
United Way of Sarnia-Lambton has obtained this growth during periods of the
declining workplace within the United Way of Sarnia-Lambton’s core areas of
support.
1920 year Campaign Acheivement;
NOT counting Donor Option to outside agencies
$2,500,000.00
$2,000,000.00
$1,500,000.00
$1,000,000.00
$500,000.00
$0.00
The local demographics
The Sarnia Lambton Workforce Development Board (SLWDB) reports that in 2011, 22%
of the Lambton workforce is over the age of 55 and 13,600 current workers will be above
retirement age (60 years) by 2016. They also report that the greatest potential attrition
will occur in senior management occupations, health professionals, and skilled
occupations in primary industries.
SLWDB reports that the majority of jobs held in Lambton are in health care and social
assistance (13%), followed by manufacturing at 12%, retail trade at 12%, accommodation
and food services at 8% and education at 6%. While not reported in financial terms,
agriculture is a huge part of our economy and boasts 2,153 farms.
Between 1996 and 2011, the population of Sarnia-Lambton grew by 6%. For the same
period, the population of Ontario is 20% higher. Several factors have slowed the
population growth including our aging population, younger adults seeking education and
employment opportunities elsewhere and a reported difficulty attracting and retaining
highly skilled immigrants.
It likely is not a surprise to learn that long-term data shows that employment growth in
Sarnia-Lambton has been substantially slower than Ontario during the past 20
years. SLWDB reports that most job growth in Sarnia-Lambton has been in health care,
retail trade, finance, insurance, and engineering.
2021
Bingos in Sarnia-Lambton

Bingo revenues have fallen off over the years, but has shown a recovery in the past
18 months. There were seven bingo halls in Sarnia and one in Petrolia, the United
Way and its funded agencies were raising huge sums of money from Bingos. In
1987, the United Way of Sarnia-Lambton held a provincial record for raising the
most money in a single bingo game. In that year, the United Way of Sarnia-Lambton
ran a $10,000 bingo and generated more than $25,000 from a single event. In 2010,
the United Way of Sarnia-Lambton’s annual take was less than $4,000. It is
projected in 2016, the United Way of Sarnia-Lambton’s share of bingo and other
associated gaming revenues at Jackpot City, (formerly known as Bingo Country), will
be $8,500.

                                                    Bingo Revenues

                                        Total Bingo Revenues by Year
                          $50,000
   total dollars raised

                          $40,000
                          $30,000
                          $20,000
                          $10,000
                              $0
                                    1   2   3   4    5   6   7   8   9     10   11   12   13   14   15   16   17
                                                             2001 - 2015

Now, just one Bingo Hall exists in Lambton and many local not for profit
organizations are sharing a decreasing amount of revenue. The United Way must
make a decision as to whether or not to continue its involvement with running
bingos.

                                                                                                               22
2001 Campaign
2.12%
97.88%
232015 Campaign
0.32%
99.68%
Note: in 2016, $10,855 was raised by bingos; representing .54% of the
annual campaign
Future Fund
United Way of Sarnia-Lambton has for all intents and purposes completed the
rebranding of the Future Fund and it has continued to grow. Now is the time to
promote the fund to both potential donors, and to allied professionals who may
have paid up premiums of Life Insurance policies that are not likely needed any
more. The tax advantages to these Life Insurance Donors are one of three; either the
premiums are tax deducted; the death benefit is tax deductible for the estate, OR the
policy itself is donated and a tax receipt is given to the donor for cash surrender
value. These insurance donations are irrevocable, unlike wills that are the simplest
and more common.
In addition to the rebranding of what was formerly known as the Wes Thompson
Endowment Fund, the Future Fund is now professionally managed and will be
measured and evaluated based on other similar endowment type funds both locally
and provincially. Similarly, we will review and make changes to our Investment
Policy on a regular basis; perform annual return comparisons, as well as other
endowment investment policies.
24Currently, we have the most amount of donors to Charities in Canada, who have the
least amount of kids; ie: less people to inherit.
90% of Planned Gifts are bequests; whereby donors give part of their assets to
charity. A key component in the previous plans was the need to grow the Wes
Thompson Endowment Fund, now rebranded as the United Way Future Fund. A
plan, called Vision 20/20 was developed. Its goal was to raise both the capital in the
Wes Thompson Fund, and its interest revenues to a point where its annual interest
revenues could fund the United Way campaign and administration costs. This
would result in 100% of donors’ money being invested into programs and services.
Total number of donors making donations of stock each year
2516
14
12
10
8
6
4
2
0
While the Vision 20/20 progress is behind schedule, its annual contribution to the
United Way revenue stream is noteworthy.
In 2015, $65,000 in Future Fund revenue was used directly for agency funding. This
$65K represented our 6th largest “contributor” after Imperial, Shell Canada, NOVA
Chemicals, Suncor Energy, and Lanxess, (in 2016 known as ARLANXEO). This
revenue costs no campaign expenses, and will never leave.
Previous United Way of Sarnia-Lambton boards have considered more aggressive
investment options for the Wes Thompson Fund to increase revenues. Each time, it
was agreed that both protection of the capital as well as consistency of the revenue
are most vital. Regardless, as seen on the chart below, the Fund has continued to
grow over the years.
26United Way Future Fund, formerly known as the
Wes Thompson Endowment Fund
Future Fund
$2,500,000.00
$2,000,000.00
$1,500,000.00
$1,000,000.00
$500,000.00
$-
98 99 00 01 02 03 04 05 06 07 08 09 10 11 12 13 14 15 16
19 19 20 20 20 20 20 20 20 20 20 20 20 20 20 20 20 20 20
27Future Fund Rates of Return
6.00%
5.00%
4.00%
3.00%
2.00%
1.00%
0.00%
199819992000200120022003200420052006200720082009201020112012201320142015
Years
The above chart shows the rates of returns from the Wes Thompson/Future Fund
capital investments each year.
In 2013, the United Way of Sarnia-Lambton accepted the recommendations from the
Finance and Audit Committee and approved TD Wealth Management to
professionally manage the Future Fund. A Policy statement was drafted after
hearing proposals from five different tenders including the Sarnia Community
Foundation. Since joining the Canadian Association of Gift Planners, we are now in a
position to better analyze best practices and other rates of return with other not for
profits with endowment like funds.
282016 Budget – United Way of Sarnia-Lambton
Over the years, the United Way of Sarnia-Lambton has made technology
investments to aid in the effectiveness and efficiencies in our operations. As always,
the United Way of Sarnia-Lambton is committed to exploring other options to keep
its internal costs as low as possible while not at the expense of the annual campaign
and other operations.
2016 United Way Budget
7%
United Way direct services
and related admin costs
14%
Campaign and
related admin
costs
Available for Agency
Investment and
79%
Donor Option
recipients
29Our Strategic Direction The Road Ahead
In terms of technology, it has become a game changer in attempts to keep costs
down and improve efficiency and effectiveness in so many ways; however,
fundraising is still very much an old school discipline. The art of the phone call is
not to be lost. Telephones are still to be used to set up appointments, including
younger donors. Handwritten notes, thanks you letters, and one to one contact is
vital. People give to people, not to faceless organizations. High tech can not replace
high touch; especially on the shop floor within the manufacturing sector.
Presentations, story telling and face to face fundraising will always be key in the
foreseeable future in Sarnia-Lambton. Personal thank you calls, notes and letters
need to be continued and expanded.
Canada Helps has some encouraging news relative to online donations and they do
not play a vital role in the overall campaign picture; however, it is clear that having
the option is vital to the United Way.
Paul Nazarith, Vice President, Community Engagement for Canada Helps:
Very few charities do social media and digital well; therefore we can have an
advantage here
Need for policy/strategy
Objective is to drive social media visitors to your webpage
More and more donors are texting; some have successfully had a campaign;
Have Questions? Text us.
$10B donated last year in Canada through Peer to Peer donations; $300B in
USA
Canada Helps; $100M annually goes to 16,000 charities in Canada
25% of donations last year were with Mobile Devices; $427M
400 charities using such tools from Canada Helps as Ticket Add-ons
10% of Online Donations made through Canada Helps were made between
December 28th and December 31st $13,000. Overall, over $1B was donated
each day during those three days.
There is evidence that this might change. In other parts of the world, online
fundraising represents a greater percentage of campaigns and we are seeing more
mobile or text donations. Text donations for world disasters have been effective,
but also been expensive for local United Ways to set up. Text donations tend to be in
low amounts; less than $25; counter to the growth of leadership donors we are
seeing.
Text giving might also be a convenient and attractive method for younger donors to
contribute. After the January 2010 earthquake in Haiti, the American Red Cross
began raising money via text message whereby cell phone owners would donate
30$10 by texting on their phone. By August 2010, three million people had donated
over $32 Million. What is important is that 95% of these donors where first time
donors.
Much has been written in the past about the increasing sales of Ipads, smart phones
and other mobile devices. Google recently announced that for every baby born in
the world, 10 smart phones are sold. However, we have abandoned our United Way
of Sarnia-Lambton App. Instead, on the advice of local experts, we have ensured
that our Websites are of “Responsive” technology and look as good or better on any
mobile device as on a PC or IMac. In fact, Google has already started to “penalize”
those web sites that are not built on a responsive technology platform.
As we have travelled down the path of Outcome Measurement, our Funded Agencies
are now in a position to better measure not only their individual program outcomes
but how these individual outcomes relate to the larger community benefit. The next
step in the process will be to get a community snapshot of where we are now related
to our 3 Impact Areas, and in particular the key indicators in each of the 3 areas.
This benchmark data along with any historic data available will then be used by
United Way to gauge and measure the effectiveness of our funded programs at the
community level. This information will be reviewed on an annual basis and will
determine if any changes to our current investment portfolio are needed.
The United Way of Sarnia-Lambton has now been measuring program outcomes for
10+ years. Some of our funded programs do a good job at outcome measurement
and some not so good. We continue to strive to have all our funded programs at the
same level in the outcome measurement process. In order to do this we need to
provide continual training for new staff and refreshers for all staff as required.
There is a strong need to track outcomes for both allocation and marketing
purposes. This has been well documented earlier in this Long Range Plan. Donors
demand to know where their dollars are going and what difference it is making to
our community.
31Community Impact Plan
The United Way of Sarnia-Lambton embarked on the Community Impact Model of
funding many years ago. We are now at the stage of having a developed Community
Impact Plan. This plan has identified key elements and community indicators that
will be key to understanding both the community’s success, areas that still need
improvement and changes to future plans to best service our individual community.
By conducting a series of community round tables with both current funded
agencies and other service providers, front line workers and stakeholders in the
community, key elements and measureable community indicators have been
identified for each impact area. Going forward the United Way of Sarnia-Lambton
will collect and analyze local data as it pertains to the Community Indicators. Any
recommended changes to the current Community Impact Plan will be brought to the
United Way Board of Directors by the United Way Community Investment
Committee.
Impact Area: Healthy, Resilient, Successful Kids
According to a paper by U of T Mississauga economics professor Philip
Oreopoulos, the paper reveals an average dropout earns less money, is more likely
to spend time in jail, and is less healthy, less happy and less likely to be married than
a high school graduate.
Unemployment rates for high school graduates vs dropouts – Stats Canada
Even though dropout rates are much lower than they were 20 years ago, both across
the provinces and for both men and women, there are still concerns about the
32labour market impacts of dropping out before completing high school. About one in
four dropouts aged 20 to 24 who were in the labour market in 2009-2010 were
unable to find jobs–a situation that worsened with the recent economic downturn.
Even among those who did find work, their earnings were less than those with a
high school diploma, regardless of whether they worked in the public or private
sector.
The Canadian Council on Learning estimates that high-school dropouts cost
taxpayers $1.3-billion in social assistance and criminal justice expenses each year.
HEALTHY, RESILIENT, SUCCESSFUL KIDS IN SARNIA-
LAMBTON
Key Elements
School Readiness/Low Absenteeism
Nutrition
High School Readiness
Criminal Involvement
Measurable Community Indicators
Increased Secondary School Graduation Rates
Reduced Youth Crime Rates
Impact Area: Empowering & Strengthening Self Sustaining Families
Low income cut-offs (LICOs) are published by Statistics Canada annually. They are
intended to convey the income level at which a family may be in strained
circumstances because it has to spend a greater portion of its income on the basics
of food, clothing and shelter than an average family of similar size. The LICOs vary
by family size and by size of community.
33While the LICOs are not accepted as a measure of poverty, they identify those whose
income is worse off than the average. In the absence of an accepted definition of
poverty, these statistics have been used by many analysts who wanted to study the
characteristics of the relatively worse off families in Canada. (County of Lambton
Housing and Homelessness Plan)
Low Income Cut Offs (1992 Base) Before Tax as posted by Stats Canada;
Increases in expenditures on food, clothing and shelter outpaced the rate of inflation
and salary increases. These factors impact the affordabiity of shelter. Increase in
the use of local rent-utility banks, food banks and soup kitchens support the claim
that housing is becoming less affordable for some Lambton County residents.
(County of Lambton Housing and Homelessnsess Plan)
Food, Clothing and Shelter Expenditures and Percentage Change
for Each Expenditure – 2002, 2005 and 2010, Sarnia, ON
The above indicates the average expenditure on food, clothing and shelter for 2002,
2005 and 2010 indicating significant increases in expenditures that impact housing
affordability.
34Empowering & Strengthening Self Sustaining Families
Key Elements
Reduced Crime
Financial Health
Mental Health
Measurable Community Indicators
Reduced Time on Social Assistance
Adult Crime Rates
Impact Area: Healthy, Safe & Independent Seniors
Stats Canada 2011 Census shows the following;
From 2006 to 2001 the population change for Ontario is +5.7% yet for
Lambton County it is – 1.6%
The population aged 55 and over in Ontario is 1,622,240 Males (13%) and
1,886,355 Females (15%) vs Lambton County with 20,090 Males (16%) and
22,960 Females (19%)
The median age of tax filers in Lambton County is 4.5 years older than the
Ontario average
Lambton County has 4% fewer single people and 2% more widows than the
Ontario average
Lambton County has 4% more persons aged 65 and over living in private
households
Canada is facing unprecedented demographic change, particularly in the area of
population aging. According to statistics on the anticipated changes in Canada’s
population, the number of people aged 65 or more could double in the next 20 years
(see Figure 1).
35Governments at all levels will face significant challenges as a result. In fact, the socio
economic impact of an aging population will play a major role in the decisions
governments will make in the coming years.
Economic impacts
Over the next 50 years, the increasing proportion of seniors will have a tremendous
impact on Canada’s economic growth and, consequently, on federal finances. The
business sector will not be spared either: some of the challenges it will face include
an aging workforce, an impending labour shortage and increased competition for
skilled workers.
The baby boomers’ financial readiness for retirement is also being questioned.
Although this generation seems generally well prepared financially, middle- and
high-income earners are having more difficulty achieving an acceptable income
replacement rate (70%). This rate represents the ratio between workers’ income
after retirement and their income at the end of their careers, when employment
earnings are usually at their highest. This is why some experts are calling for
changes to public pension plans and savings incentives.
An aging population may also lead to higher public health care spending, a factor
that will combine with other pressures on the health care system, such as inflation,
new technologies and the “income effect” (the fact that health care demands
increase with income). However, many economists assert that, assuming reasonable
economic growth, governments should be able to properly manage the aging
population’s financial impact on health care.
There is strong anecdotal evidence that a high number of our seniors do not have
adult children living in the Sarnia-Lambton area to provide care to their aging
parents.
Social impacts
Decisions on community infrastructure – such as housing, transportation, outdoor
spaces and building accessibility – have a significant impact on the quality of life of
Canada’s seniors. Canada is an active participant in the “age-friendly cities” initiative
launched by the World Health Organization and is a leader in implementing
guidelines for developing cities and communities that focus on seniors’ well-being.
Several local initiatives are under way in the provinces and territories to offer
seniors a healthy, welcoming and more accessible environment.
That said, since people suffering from chronic illnesses are the most frequent – and
most expensive – users of the public health care system, and because their numbers
increase with age, there will be a need to rethink how we care for them and
probably to establish a wider range of home health and social services. In addition,
36provincial and federal governments will have to make certain adjustments in the
near future to better support caregivers.
Healthy, Safe & Independent Seniors
Key Elements
Home Safety & Fall Prevention
Nutrition
Health
Social Interaction
Measurable Community Indicators
Seniors aged 90+ living at home
Hospital Visits for Fall Injuries
The recently completed Long Form Census will provide meaningful information in
Sarnia-Lambton that is sure to aid the United Way of Sarnia-Lambton in its future
Community Impact decisions. It is important that the United Way of Sarnia-
Lambton seriously consider purchasing additional information that will allow us to
make more informed and justified decisions. This will also aid in the campaign
during strategy sessions.
---------------------------------------------------
Going forward, the United Way recognizes the need for
more Mental Health Funding.
Presently, the United Way of Sarnia-Lambton Mental Health Funding,
including Suicide Prevention, is shown under Sustainable Families impact
area.
Canadian Mental Health Association: $59,985 (including a new Suicide
Prevention program)
Family Counselling Centre: $227,339
37 Opening Doors, offered through the North Lambton Community Health
Centre: $30,000
St. Clair Child and Youth: $48,500
Total Mental Health and Counselling: $365,824
Mental Health 101
• The demand for mental health services continues to grow.
• In 2015/16, CMHA saw an increase in overall demand of
19.6% over the prior year (across Lambton Kent).
• The rate of change in demand growth also appears to be
increasing.
FIRST RESPONSE CLIENTS
SERVED
380 378
400
342
# OF CLIENTS SERVED
350
300
243
250 227
197
200
150
100
50
0
October November December
2015 2016
6
According to Alan Stevenson, CEO of the Canadian Mental Health Association
Lambton Kent, “on average our rate of growth as measured by people served
(Lambton Kent) has increased by 12% year over year over the past 5 years…60% in
5 years, and last fiscal the growth was 19.6% over the prior year. Note as well the
“first response clients served” data on slide 6 is only Sarnia/Lambton, growth in
demand over 40% in 1 year. Although it is just a 3month snapshot it is indicative of
the trend.“ Stevenson added, “The complexity of need is increasing as well, we are
frankly overwhelmed by the demand here in Sarnia, and I know you have seen in the
press recently demands placed on our hospital.
According to the Canadian Mental Health Association, Lambton Kent:
38• One in five Canadians will experience a mental health issue within their
lifetime. Currently, more than 6.7 million Canadians are living with a mental
health condition in Canada.
• More than one million Canadians aged 9 to 19 were living with mental illness
in 2011; almost 1 in 4 youth.
• In 2006 it was estimated that only about 1/3 of adults (1/4 of children) with
mental illness will seek treatment, but recent increased demand for services
indicates that this is no longer true.
• The burden of mental illnesses and addictions in Ontario is more than 1.5
times the burden of all cancers and seven times the burden of all infectious
diseases.
• Suicide and mental health are closely connected; it is estimated that 90 per
cent of people who die by suicide (4,000 annually) experienced a mental
health problem.
• Mental illnesses have been associated with a reduced life expectancy as great
as that associated with smoking 20 or more cigarettes a day.
• Mental health conditions occur across the life span, regardless of gender, race
or sexual orientation. However, disadvantaged or marginalized groups are at
higher risk for mental illness and will experience poorer access to needed
care.
• It has been estimated that mental illness costs the Canadian economy $50B
annually. This cost is projected to increase, with projections as high as
$300B by 2041.
• Mental health is the “poor cousin of the healthcare system”; in Canada
spending on mental health is 7.2% of total healthcare spending; whereas
more progressive countries such as United Kingdom and Sweden spend more
than 9%, Australia and New Zealand spend close to 14%.
Observation:
While our local population shrinks, our demographics continues to age at a
quick rate, and needs for services for the elderly, and those with Mental
Health conditions continues to grow. It is our youth population that is
declining and more funding is required from the Youth Services, to those for
the senior’s population and Mental Health Services.
39RECOMMENDATIONS SUMMARY based on our previous Strategic
plan and our accomplishments
Continue to increase the Wes Thompson Income to at least maintain the
percent level of the campaign and administration costs at 2011 levels (14.1
%) for each of the next three years. This may include increasing the
principal; increase the investment returns; and keep campaign and
administrations costs in check (Calculated by dividing the Wes Thompson
Interest earned by the Campaign and Administration as shown in each year’s
Annual Report)rebranded; 3.5% directly to agency funding; not
administration.
Continue to explore alternate revenues to offset the loss of $50,000 from
Dow Corporate completed, and in fact campaign totals have grown.
Develop solid plans for CRM Future Fund activities by the end of first quarter
2012 in an effort to decrease donor churn rates and maintain existing
donors. Evernote; inexpensive and effective at this point for Dave’s personal
and confidential record keeping.
Add to the list of Special Gifts Prospect List, (largely retirees) by 2% each
year. Completed.
Increase the number of personal emails to a minimum of 500 home
addresses by January 1, 2012, and send a minimum of one email to each over
the next 12 months. 627 email addresses, 546 home telephone numbers; we
do not yet have a plan as to what to do with this data, but a least we have it so
when a “best practices” is developed, we have a database of contacts.
Develop a low cost Social Media strategy by June 1, 2011 which will include
regular updates and fresh information. Facebook followers, Twitter 1300
followers, and LinkedIn is becoming more effective, and now is the time to
document a strategy.
Develop by the end of the second quarter an
IPhone/IPad/Blackberry/Android App that will allow mobile donations and
inform and engage donors. To boast 100 downloads of the app by December
31, 2011, and that the revenue generated cover the initial costs within a
three year period Completed, however not as effective as hoped; instead,
trend is to have websites responsive. Both websites are so can be viewed on
any mobile device.
Currently, there are opportunities to co-fund or work with other
organizations to provide resources to agencies in their efforts to provide
services. As a result, we need to refer to Funded Agencies what they are;
Funded Agencies thereby giving the opportunity to recruit co-funding
agencies and organizations the true “Partner” name. Completed.
Continue to drive down our costs to help maximize investor returns.
Fundraising and Administration costs are budgeted to be less than 12% for
fundraising and fundraising related administration and less than 7% for
Community Investment and Community Investment related administration
40Completed; however, since we rebranded the Future Fund, we calculate the
expense ration differently.
Perform a complete review by December 31, 2011 and recommend whether
or not to continue with bingos beyond 2011 for Board Approval for January
2012 Completed; bingos are increasing their revenues.
Recruit more “partners” to co-fund or co-provide programs and services in
each of the next three years LHINs.
Develop a culture of continuous improvement with the Funded Agencies
which are likely to include groups meetings with “like” agencies and
individually to maximize investor returns. Completed.
Research further the concept of “Cloud computing” beyond what is currently
in place with the objective of increasing both efficiency and cost effectiveness
in a measurable, quantitative way. At this point, too expensive but we are
doing some of it; Evernote, Community Force, MS 365, etc.
Survey other United Ways in North America, funded agencies, and other like
organizations as to their uses of technology and to increase our effectiveness
and efficiencies and make the appropriate changes to the United Way of
Sarnia-Lambton operations. We are ahead of the curve
Expand our participation with our traditional media partners taking
advantage of the new opportunities that technology provides, as well as
expand partnership opportunities with emerging New Media. Completed.
Develop an exit strategy for the Drug and Alcohol strategy prior to the end of
the first quarter of 2012. Completed.
Develop a comprehensive Risk Management Strategy at the United Way of
Sarnia-Lambton beginning with our community wide risk Management
Workshop on March 11, 2011, to be completed by the end of the first quarter
of 2012 and review what has already been competed for Bill 186 in June
2010 Still needs to be done, and will be apart of the new plan
recommendations.
Develop a further strategy to retain existing donors and decrease churn with
a concentrated effort on those donors as they transition from work to
retirement to begin implementation September 1, 2011. We know current
donors give more than new donors Thank yous has and will continue to
help.
Develop a secondary strategy to recruit new retiree donors to be
implemented for 2011 campaign. More work needs to be done and is part of
the new plan recommendations.
Develop a further strategy to recruit young donors to be implemented, for
campaign 2011. More needs to be done and is part of the social media
strategy.
Develop a performance scorecard for all funded programs to be completed
by end of first quarter of 2012. Completed. Community Force software;
United Way of Sarnia-Lambton was first United Way in Canada to purchase
and use the software.
41 Develop a strategy to complete the Community Investment decision process
by November 18, 2011 for funding beginning April 1, 2013. Done, and the
newly approved funding term will end March 31, 2019.
Develop a minimum of one strategic youth partnership in each of the next
three years that will improve the lives of young people in Sarnia-Lambton
and at the same time provide opportunities to promote the United Way and
the United Way campaign within that population. Not compete.
Develop strategies in the next two years to tap into the campaign potential of
Health Care and Municipal employees. So much more needs to be done. We
have embarked on a strategy of a joint campaign with BWH, but results to
date are less than desired.
Review in the next 180 days the various benchmark studies available to
evaluate the current desirable Social Media practices of the United Way of
Sarnia-Lambton. See bookmarking data.
42You can also read