COMMUNITY AIR MAPPING PROJECT FOR ENVIRONMENTAL JUSTICE - FINDINGS & RECOMMMENDATIONS REPORT - NYC Environmental Justice Alliance
←
→
Page content transcription
If your browser does not render page correctly, please read the page content below
CAMP-EJ
                            COMM UN IT Y A IR M A P P IN G P ROJECT
                                        FO R EN V IRO N M EN TA L J US TI CE
                                                         FINDINGS & RECOMMMENDATIONS REPORT

NEW YO R K C I TY E NV IRO N M EN TA L J UST IC E A L L I ANCE
                                                                              F EB RUA RY 2 0 2 1

                                    Copyright © 2021 by New York City Environmental Justice Alliance
  CO M M U N I T Y A I R M A P P I N G P R OJ EC T F O R E N V I R O N M E N TA L J U S T I C E   1
New York City Environmental Justice Alliance
                                  Co-authors: Jalisa Gilmore, Priya Mulgaonkar, Tok Michelle Oyewole, and Michael
                                  Heimbinder
                                  Contributors: Eddie Bautista and Renae Reynolds
                                  Data Analysis: Chris C. Lim
                                  Design: Priya Mulgaonkar
                                  Community Air Monitoring Team: Eulogia Diaz, Ting Ting Fu, Mark Winston Griffith, Raina
                                  Kennedy, Ana Melendez, Dariella Rodriguez, Angela Tovar, Leslie Velasquez, and Cesar Yoc

               The New York City Environmental Justice Alliance (NYC-EJA) would like to acknowledge the multiple
                  contributions of the NYC-EJA member organizations who participated in the development and
                           implementation of CAMP-EJ and provided guidance and oversight throughout.

      Brooklyn Movement Center                                           THE POINT CDC
      375 Stuyvesant Ave                                                 940 Garrison Avenue
      Brooklyn, NY 1123                                                  Bronx, NY 10474
      (718) 771-7000                                                     (718) 542-4139
      www.brooklynmovementcenter.org                                     www.thepoint.org

      El Puente                                                          UPROSE
      211 South 4th Street                                               462 36th St, 3rd Fl.
      Brooklyn, NY 11211                                                 Brooklyn, New York 11232
      (718) 387-0404                                                     (718) 492-9307
      www.elpuente.us                                                    www.uprose.org

      NYC Environmental Justice Alliance                                 We Stay/ Nos Quedamos
      462 36th St, 3rd Fl.                                               754 Melrose Avenue
      Brooklyn, NY 11232                                                 Bronx, NY 10451
      www.NYC-EJA.org                                                    (718) 585-2323
                                                                         www.nosquedamos.org

      Morningside Heights/ West Harlem
                                                                         Youth Ministries for Peace
      Sanitation Coalition
      100 La Salle Street #19F
                                                                         and Justice
                                                                         1384 Stratford Avenue
      New York, NY 10027
                                                                         Bronx, NY 10472
      (212) 666-6157
                                                                         (718) 328-5622
      www.sanitationcoalition.org
                                                                         www.ympj.org

         CAMP-EJ was supported by the Heimbinder Family Foundation, Lush Charity Pot, and the New York State
         Department of Environmental Conservation via an Environmental Benefit Project.

         Cover photos by (left to right): Luke Ohlson, Priya Mulgaonkar, Annel Hernandez, Jalisa Gilmore
         Nuestro Aire photos by El Puente. Conclusion cover photo by The Bronx Chronicle.

2              CO M M U N I T Y A I R M A P P I N G P R OJ EC T F O R E N V I R O N M E N TA L J U S T I C E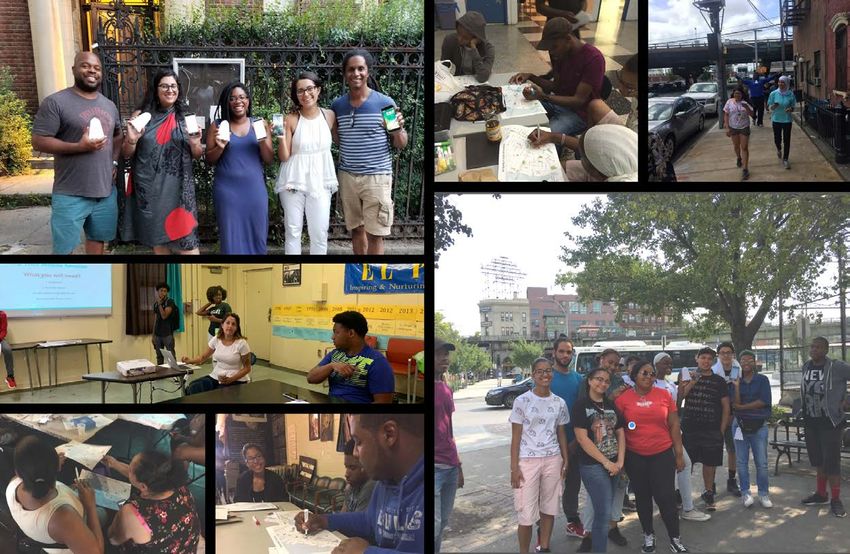
TABLE OF CONTENTS
Executive Summary                                                              4

Introduction                                                                   8
The Importance of Hyperlocal Air Quality Data                                  9
Elevating Community-Engaged Research                                           10
How We Measured Air Quality                                                    12

Findings                                                                       15
Local Facilities & Expressways are Big Polluters
                                                                               15
Traffic Congestion Fouls the Air Everyday, Twice-a-Day
                                                                               18
Hyperlocal Measurements Reveal PM2.5 Concentrations
20x Higher than State-run Monitors                                             19

Recommendations                                                                20

Conclusion                                                                     25

References                                                                     28

Appendix                                                                       31

CO M M U N I T Y A I R M A P P I N G P R OJ EC T F O R E N V I R O N M E N TA L J U S T I C E   3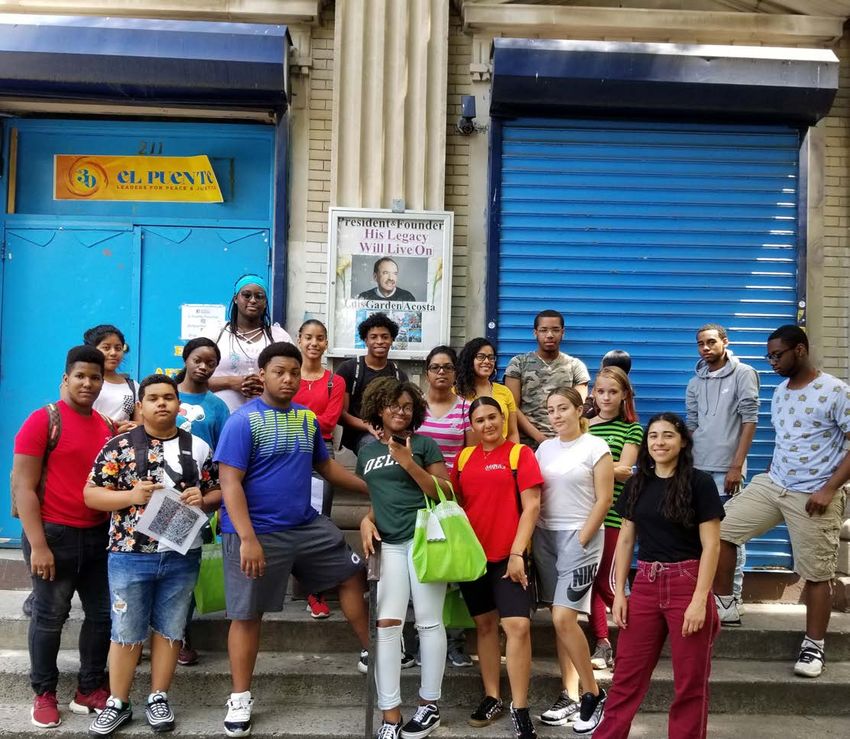
executive summary
    Globally, over four million people die prematurely every year as a result of breathing dirty air.
    In New York City, PM2.5 pollution alone is responsible for 2,000 premature deaths and 6,500
    emergency department visits annually. The health effects of poor air quality are particularly
    pronounced in low-income communities and communities of color due to historic discrimination
    in access to housing and racist land use planning that places polluting infrastructures and
    facilities in these neighborhoods.

    New York City Environmental Justice Alliance (NYC-EJA) member organizations represent
    environmental justice communities that are disproportionately exposed to PM2.5 pollution,
    and as a result, suffer from higher rates of respiratory illness, heart disease, stroke, lung cancer,
    negative birth outcomes, and other life-threatening conditions associated with breathing dirty air
    on a daily basis. The formulation and execution of NYC-EJA’s Community Air Mapping Project
    for Environmental Justice (CAMP-EJ) was informed by our member organization’s concerns
    with air pollution in their neighborhoods and the noticeable everyday impacts on the health of
    their communities. Led by six community-based organizations (CBOs) in the South Bronx and
    Brooklyn, CAMP-EJ empowered communities to collect and visualize hyperlocal air quality data
    and leverage this data to improve air quality, public health, and community development.

    Because New York City has only 13 high-performance ambient air monitoring sites, air pollution
    exposures are poorly characterized at the neighborhood level. To address this data gap, CAMP-EJ
    utilized dozens of low-cost, portable air quality monitors to measure hyperlocal air quality and
    characterize air pollution exposures at more refined spatial and temporal scales than is possible
    using existing City and State data. The results of our air monitoring campaign shed light on the
    disproportionate public health burdens imposed on environmental justice communities from
    industrial pollution, trucking, and transportation infrastructure.

    Brooklyn Movement Center, El Puente, THE POINT CDC, UPROSE, We Stay/Nos Quedamos,
    and Youth Ministries for Peace were the six community-based organizations in NYC-EJA’s
    network that led and organized local CAMP-EJ air quality monitoring campaigns in Brooklyn
    and the South Bronx. By prioritizing community participation, youth education, and leadership
    development NYC-EJA member organizations successfully collected thousands of hours of air
    quality measurements over the course of more than two years. Meetings that brought together
    NYC-EJA member organizations facilitated best practice exchange and the development of
    strategies for advancing their communities’ short- and long-term goals for improving air quality.

4           CO M M U N I T Y A I R M A P P I N G P R OJ EC T F O R E N V I R O N M E N TA L J U S T I C E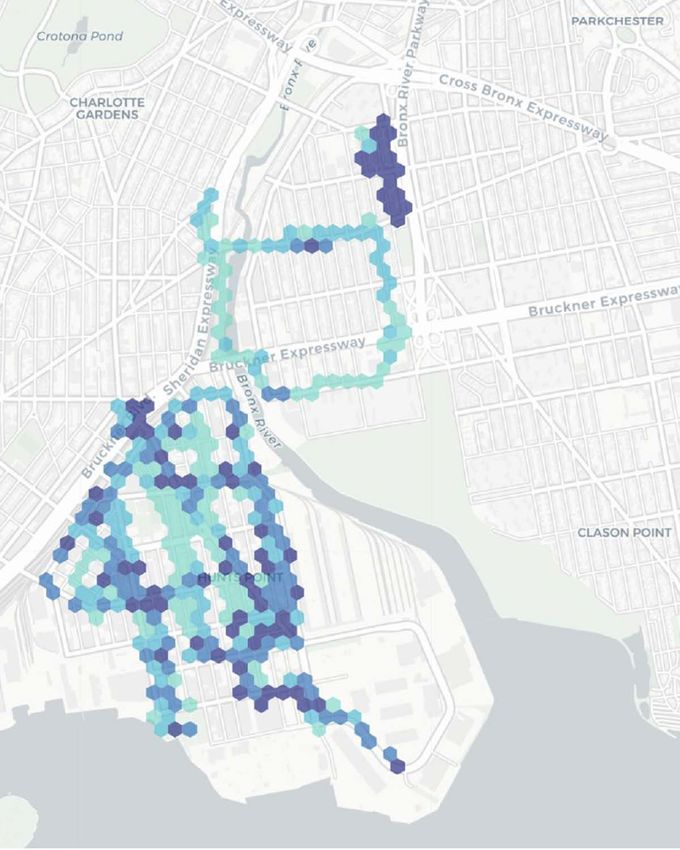
EXECUTIVE SUMMARY

                                    F INDING S
CAMP-EJ’s data analysis focused on three neighborhoods: Hunts Point and Soundview in the
Bronx and the Southside of Williamsburg in Brooklyn.

1. LOC A L FAC I L I TI E S & EX P R ES S WAYS A R E BIG
POLLU TE RS
Mobile and fixed air quality monitors identified several air pollution hotspots likely contributing
to elevated PM2.5 levels. In the South Bronx, the Hunts Point Food Distribution Center, the Hunts
Point Water Pollution Control Plant, and the “Toxic Triangle”—the area between the Cross Bronx,
the Bruckner, and the Sheridan Expressways—were all identified as sources likely contributing
to higher PM2.5 levels in the community. In Brooklyn, El Puente Headquarters—located at the
intersection of the BQE and the Williamsburg Bridge, approximately 100 meters from the MTA
Williams Plaza Bus depot—was identified as an air pollution hotspot.

2. T RA F F I C CONGE S T IO N FO U LS T H E A IR EV ERY
DAY, TWI C E A DAY
As expected, in both the South Bronx and Southside Williamsburg, data collection indicated that
air pollution varies throughout the day, spiking in the morning and evening in correspondence
with higher traffic volumes. CAMP-EJ data highlights how vehicular traffic congestion and poorly
planned and sited transportation infrastructure is a significant contributor to air pollution in
environmental justice neighborhoods.

3. H YP E RLO C A L MEAS U R EM EN T S S H OW PM 2 . 5
CONCE NTRATI ONS 2 0 X H IG H ER T H A N S TAT E-
RUN MONI TORS
Mobile monitoring revealed that local, one-minute PM2.5 measurements could be twenty times
higher than the levels reported by the closest government-run monitor. Stationary monitoring
revealed that the measurements from air quality instruments located just blocks from one another
could vary by a factor of three. This is consequential to public health, because acute short-term
exposures to high concentrations of PM2.5 are associated with negative cardiorespiratory health
outcomes, like heart attacks.

CO M M U N I T Y A I R M A P P I N G P R OJ EC T F O R E N V I R O N M E N TA L J U S T I C E         5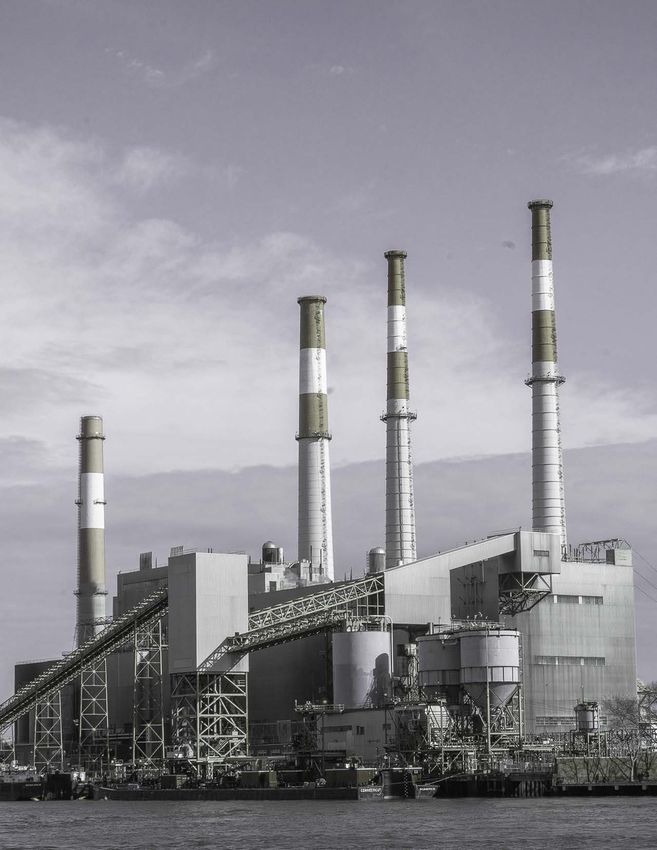
EXECUTIVE SUMMARY

                       R ECO MMENDAT IONS
    1. High pollution hot spots in communities need targeted
    investments and interventions to mitigate air pollution
    CAMP-EJ’s data collection identified several hot spots: the Toxic Triangle, areas near the Hunts
    Point Food Distribution Center and the Water Pollution Control Plant in the South Bronx, and
    the intersection of the BQE, the Williamsburg Bridge, and the Williams Plaza Bus Depot in
    Williamsburg. Communities can benefit from solutions that are targeted to these specific air
    pollution hot spots; the following recommendations are opportunities to do so in Hunts Point
    and Williamsburg.

    The Hunts Point Water Pollution Control Plant redesign should develop a plan for the facility to
    connect biogas into the grid as opposed to methane flaring, create a green transportation plan for
    vehicles accessing the facility, and integrate green space as a way to attenuate both air and water
    pollution.

    To mitigate air pollution associated with Hunts Point Food Distribution Center operations, we
    recommend the City electrify all idling-diesel powered refrigerated trucks and establish a larger
    truck stop electrification program. Additionally, the food distribution center should connect with
    the THE POINT CDC’s Community Solar project to explore opportunities for local, resilient,
    clean energy generation.

    In Williamsburg, air quality can be improved through incorporating more green infrastructure
    in the redesign of Continental Army Plaza. The addition of green infrastructure would improve
    air quality and provide a number of other environmental benefits, such as reduced surface
    temperatures, stormwater capture, and flood mitigation.

    2. Adopt city and state policies to reduce pollution
    from the transportation sector in environmental justice
    communities
    Environmental justice communities should be prioritized for electric vehicle use and
    interventions that will reduce traffic volumes, relieve traffic congestion, and improve pedestrian
    safety. For example, prioritizing the use of electric buses on MTA routes that stop at the Williams
    Plaza Bus Depot in North Brooklyn creates an opportunity to mitigate traffic pollution in the
    community. Additionally, a new marine terminal at the Hunts Point Food Distribution Center
    that prioritizes clean mobility options for last mile transport can reduce air pollution by cutting
    the number of trucks entering and exiting the facility.

6           CO M M U N I T Y A I R M A P P I N G P R OJ EC T F O R E N V I R O N M E N TA L J U S T I C E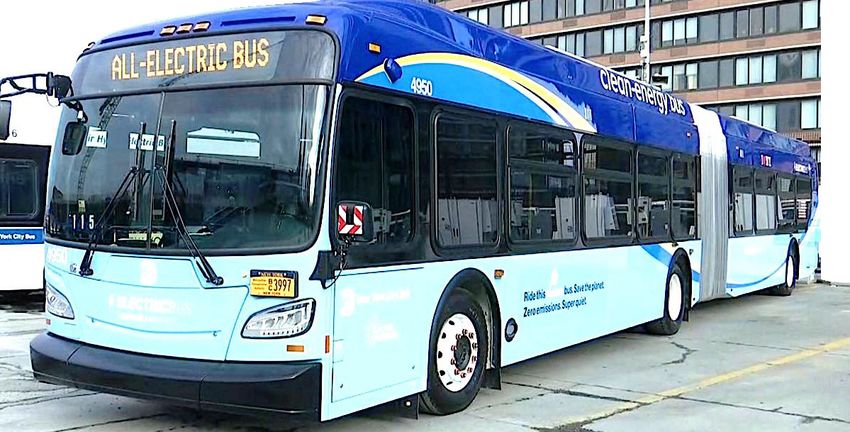
EXECUTIVE SUMMARY

3. Prioritize financial and technical support for hyperlocal
air monitoring networks managed by environmental
justice communities
CAMP-EJ’s data collection highlights the importance of hyperlocal air quality data,
demonstrating that air pollution measurements can vary significantly over small spaces and
short time frames. Hyperlocal air quality data elucidates where pollution is coming from, who
is exposed, and when they’re exposed, which are all critical questions to answer in crafting air
pollution mitigation strategies that are targeted at reducing exposures for the most vulnerable
populations. The City and State need to prioritize financial and technical support to local
environmental justice organizations, empowering them to build and operate air monitoring
networks and carry out grassroots community air monitoring campaigns similar to CAMP-EJ.

                               CO NCLUS ION
CAMP-EJ demonstrates the power of community-led participatory research; filling in the data
gaps where the network of regulatory air quality monitors falls short and helping communities
understand the health impacts of poor air quality. In many ways, the crisis precipitated by
COVID-19 foreshadows future risks exacerbated by climate change, where low-income
communities of color and other marginalized groups are hit first and worst by the impacts.
Decades of environmental racism have led to disproportionately high rates of respiratory and
heart disease in frontline communities, and increasing vulnerability to the impacts of viruses like
COVID-19. Grassroots air quality monitoring campaigns like CAMP-EJ are essential to provide
quality data, to inform policy, and improve health outcomes in frontline communities.

CO M M U N I T Y A I R M A P P I N G P R OJ EC T F O R E N V I R O N M E N TA L J U S T I C E         7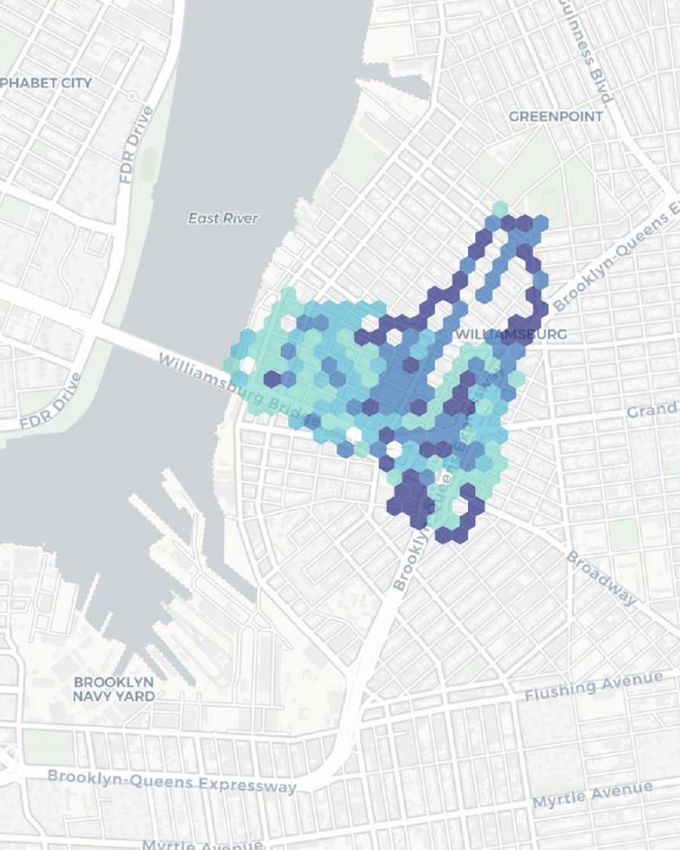
INTRODUCTION
                                             The New York City Environmental Justice                          Globally, air pollution is a major public
                                             Alliance (NYC-EJA) Community Air                                 health concern; an estimated 4.2 million
                                             Mapping Project for Environmental Justice                        premature deaths per year are due to
                                             (CAMP-EJ) is a grassroots air quality                            ambient air pollution.1 PM2.5 pollution
                                             monitoring campaign led by low-income                            alone is responsible for 2,000 premature
                                             communities and communities of color                             deaths and 6,500 emergency department
                                             in New York City. Since 2018, CAMP-EJ                            visits annually in New York City.2 Yet this
                                             has empowered six community-based                                pollution does not impact all New Yorkers
                                             organizations (CBOs) in the South                                equally. Low-income communities and
                                             Bronx and Brooklyn to measure, map,                              communities of color in New York City are
                                             and understand their exposures to fine                           disproportionately impacted by poor air
                                             particulate matter (PM2.5) air pollution.                        quality due to historic discrimination in
                                             Utilizing low-cost air quality monitors,                         access to housing, racist land use planning
                                             communities collect and visualize hyperlocal                     that places polluting infrastructures and
                                             air quality data in real-time and leverage this                  facilities in Black and Brown neighborhoods3
                                             data to improve air quality, public health,                      while simultaneously underbuilding parks
                                             and community development.                                       and open space,4 and inadequate access
                                                                                                              to healthcare,5 among other reasons. In
                                                                                                              New York City, the PM2.5-attributable
                                                                                                              mortality rate is 28% higher in high poverty
                                                                                                              neighborhoods compared with low poverty
                                                                                                              neighborhoods.6
                                              PM2.5 Attributable Mortality Rate by Poverty Status
                                        80

                                        70                                                        74
    Annual Deaths Per 100,000 Persons

                                        60                                  64
                                                      57
                                        50

                                        40

                                        30

                                        20

                                        10

                                        0
                                                    Low                  Medium                 High
                                                   Poverty               Poverty               Poverty

                                             Figure 1: PM2.5 Attributable Mortality Rate by Poverty Status.

8                                                 CO M M U N I T Y A I R M A P P I N G P R OJ EC T F O R E N V I R O N M E N TA L J U S T I C E
INTRODUCTION

  NYC-EJA’s member organizations represent environmental justice communities:
  low-income people of color who live alongside the most noxious infrastructure in
  our city, including waste transfer stations, petroleum storage & distribution centers,
  highways, power plants, concrete batch plants, and other industrial uses. As a result,
  such communities face higher rates of negative health outcomes linked to PM2.5
  pollution, including respiratory illness, heart disease, stroke, lung cancer, negative birth
  outcomes, and other life-threatening conditions.7,8,9,10 Motivated by a shared concern
  with disproportionate exposures to toxic air in their communities, NYC-EJA’s member
  organizations—in partnership with academic researchers—have been at the forefront in
  advancing innovative approaches to community-based air quality monitoring for decades,
  and CAMP-EJ is a continuation of this work.

THE IMPORTANCE OF HYPERLOCAL AIR QUALITY DATA
The recent proliferation of commercially-             monitors tend to be sparsely located even
available, low-cost, and quick-to-deploy              in large metropolitan areas and may be
air quality instruments has created                   entirely missing from smaller cities and
opportunities to measure air pollution                rural areas. New York City has only 13
minute-to-minute and block-by-block.                  high-performance ambient air monitoring
Around the world, networks of low-cost air            sites. As concentrations of air pollutants can
quality instruments are being established             fluctuate markedly over small distances and
by government agencies, research                      short time periods, variations in exposure
organizations, and communities—often                  for the millions of people living and working
collaborating together—to augment existing            across the city’s 302 square miles cannot be
state-run monitoring networks. This offers            adequately characterized using information
opportunities for both governments and                from sparse, static networks of air pollution
communities to collect and share real-time            monitors.11
air pollution data with higher spatial and
temporal resolution than can be achieved              Hyperlocal air quality data is essential to
with traditional methods that use expensive,          understanding the disproportionate public
fixed-site, regulatory-grade monitors.                health burdens imposed on environmental
                                                      justice communities.12 It can be used to
Government and regulatory agencies                    inform policymakers and protect public
throughout the world have traditionally               health by more accurately identifying air
relied on networks of fixed-site monitors             pollution sources and quantifying the
to measure air quality and establish air              benefits of targeted source abatement
quality standards. Owing to their high                policies.
equipment and operational costs, fixed-site

CO M M U N I T Y A I R M A P P I N G P R OJ EC T F O R E N V I R O N M E N TA L J U S T I C E          9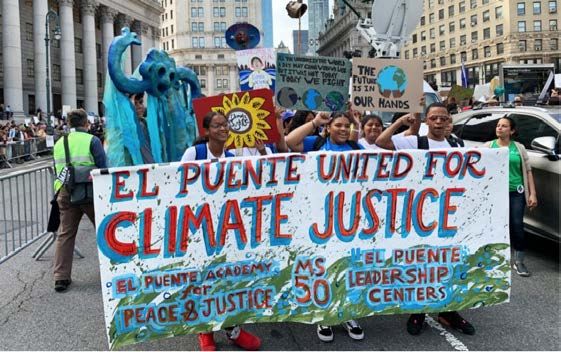
INTRODUCTION

            ELEVATIN G COMMUN I T Y- E NGAGE D R ES EA RCH
            NYC-EJA’s commitment to environmental                       NYC-EJA organized a series of workshops
            justice is the lodestar that guides                         to familiarize participants with CAMP-EJ’s
            CAMP-EJ’s direction and community-                          major milestones and goals and gather
            based participatory research is the engine                  feedback that informed our study design
            that drives it forward. Working hand-in-                    and data collection practices. In year one,
            hand with our member organizations,                         NYC-EJA led the CAMP-EJ community
            we recruited and organized dozens of                        workshops. During the second year,
            community members and empowered                             NYC-EJA developed train-the-trainer
            them to be active participants and leaders                  resources that equipped staff from
            in collecting and interpreting hyperlocal                   participating CBOs to independently run
            PM2.5 data. By prioritizing community                       the air quality monitoring workshops. This
            participation, youth education, and                         allowed the workshops to be tailored to each
            leadership development, CAMP-EJ raises                      community and, with a trained expert now
            community awareness of environmental                        on staff, enabled quicker troubleshooting
            harms, catalyzes civic action, and builds the               when technical problems arose during field
            capacity of participating communities to                    deployments.
            sustain the types of multi-year, collaborative
            advocacy campaigns that can inform new
            environmental-health policies in New York
            City.

                                               E J I N AC T I O N :
                   T H E R O L E O F P M 2 .5 M O N I TO R I N G I N
                   W I N N I N G WAS T E E Q U I T Y F O R N YC
                                                                    Air quality monitoring at the neighborhood level has been used
                                                                    to improve the City’s study of the impacts of the commercial
                                                                    waste industry, with NYC-EJA members and sanitation
                                                                    workers deploying AirBeams to understand the impacts of
                                                                    disproportionate truck miles travelled in EJ communities. Building
                                                                    upon the victory of the Waste Equity law, which curbed the
                                                                    amount of waste that can be routed to three NYC neighborhoods,
                                                                    citizen-collected data on waste trucks and near waste facilities has
                                                                    been used to support the City’s Commercial Waste Zone planning
                                                                    process and to provide recommendations for meeting OneNYC’s
                                                                    air quality goals.13

Protest against waste transfer stations in the South Bronx, 2016.
                       Source: Alex Moore

   10                CO M M U N I T Y A I R M A P P I N G P R OJ EC T F O R E N V I R O N M E N TA L J U S T I C E
INTRODUCTION
CAMP-EJ workshops and monitoring sessions 2017-2019. Source: Jalisa Gimore, Priya Mulgaonkar, and Tok Oyewole
The workshops included background information and educational materials centered on
“Environmental Justice, Air Pollution, and Health”, mapping exercises where participants
located neighborhood air pollution sources, and training sessions that taught volunteers how to
coordinate their monitoring efforts, deploy the monitors, and interpret the measurements.
Community-based trainers used interactive lectures and quizzing on basics of PM2.5 pollution,
including impacts and point sources. Young people working within the CBOs were instrumental
in undertaking the trainings themselves and were aided by NYC-EJA and HabitatMap staff when
needed. Reviewing handouts with step-by-step guides to using air quality monitors, as well as
having a troubleshooting guide for common issues, was helpful in comparison to earlier training
session trials without FAQs. Following the training, the most successful CAMP-EJ sites had a
dedicated staff person to coordinate mobile or stationary monitors who kept in contact with
NYC-EJA and HabitatMap staff for any troubleshooting. Throughout the two years, CAMP-EJ
also organized meetings where participants exchanged best practices and brainstormed strategies
for advancing their communities’ short- and long-term goals for improving air quality.
CO M M U N I T Y A I R M A P P I N G P R OJ EC T F O R E N V I R O N M E N TA L J U S T I C E 11INTRODUCTION
HOW WE MEASURED A I R QUA L I T Y
CAMP-EJ was coordinated by NYC-EJA To collect air quality data, CAMP-EJ
with support from HabitatMap, an participants used the AirBeam2, a
environmental technology non-profit, low-cost, palm-sized air quality instrument
and realized via a multi-year, grassroots that measures PM2.5, and AirCasting,
effort powered by staff and volunteers an open-source environmental data
from NYC-EJA’s member organizations in visualization platform that consists of
Brooklyn and the South Bronx.* NYC-EJA an Android app and online mapping
member organizations participating in system. Participants collected air quality
the full duration of CAMP-EJ included: measurements along designated walking
Brooklyn Movement Center, El Puente, routes and at fixed locations in North
THE POINT CDC, and Youth Ministries Brooklyn, Central Brooklyn, and the South
for Peace and Justice. NYC-EJA member Bronx from July 2018 to September 2019.
organizations, UPROSE and WE Stay/Nos During this time, 130 hrs of 1-second
Quedamos also participated in the inaugural PM2.5 measurements were recorded while
year of CAMP-EJ. Additional financial, volunteers walked their neighborhoods
planning, and technical assistance for air and 183,309 hours of 1-minute PM2.5
quality monitoring was provided to El measurements were recorded at fixed
Puente and Youth Ministries for Peace and locations.
Justice by the Barry Commoner Center for
Health and the Environment (BCCHE) at Mobile AirBeam2 monitoring, recorded
Queens College with the backing of the New while walking, was organized by NYC-EJA
York City Department of Health and Mental member organizations and carried out
Hygiene.14 by paid community members, including
Summer Youth Employment Program
participants. PM2.5 concentrations were
measured along predetermined routes of 45
minutes to 1 hour that traversed multiple
land uses—e.g. parks, waterfront, industrial
districts, residential blocks—and started
and ended at NYC-EJA member offices. Air
quality measurements were collected over
the course of 264 separate sampling sessions.
Airbeam 2. Source: HabitatMap
12 CO M M U N I T Y A I R M A P P I N G P R OJ EC T F O R E N V I R O N M E N TA L J U S T I C EINTRODUCTION
map of stationary
monitors
El Puente CAMP-EJ workshop and monitoring sessions 2019. Source: Jalisa Gimore.
CO M M U N I T Y A I R M A P P I N G P R OJ EC T F O R E N V I R O N M E N TA L J U S T I C E 13INTRODUCTION
HOW WE MEASURED A I R QUA L I T Y (CO NT’ D)
Fixed location AirBeam2s were set up The AirBeam2’s PM2.5 measurements are
outdoors at NYC-EJA member organization’s “quite accurate” according to a performance
offices and paid community members’ evaluation conducted by South Coast
apartments. The deployment and runtime Air Quality Management District, which
of fixed location AirBeam2s at offices compared the performance of the AirBeam2
and apartments was limited due to siting to reference monitors.15 To further evaluate
requirements, including a secure outdoor the performance of the AirBeam2, we
location and access to a power outlet and compared hourly PM2.5 measurements
WiFi Internet. Building on their experience from fixed location AirBeam2s with
running the New York City Community measurements from nearby government-run
Air Survey, BCCHE successfully deployed air quality monitors operated by the New
dozens of fixed location AirBeam2s— York State Department of Environmental
powered by swappable lead-acid battery Conservation (DEC). AirBeam2 PM2.5
packs and transmitting data over the 2G measurements, though generally higher,
cellular network—on light poles in the tracked the state-run monitors closely,
South Bronx and Williamsburg’s Southside. effectively capturing long-term temporal
The locations of these fixed AirBeam2s was trends and patterns. For the duration of
selected by BCCHE according to their study CAMP-EJ, two AirBeam2 monitors were
design and in consultation with El Puente co-located with reference instruments at
and Youth Ministries for Peace and Justice. DEC’s Queens College air quality station.
A regression analysis of the resulting data
(Figure 2) shows good agreement between
40
the AirBeam2 and DEC’s PM2.5 reference
monitor.
R2 = 0.67
AirBeam2 - PM2.5 (μg/m3)
30
20
10
0 10 20 30 40
NYSDEC Queens College TEOM - PM2.5 (μg/m3)
Figure 2: Regression analysis of the AirBeam2 and DEC’s PM2.5
reference monitor.
14 CO M M U N I T Y A I R M A P P I N G P R OJ EC T F O R E N V I R O N M E N TA L J U S T I C EFINDINGS
FINDINGS
CAMP-EJ measured air quality in several different neighborhoods, but our data analysis
was restricted to three: Hunts Point and Soundview in the Bronx and the Southside of
Williamsburg in Brooklyn. In these neighborhoods, a sufficient number of measurements
were recorded over the 2-year study period that our findings are representative of
prevailing patterns of PM2.5 concentration and distribution.
1. LOC A L FAC I L IT IES & EX P R ES S WAYS
A RE B I G P O L LU T ER S
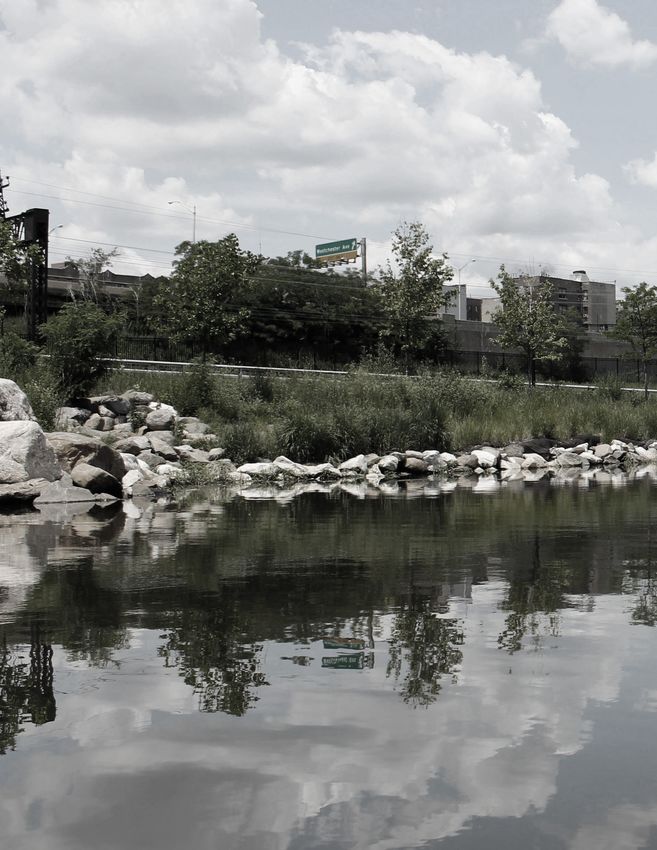
The following maps (Figures 3 & 4) depict responsible for releasing noxious odors that
the results of CAMP-EJ’s mobile monitoring have been a nuisance in the neighborhood
efforts in the South Bronx and Southside for decades.18 Fixed location monitoring in
Williamsburg.** The maps also identify the South Bronx identified the area between
some of the sources that likely contributed the Cross Bronx, the Bruckner, and the
to higher mobile PM2.5 measurements along Sheridan Expressways—locally referred to
with the fixed location AirBeam2s in each as the “Toxic Triangle”—as another PM2.5
area that consistently recorded the highest pollution hotspot.
PM2.5 measurements.
In Brooklyn, identification of PM2.5 hotspots
Mobile and fixed location AirBeam2 using mobile monitoring was less clear, but
sampling identified several air pollution lower concentrations are observed along
hotspots. In the South Bronx, mobile the de-industrialized waterfront and the
monitoring revealed consistently higher highest concentrations along the BQE.
measurements proximate to the Hunts Point Fixed location monitoring in Williamsburg
Food Distribution Center —the second identified a hotspot at El Puente
largest food distribution center in the world, headquarters, which sits at the intersection
generating an astounding 15,000 truck trips of the BQE and the Williamsburg bridge,
daily16—and the Hunts Point Water Pollution about 100 meters from the MTA Williams
Control Plant—the largest point source Plaza Bus depot.
emissions facility in the neighborhood,17
CO M M U N I T Y A I R M A P P I N G P R OJ EC T F O R E N V I R O N M E N TA L J U S T I C E 15FINDINGS
PM2.5 in μg/m3
0-9 >9 - 11 >11 - 13 >13 - 50
Avg. PM2.5 levels measured by
mobile AirBeams after adjusting
for background temporal trends
Polluting Facility /
Infrastrucuture
Sources that likely contributed
to higher than avg. mobile
AirBeam PM2.5 measurements
Fixed AirBeam
Additional AirBeams were sited
outside the bounds of this map
PM2.5 Hotspot
Over the two-year sampling
period, avg. PM2.5 levels at this iangle
spot were 69% higher than the
Toxic Toxic Tr
Triangle
neighborhood wide average
Hunts Point Food
Distribution Center
Hunts Point Water
Pollution Control Plant
Figure 3: South Bronx CAMP-EJ Mobile Monitoring Map.
16 CO M M U N I T Y A I R M A P P I N G P R OJ EC T F O R E N V I R O N M E N TA L J U S T I C EFINDINGS
PM2.5 in μg/m3
0-5 >5 - 7 >7 - 10 >10 - 42
Avg. PM2.5 levels measured by
mobile AirBeams after adjusting
for background temporal trends
Polluting Facility /
Infrastrucuture
Sources that likely contributed
to higher than avg. mobile
AirBeam PM2.5 measurements
Fixed AirBeam
Additional AirBeams were sited
outside the bounds of this map
PM2.5 Hotspot
Over the two-year sampling
period, avg. PM2.5 levels at this
spot were 38% higher than the
neighborhood wide average
Williams Plaza
Bus Depot
Figure 4: Williamsburg, Brooklyn CAMP-EJ Mobile Monitoring Map.
CO M M U N I T Y A I R M A P P I N G P R OJ EC T F O R E N V I R O N M E N TA L J U S T I C E 17FINDINGS
2. TRA F F I C CO N G ES T IO N FO U LS T H E
A I R E V E RY DAY, T W ICE A DAY
The following plots (Figures 5 & 6) depict the results of CAMP-EJs fixed monitoring efforts in the
South Bronx and Southside Williamsburg.*** As expected, visible within-day, diurnal temporal
trends are observed from the collected data, with the highest levels being observed around 7-8
am during the morning rush hour, highlighting that air pollution levels, and associated health
effects, are prominently impacted by the vehicular traffic congestion. The lowest levels are
observed around 3-4 pm in the afternoon, while around 8-9 pm the air pollution levels rise again
due to nighttime vehicular traffic congestion, although not as much when compared to morning
rush-hour traffic. It should be noted that the boundary layer, the layer of the atmosphere closest
to the earth, also plays a role in exacerbating pollution from traffic congestion. In the early
morning and late evening, the boundary layer is tight against the Earth, which concentrates air
pollution in the breathing zone. During the day, as the sun warms the atmosphere, the boundary
layer expands upwards reducing pollutant concentrations as they are diluted within a greater
volume of air.
Williamsburg, NY - Temporally Adjusted PM2.5 Levels South Bronx, NY - Temporally Adjusted PM2.5 Levels
Hourly avg. PM2.5 level / long-term avg. PM2.5 level
Hourly avg. PM2.5 level / long-term avg. PM2.5 level
1.10 1.10
1.05 1.05
1.00 1.00
0.95 0.95
0.90 0.90
2 4 6 8 10 12 14 16 18 20 22 2 4 6 8 10 12 14 16 18 20 22
Hour of Day Hour of Day
Figure 5: Willimsburg, Brooklyn CAMP-EJ Fixed Figure 6: South Bronx CAMP-EJ Fixed Monitoring PM2.5
Monitoring PM2.5 Pollution levels. Pollution levels.
18 CO M M U N I T Y A I R M A P P I N G P R OJ EC T F O R E N V I R O N M E N TA L J U S T I C EFINDINGS
3. HY P E RLOC A L P M 2.5 CO N CEN T R AT IO N S
2 0 X HI GHE R T H A N S TAT E- RU N
MONI TO RS
PM2.5 concentrations can fluctuate This is an important public health finding,
significantly from minute-to-minute and as acute, short-term exposures to high
block-by-block. This variability is not concentrations of PM2.5 are associated
accurately represented by the government- with adverse cardiorespiratory health
run air quality monitoring network because effects, like heart attacks, in vulnerable
it is both spatially sparse (there are only 13 populations.19 In addition, prior research
PM2.5 monitors covering New York City’s has demonstrated the negative health effects
302 square miles), and temporally sparse of breathing PM2.5 at levels well below
(reporting measurements at intervals of 1 regulatory thresholds, as well as a growing
hour or longer). Mobile PM2.5 measurements body of evidence that indicates there is no
revealed that 1-minute AirBeam2 safe level of exposure to PM2.5, especially for
measurements could be more than twenty the most hazardous components, like diesel
times higher than the values reported by exhaust.20,21 Exposure to PM2.5 pollution
the nearest government-run monitoring is both hazardous and highly variable;
station, while stationary PM2.5 measurements hyperlocal air pollution data is required to
revealed that 1-hour measurements from properly characterize exposures in the most
AirBeam2s located just blocks from one vulnerable communities.
another could vary by a factor of three.
r,
l monito
persona a ir
u te
one-min
n level
pollutio
onitor,
state m
n e -h o u r air
o
u ti o n level
poll
state monitor, personal monitor,
one-hour air one-minute air
pollution level pollution level
CO M M U N I T Y A I R M A P P I N G P R OJ EC T F O R E N V I R O N M E N TA L J U S T I C E 19RECOMMENDATIONS
NYC has made steady progress towards trips to public and active transportation,
improving air quality citywide; however, implementation of congestion pricing,
not enough has been done to address air improved freight efficiency, increased zero
quality disparities among communities. and low emission vehicle adoption, and
Even modest reductions in PM2.5 pollution transition to a low-carbon intensity energy
in New York City can lead to substantial grid. If all these measures were implemented
improvements in health; a 10% reduction successfully, it’s predicted that approximately
from 2010 PM2.5 levels could prevent 25,000 asthma related emergency
hundreds of premature deaths and department visits in “very high poverty”
thousands of emergency department visits neighborhoods could be avoided annually.23
annually.22
New York City and New York State should
Furthermore, NYC can achieve big implement targeted air pollution abatement
improvements in air quality and public strategies beginning in environmental justice
health, especially in areas overburdened communities, where air quality is worst
with polluting sources, if the City of and interventions are predicted to have the
New York’s 80x50 Roadmap (the de greatest public health impact. CAMP-EJ’s
Blasio administration’s plan to reduce data collection efforts have yielded several
greenhouse gas emissions 80% by 2050) is findings that can inform advocacy for
fully implemented. The clean air policies policies, programs, and practices to reduce
advanced by the 80x50 plan include PM2.5 pollution in environmental justice
building-specific performance targets to communities and improve air quality
reduce fossil fuel use in buildings larger monitoring regimes.
than 25,000 square feet, shifts in commuter
Environmental justice youth leading from the South Bronx and North Brooklyn at the Peoples Climate March in 2014.
Source: WelcomeTotheBronx and El Puente
20 CO M M U N I T Y A I R M A P P I N G P R OJ EC T F O R E N V I R O N M E N TA L J U S T I C ER E C O M M E N D AT I O N S
1.
H I GH P O L LU TION H OT S POTS I N COMMU N I TI E S N E E D
TA RG E TE D INVE S TM E N TS AN D I N TE RVE N TI ON S TO MIT IGAT E
A I R P OL LU TIO N
The Toxic Triangle and the areas near the We recommend that the facility create a
Hunts Point Food Distribution Center transparent plan to connect biogas generated
and Water Pollution Control Plant in the through anaerobic digestion into the grid
South Bronx, and the intersection of the to fuel local buildings, as opposed to flaring
BQE, the Williamsburg Bridge and the or otherwise releasing methane biogas into
Williams Plaza Bus Depot in Williamsburg the atmosphere. Such a plan should power
are air pollution hotspots. These hotspots the facility as well, supporting closed-loop
are characterized by highways, industry, biogas use on site. The Hunts Point plant can
intense trucking activity, and a lack of green decrease its negative impact on surrounding
space. Cleaner transportation technologies, neighborhoods by ensuring that nuisances
green infrastructure and other nature-based such as noxious odors and pests are
solutions need to be prioritized in these controlled, and by putting forth a green
areas to help mitigate the harmful effects transportation plan, such that vehicle use is
of this pollution on the community. The minimal, and only zero- and low-emissions
following are opportunities to do so in Hunts vehicles using renewable fuels can access
Point and Williamsburg: the plant, while following other high
standards of air quality control (no idling,
The Hunts Point Water Pollution Control efficient truck routes, alternative modes
Plant is slated for improvements that were of transportation, etc.). Facility planning
originally set to begin in Spring 2020 should continue to operate in consultation
and be completed in Fall 2024. Planned with local community members, and the
improvements include more compact redesign should include goals of reducing
buildings, more efficient sludge production, pollutant emissions and increasing public
increased vegetation, and new anaerobic access to open, green space.
digesters, among others.24
CO M M U N I T Y A I R M A P P I N G P R OJ EC T F O R E N V I R O N M E N TA L J U S T I C E 21R E C O M M E N D AT I O N S
As a result of the Hunts Point Resiliency
Feasibility Study, the City will advance the
Hunts Point Energy Resiliency project,
which calls for resilient energy generation
and storage solutions to protect the flood
vulnerable Hunts Point Food Distribution
Center. The project also calls for electrifying
a portion of the idling, diesel-powered
refrigerated trucks at 100 Food Center
Drive.25 Given the elevated levels of PM2.5,
the City should prioritize electrifying all YMPJ Earth Day Event at Concrete Plant Park.
idling, diesel-powered refrigerated trucks to Source: Jalisa Gilmore & Tok Oyewole
reduce air pollution at the Food Distribution
Center, and establish a larger truck stop
Another example of how air quality can
electrification program, similar to the Hunts
be improved through targeted investment
Point Truck Stop Electrification Program
includes the proposed redesign for
pilot.26 THE POINT CDC’s Community
Continental Army Plaza, located at the base
Solar project could potentially support by
of the Williamsburg Bridge adjacent to El
providing local, resilient, and clean energy to
Puente’s office. El Puente is advocating for
yield further air quality benefits.
more green infrastructure in the redesign of
Continental Army Plaza, which has been put
on hold due to the COVID-19 pandemic.
The addition of green infrastructure
would improve air quality, reduce surface
temperatures, mitigate flooding, and
improve the overall experience of the plaza
for this environmental justice community.
South Bronx CAMP-EJ Workshop in 2018
Source: Priya Mulgaonkar
22 CO M M U N I T Y A I R M A P P I N G P R OJ EC T F O R E N V I R O N M E N TA L J U S T I C ER E C O M M E N D AT I O N S
2. A D O PT C ITY AN D S TAT E POLI CI E S TO R E DU CE POLLU T IO N FRO M
T H E T R AN S P ORTATION S ECTOR I N E N VI RO N ME N TAL J UST IC E
CO M MU N ITIE S
Our air quality data lends additional In addition, we must ensure the energy
evidence to the fact that vehicular traffic used to power electric vehicles comes
congestion substantially contributes to from clean, renewable energy sources.
poor air quality in environmental justice Moreover, we must aim to reduce our
communities. We recommend policies that reliance on private vehicles by encouraging
will mitigate pollution from transportation multi-modality transit and increasing access
sources such as the implementation of to micro-mobility options.
Congestion Pricing to raise revenue for
mass transit investments, accelerating In addition to citywide policies, EJ
the transition to electric public buses, communities should be prioritized for
incentivizing medium and heavy duty electric vehicle use. For example, the MTA
vehicle fleets to transition to electric vehicles should prioritize the use of electric buses
(with specific priority on those that operate on MTA routes that stop at the Williams
in environmental justice communities), Plaza Bus depot in North Brooklyn. As a
investing in electric vehicle charging community lacking in quality green space
infrastructure and redesigning roadways to and overburdened by traffic from the BQE
support electric bus-only routes and cycling and nearby bus depots, all-electric buses will
infrastructure. help mitigate PM2.5 pollution in the area.
As part of Freight NYC, a new marine
terminal at the Hunts Point Food
Distribution Center has the potential
to reduce truck traffic and improve air
quality.27 However, any development of a
marine terminal needs to include a traffic
impact study to understand the potential
impact of localized air pollution from trucks
and marine vehicles where the freight
transfers take place. Additionally, vehicles
transporting goods to and from the marine
terminal should use clean mobility options
for last mile transport such as e-bikes and
scooters.
CO M M U N I T Y A I R M A P P I N G P R OJ EC T F O R E N V I R O N M E N TA L J U S T I C E 23E J I N AC T I O N : O U R A I R ! / ¡ N U E S T R O A I R E !
One ongoing initiative in NYC that could benefit from City and State support is Our
Air! / ¡Nuestro aire!. Led by El Puente, Our Air! / ¡Nuestro aire! is a grassroots campaign
with a 5-Point Action Platform that engages youth organizers, community members,
elected leaders, academic partners, local organizations, artists, and schools to address
the environmental crisis of toxic air quality in the South Williamsburg community. The
platform target improvements in clean air and community wellness, including policies and
practices to mitigate truck traffic, improve access to quality green and open space, and
holistically improve the economic and environmental health of the community.28
F I V E PO I N T P L AT F O R M
1. The Right to Breathe Clean Air
2. A Public Health Emergency Taskforce
3. Health as a Human Right
4. Cultural Organizing, Awareness Raising & Education
5. Greening for a Safe FutureR E C O M M E N D AT I O N S
At the same time, the City and State should be wary of false solutions, including the
Transportation Climate Initiative (TCI), an umbrella policy development process for multi-state
engagement to establish a regional cap-and-trade system that would “regulate” transportation
emissions in Northeast and Mid-Atlantic states. NYC-EJA, the Climate Justice Alliance-
Northeast, and other climate justice advocates oppose TCI due to concerns that it would
undermine the economy-wide emissions reduction mandate set by the NYS Climate Leadership
and Community Protection Act. TCI’s attempt to regulate mobile source emissions using a
framework previously designed for stationary source emissions would not directly address the
localized emissions from on-road vehicles in environmental justice communities. The policy
lacks the comprehensive lens necessary to solve the causality of air pollution. Therefore, even
if overall transportation emissions went down, the disproportionate impacts in environmental
communities would persist.29
3. P R I O R ITIZE F INAN C IAL AN D TECH N I CAL S U PPORT FOR
H Y P ER LO C A L AIR M O NI TOR I N G N E TWOR KS MAN AGE D BY
EN V I RO NM E N TAL J U S TI CE COMMU N I TI E S
CAMP-EJ’s air quality data demonstrates how air quality can vary significantly over space and
time. We cannot improve air quality if we do not have an accurate picture of where pollution
is coming from and which communities are most impacted by poor air quality. Grassroots
community air quality monitoring campaigns, such as CAMP-EJ, are essential as they not
only collect the hyper-local information needed to craft data informed policy, they also raise
community awareness of environmental harms and empower communities to take action to
reduce pollution exposures. It is equally important that New York City and State prioritize
financial and technical support to local community-based organizations to improve air quality
and health in environmental justice communities. One progressive example, which should serve
as a model for the City and State’s efforts, is California’s Community Air Protection Program,
which provides resources for community air monitoring in environmental justice communities
while simultaneously advancing community developed air emissions reduction programs and
increasing the accessibility of air quality data.
NYC-EJA and our allies in NY Renews successfully achieved a commitment to expand air quality
testing in EJ communities through the NYS Climate Leadership and Community Protection Act.
This commitment must lend direct support to grassroots organizations leading local air quality
monitoring campaigns.
CO M M U N I T Y A I R M A P P I N G P R OJ EC T F O R E N V I R O N M E N TA L J U S T I C E 25conclusion
The COVID-19 pandemic has thrown into stark relief the compounding effects of
environmental racism on low-income Black and Brown communities. We have observed
disproportionately high rates of illness and death in low income Black and Brown
communities with long legacies of toxins in the air, including within New York City, with
neighborhoods near polluting infrastructure in the Bronx, Brooklyn, and Queens hit
particularly hard.
With new research indicating fossil fuel particle pollution is responsible for nearly twice as
many deaths as previously believed and with concern growing that hobbled public transit
systems will lead to a resurgence in commuter-related traffic congestion, understanding
how federal, state, and city policies are impacting hyperlocal air quality has never been
more urgent.30,31
The ability to locally and flexibly collect this data therefore holds increasing relevance,
and is likely to continue to be the case as illnesses exacerbated by a changing climate
continue to spread and intersect with disparities in air quality.32 Sharing best practices in
community air quality monitoring is essential to design studies that provide quality data
to inform policy and improve health outcomes in frontline communities.
CAMP-EJ has demonstrated the power of community-led participatory research in
the struggle for environmental justice. Hyperlocal community air quality monitoring
plays a vital role in filling the gaps between city, state, and federal monitoring systems.
Community science will continue to be an important component in our understanding
and prevention of the adverse health outcomes arising from exposure to poor air quality.
26 CO M M U N I T Y A I R M A P P I N G P R OJ EC T F O R E N V I R O N M E N TA L J U S T I C ECO M M U N I T Y A I R M A P P I N G P R OJ EC T F O R E N V I R O N M E N TA L J U S T I C E 27
references
     1. “Ambient Air Pollution: Health Impacts.” World Health Organization. https://www.who.int/
     airpollution/ambient/health-impacts/en/

     2. Johnson, Sarah et al. 2020. “Assessing Air Quality and Public Health Benefits of New York
     City’s Climate Action Plans”. Environmental Science & Technology 54 (16): 9804-9813. American
     Chemical Society (ACS). doi:10.1021/acs.est.0c00694.

     3. Wilson, Sacoby; Hutson, Malo & Mujahid, Mahasin. 2008. “How Planning and Zoning
     Contribute to Inequitable Development, Neighborhood Health, and Environmental Injustice”.
     Environmental Justice 1 (4): 211-216. Mary Ann Liebert Inc. doi:10.1089/env.2008.0506.

     4. Hu, Winnie & Schweber, Nate. 2020. “New York City Has 2,300 Parks. But Poor
     Neighborhoods Lose Out.”. Nytimes.com. https://www.nytimes.com/2020/07/15/nyregion/
     nyc-parks-access-governors-island.html.

     5. Dunker, Amanda & Ryden Benjamin, Elisabeth. 2020. “How Structural Inequalities
     in New York’s Health Care System Exacerbate Health Disparities During the COVID-19
     Pandemic: A Call for Equitable Reform”. Cssny.org. https://www.cssny.org/news/entry/
     structural-inequalities-in-new-yorks-health-care-system.

     6. Kheirbek, Iyad et al. 2020. Air Pollution and the Health of New Yorkers: The Impact of Fine
     Particles and Ozone. Ebook. New York City Department of Health and Mental Hygiene. https://
     www1.nyc.gov/assets/doh/downloads/pdf/eode/eode-air-quality-impact.pdf.

     7. Sun Q, Hong X, Wold LE. Cardiovascular effects of ambient particulate air pollution exposure.
     Circulation. 2010 Jun 29;121(25):2755-65

     8. Pope III CA, Coleman N, Pond ZA, Burnett RT. Fine particulate air pollution and human
     mortality: 25+ years of cohort studies. Environmental Research. 2019 Nov 14:108924

     9. Lee BJ, Kim B, Lee K. Air pollution exposure and cardiovascular disease. Toxicological
     research. 2014 Jun;30(2):71-5

     10. Lim CC, Thurston GD. Air pollution, oxidative stress, and diabetes: a life course
     epidemiologic perspective. Current diabetes reports. 2019 Aug 1;19(8):58.

28           CO M M U N I T Y A I R M A P P I N G P R OJ EC T F O R E N V I R O N M E N TA L J U S T I C E
REFERENCES 11. Kumar P, Morawska L, Martani C, Biskos G, Neophytou M, Di Sabatino S, Bell M, Norford L, Britter R. The rise of low-cost sensing for managing air pollution in cities. Environment international. 2015 Feb 1;75:199-205. 12. McLaughlin, Tim, Laila Kearney, and Laura Sanicola. “Special Report: U.S. air monitors routinely miss pollution - even refinery explosions.” Reuters, Dec. 1, 2020. https://www.reuters.com/article/usa-pollution-airmonitors-specialreport/ us-air-monitors-routinely-miss-pollution-even-refinery-explosions-idUSKBN28B4RT. 13. Transform Don’t Trash Coalition, “Clearing the Air: How Reforming the Commercial Waste Sector Can Address Air Quality Issues in Environmental Justice Communities”, 2018 http:// transformdonttrashnyc.org/wp-content/uploads/2016/09/Final-draft-v3_TDT-Air-Qual-Report_ Clearing-the-Air-1.pdf 14. Ilie, Ana Maria Carmen & Eisl, Holger. 2020. Air Quality Citizen Science Research Project in NYC Toolkit & Case studies. Barry Commoner Center for Health and the Environment. https:// www.researchgate.net/publication/344575711_Air_Quality_Citizen_Science_Research_Project_ in_NYC_Toolkit_Case_studies. 15. “HabitatMap - AirBeam2”. Aqmd.gov. http://www.aqmd.gov/aq-spec/sensordetail/ habitatmap-airbeam2 16. Ezez. 2020. “The Economic Impact of the Hunts Point Food Distribution Center - NYC Food Policy Center”. NYC Food Policy Center. https://www.nycfoodpolicy.org/ the-economic-impact-of-the-hunts-point-food-distribution-center. 17. Ezez. 2020. “Air Facility Permits and Registrations - NYS Dept. of Environmental Conservation”. Dec.ny.gov. https://www.dec.ny.gov/chemical/8569.html#State. 18. Warren, Matthew R. 2020. “Hunts Point Residents Sue Over a Smell”. The New York Times. https://www.nytimes.com/2008/07/10/nyregion/10bronx.html. 19. Wei, Yaguang, Yan Wang, Qian Di, Christine Choirat, Yun Wang, Petros Koutrakis, Antonella Zanobetti, et al. “Short term exposure to fine particulate matter and hospital admission risks and costs in the Medicare population: time stratified, case crossover study” BMJ, 367, 6258(2019). https://www.bmj.com/content/367/bmj.l6258 20. Beelen, Rob et al. 2014. “Effects of long-term exposure to air pollution on natural-cause mortality: an analysis of 22 European cohorts within the multicentre ESCAPE project”. The Lancet 383 (9919): 785-795. Elsevier BV. doi:10.1016/s0140-6736(13)62158-3. CO M M U N I T Y A I R M A P P I N G P R OJ EC T F O R E N V I R O N M E N TA L J U S T I C E 29
REFERENCES

     21. Park, Minhan et al. 2018. “Differential toxicities of fine particulate matters from various
     sources”. Scientific Reports 8 (1). Springer Science and Business Media LLC. doi:10.1038/
     s41598-018-35398-0.

     22. Kheirbek, Iyad et al. 2020. Air Pollution and the Health of New Yorkers: The Impact of Fine
     Particles and Ozone. Ebook. New York City Department of Health and Mental Hygiene. https://
     www1.nyc.gov/assets/doh/downloads/pdf/eode/eode-air-quality-impact.pdf.

     23. Johnson, Sarah et al. 2020. “Assessing Air Quality and Public Health Benefits of New York
     City’s Climate Action Plans”. Environmental Science & Technology 54 (16): 9804-9813. American
     Chemical Society (ACS). doi:10.1021/acs.est.0c00694.

     24. Sivadas, Lakshmi. 2019. “City unveils new design at wastewater treatment
     plant.” Hunts Point Express. http://huntspointexpress.com/2019/05/14/
     city-unveils-new-design-for-wastewater-treatment-plant/.

     25. “Hunts Point Resiliency Feasibility Study.” NYC Economic Development Corporation.
     May 2020. https://edc.nyc/sites/default/files/2020-05/NYCEDC-Hunts-Point-Resiliency-
     Study-05-2020.pdf

     26. “Hunts Point Cooperative Market: Advanced Truck Stop Electrification Project.” Clean Air
     Communities. https://www.cleanaircommunities.org/projects/huntspoint.html

     27. “NYCEDC Seeks Operator to Develop New Marine Terminal on the Hunts Point Peninsula”.
     New York City Economic Development Corporation. 22 March 2019. https://edc.nyc/
     press-release/nycedc-seeks-operator-develop-new-marine-terminal-hunts-point-peninsula.

     28. “Climate Justice Alliance Demands States Step Back from the Inequitable Transportation &
     Climate Initiative Due to Its Policy of Sacrificing Environmental Justice Communities.” Climate
     Justice Alliance. October 7, 2020. https://climatejusticealliance.org/climate-justice-alliance-
     demands-states-step-back-from-the-inequitable-transportation-climate-initiative-due-to-its-
     policy-of-sacrificing-environmental-justice-communities/

     29. “Our Air!/ ¡Nuestro Aire!” El Puente. /elpuente.us/our-air-nuestro-aire.

     30. Burrows, Leah “1 in 5 deaths caused by fossil fuel emissions.” The Harvard Gazette, February
     9, 2021. Weblink. https://news.harvard.edu/gazette/story/2021/02/deaths-from-fossil-fuel-
     emissions-higher-than-thought/?utm_source=twitter&utm_campaign=hu-twitter-general&utm_
     medium=social

30           CO M M U N I T Y A I R M A P P I N G P R OJ EC T F O R E N V I R O N M E N TA L J U S T I C E
REFERENCES 31. Muoio, Danielle “The coronavirus comeback no one wants: New York City traffic.” Politico, July 17, 2020. https://www.politico.com/states/new-york/albany/story/2020/07/17/ the-coronavirus-comeback-no-one-wants-new-york-city-traffic-1301905. 32. Ezez. 2020. “Health Equity Considerations and Racial and Ethnic Minority Groups”. Cdc.gov. https://www.cdc.gov/coronavirus/2019-ncov/need-extra-precautions/racial-ethnic-minorities. html. appendix *Appendix A. Site Selection and Monitoring: While our study was focused on environmental justice communities where our members live and work, future studies specifically designed to make comparisons (e.g. near a transfer station versus not; near a park versus not; Manhattan versus Brooklyn) would be helpful in elucidating trends relevant to policy making. For comparisons at discrete locations or times, background atmospheric and neighborhood information—such as wind direction, wind speed, and traffic conditions—may also help to directly compare air quality between locations of interest. Additionally, the time periods for mobile and stationary sampling did not always overlap and addressing this in the future would improve the ability to make comparisons. **Appendix B. Temporal Adjustments: Temporal adjustment is needed for mobile monitoring to disentangle the spatial and temporal influences on air pollution concentration levels. Without temporal adjustment, it is difficult to determine whether the measurements are high or low due to location or time. To account for background temporal trends, we first transformed the one-second AirBeam2 PM2.5 measurements into one-minute averages. Then, using data from all the state-run PM2.5 monitors located in New York City, we calculated a temporal adjustment factor, defined as the ratio of the average PM2.5 concentration level during the entire sampling period to the corresponding PM2.5 concentration for the hour in which the one-minute AirBeam2 measurement was taken. Finally, we multiplied the one-minute AirBeam2 PM2.5 measurements by the temporal adjustment factor to generate the PM2.5 values displayed on the maps in this report. ***Appendix D. Temporal Adjustments Standardized Plots: Again, we temporally adjusted the data, this time to highlight how PM2.5 concentrations vary throughout the day. In the standardized plots, hourly mean concentrations from all fixed location AirBeam2s in the neighborhood are divided by the average value during the entire sampling period. For example, a ratio value of 1.2 means the concentration at that hour is 1.2 times higher than the normal, long-term value for all AirBeam2s in the neighborhood. CO M M U N I T Y A I R M A P P I N G P R OJ EC T F O R E N V I R O N M E N TA L J U S T I C E 31
32
32   CO M M U N I T Y A I R M A P P I N G P R OJ EC T F O R E N V I R O N M E N TA L J U S T I C E
You can also read