Update of the Nutri-Score algorithm - Yearly report from the Scientific Committee of the Nutri -Score 2021 - Rijksoverheid
←
→
Page content transcription
If your browser does not render page correctly, please read the page content below
Update of the Nutri-Score algorithm
      Yearly report from the Scientific Committee of the Nutri -Score
                                   2021

The 2021 yearly report of the Scientific Committee of the Nutri-Score was voted on January 24, 2022 and
approved unanimously by the members of the ScC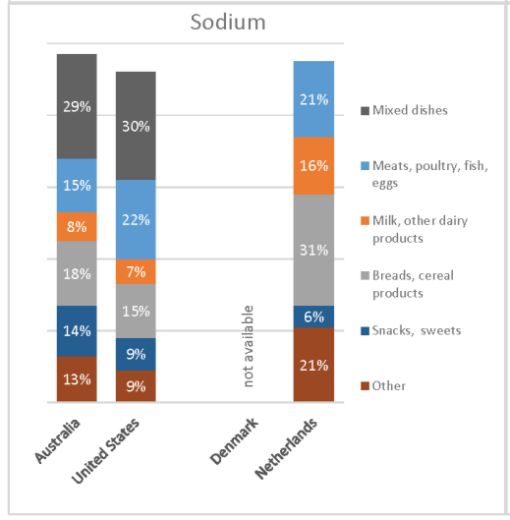
Table of contents
Executive summary ................................................................................................................................................. 4
1. Background..................................................................................................................................................... 5
  1.1     Main nutritional issues in the Countries Officially Engaged in the Nutri-Score (COEN)......................... 5
     Background information on the prevalence of nutrition-related diseases & obesity/overweight – co-
     morbidities including Type 2 Diabetes (T2D) ................................................................................................. 5
     General overview of the intakes of various nutrients and main sources that are of main public health
     concern in the COEN ...................................................................................................................................... 7
  1.2     Nutri-Score algorithm............................................................................................................................. 8
  1.3     Place of the Nutri-Score within nutritional policies in the COEN ......................................................... 10
     1.3.1 Belgium ........................................................................................................................................... 10
     1.3.2 France ............................................................................................................................................. 10
     1.3.3 Germany ......................................................................................................................................... 11
     1.3.4 Luxembourg .................................................................................................................................... 11
     1.3.5 Netherlands .................................................................................................................................... 12
     1.3.6 Spain ............................................................................................................................................... 12
     1.3.7 Switzerland ..................................................................................................................................... 13
  1.4     Front-of-pack nutrition labelling and Nutri-Score outside of COEN..................................................... 13
2    Objective of the revision of the Nutri-Score algorithm ................................................................................ 14
  2.1     Mandate of the Scientific Committee .................................................................................................. 14
  2.2     Principles guiding the revision of the Nutri-Score algorithm ............................................................... 15
3    Methods of the Scientific Committee .......................................................................................................... 17
  3.1     Identification of main areas of potential improvement ....................................................................... 17
  3.2     Review of the evidence ........................................................................................................................ 17
  3.3     Interviews ............................................................................................................................................. 18
     3.3.1 Similar algorithms ........................................................................................................................... 18
     3.3.2 Scientists from outside COEN ......................................................................................................... 18
  3.4     Stakeholders requests .......................................................................................................................... 19
  3.5     Scientific Committee procedures ......................................................................................................... 19
4    Methods for the update of the algorithm .................................................................................................... 21
  4.1     Databases for update testing ............................................................................................................... 21
     4.1.1 Origin of the data............................................................................................................................ 21
     4.1.2 Limitations ...................................................................................................................................... 22
  4.2     Methods for testing scenarios.............................................................................................................. 23
     4.2.1 Identification and definition of indicator foods .............................................................................. 23
     4.2.2 Development of scenarios for Nutri-Score algorithm update ........................................................ 23
     4.2.3 Definition of outcome variable ....................................................................................................... 24
     4.2.4 Criteria for retaining a scenario for further testing ........................................................................ 24
     4.2.5 Combination of scenarios ............................................................................................................... 24
     4.2.6 Final Nutri-Score thresholds – attribution of colours ..................................................................... 25
     4.2.7 Comparison elements ..................................................................................................................... 25
  4.3     Publication of results – recommendations .......................................................................................... 25
Task 1. Fats and oils .......................................................................................................................................... 26
  Background ....................................................................................................................................................... 26
  Related stakeholders requests ......................................................................................................................... 26
  Association with diet-related chronic diseases ................................................................................................ 27
  Conclusion ........................................................................................................................................................ 28
Task 2. Fish and seafood .................................................................................................................................. 29
  Background ....................................................................................................................................................... 29
  Related stakeholder requests ........................................................................................................................... 29
  Fish contribution in the diet ............................................................................................................................. 29
  Association with diet-related chronic diseases ................................................................................................ 29
  Conclusion ........................................................................................................................................................ 29
Task 3. Whole grain products ........................................................................................................................... 30
  Background ....................................................................................................................................................... 30
  Related stakeholder requests ........................................................................................................................... 30

2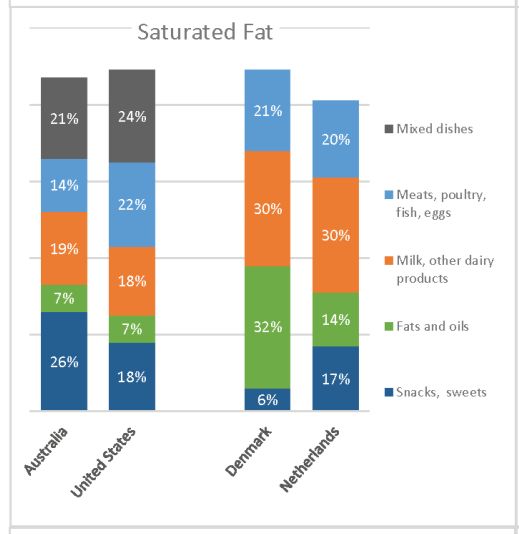
Fibre rich grain products and contribution of different food groups to fibre intake ....................................... 30
  Associations with diet-related chronic diseases ............................................................................................... 30
  Conclusion ........................................................................................................................................................ 31
Task 4. Salt........................................................................................................................................................ 32
  Background ....................................................................................................................................................... 32
  Regulatory issues .............................................................................................................................................. 32
  Conclusion ........................................................................................................................................................ 32
Task 5. Sugars ................................................................................................................................................... 33
  Background ....................................................................................................................................................... 33
  Related stakeholders requests ......................................................................................................................... 33
  Sugar consumption and main sources of sugars in the population .................................................................. 33
  Association with diet-related chronic diseases ................................................................................................ 33
  Conclusion ........................................................................................................................................................ 34
Task 6. Beverages ............................................................................................................................................. 35
  Background ....................................................................................................................................................... 35
  Related stakeholder requests ........................................................................................................................... 35
  Associations with diet-related chronic diseases ............................................................................................... 35
  Conclusion ........................................................................................................................................................ 36
Task 7. Dairy products ...................................................................................................................................... 37
  Background ....................................................................................................................................................... 37
  Related stakeholder requests ........................................................................................................................... 38
  Associations with diet-related chronic diseases ............................................................................................... 38
  Conclusion ........................................................................................................................................................ 39
Perspectives for 2022 ............................................................................................................................................ 40
References ............................................................................................................................................................ 41
Appendix 1.         Members of the Scientific Committee of the Nutri-Score ........................................................ 49
Appendix 2.         Mandate of the Scientific Committee of the Nutri-Score ......................................................... 50
Appendix 3.         Dates of meetings of the ScC .................................................................................................... 52
Appendix 4.         Stakeholders requests transmitted to the ScC.......................................................................... 53
Appendix 5.         List of abbreviations .................................................................................................................. 54

3
Executive summary
The Scientific Committee of the Nutri-Score (ScC) has been set up as one of the structures of governance of the
front-of-pack nutrition label (FOPL) Nutri-Score. It is tasked with the revision of the algorithm underlying the
Nutri-Score, to integrate new knowledge in the field of nutrition in an evidence-based approach. This
document provides an interim report on the progress of the ScC, stating the areas of potential improvement to
the system identified by the group and the methods proposed to provide an update to the Nutri-Score
algorithm.

Overall, the ScC considers that the Nutri-Score performs well. As such, while there may be areas of potential
improvement highlighted by the ScC, there is a consensus that the current version of the algorithm already
provides useful comparisons of the nutritional value of foods. The objective of the ScC is therefore to allow for
a better alignment between the classification in the Nutri-Score and national dietary guidelines.

The ScC considers modifications to the algorithm in line with the mandate provided by the Steering Committee
(StC). As such, it retains the across-the-board nature of the algorithm and the constraints over the elements
that can be included in the algorithm as principles in its proceedings.

The ScC investigates areas of potential improvement using literature reviews focusing on specific food groups
and/or dietary components, assessing their association with health outcomes or intermediary biomarkers of
nutritional and health status.

Modifications to the algorithm are investigated using pre-defined objectives for target food groups and
outcome measures (using the distribution of the final nutritional score (FNS) obtained) in several databases of
nutritional composition of foods as sold available in various countries officially engaged in the Nutri-Score
(COEN). Multiple scenarios of modification of the algorithm are investigated and evaluated in terms of gains to
the final classification of target food groups and limitations in the final classification of non-target groups
(considering the across-the-board nature of the algorithm) and/or considering the potential complexity
introduced to the system.
Final recommendations are based on scientific consensus and pre-defined voting procedures.

In 2021, the ScC has identified several areas of potential improvement, for which literature reviews were
conducted and/or potential modifications to the algorithm are under scrutiny. These pertain to improving the
scoring system for plant-based oils with favourable nutritional profiles, fish and seafood; improving
discriminating power for whole-grain products and beverages; allowing a better alignment with
recommendations for highly sugary or salty products.

4
1. Background
    1.1 Main nutritional issues in the Countries Officially Engaged in the Nutri-Score
        (COEN)
Background information on the prevalence of nutrition-related diseases & obesity/overweight
       – co-morbidities including Type 2 Diabetes (T2D)
Among the main dietary-associated non-communicable diseases (NCDs) are, in general, type 2 diabetes (T2D), a
number of cardiovascular diseases (CVD) such as coronary heart disease and stroke and some types of cancer
such as those of the digestive tract (Schulze et al., 2018). These potentially preventable diseases account for
approximatively 50% of deaths worldwide (GBD 2019 Risk Factors Collaborators, 2020). More specifically,
leading causes of these NCDs world-wide and among the 10 leading causes of death in general were ischemic
heart disease (IHD, no. 2 regarding mortality rank), stroke (ranked no. 3), chronic obstructive pulmonary
diseases (COPD,(ranked no. 6), and diabetes (ranked no. 8) (GBD 2019 Risk Factors Collaborators, 2020).

A recent Lancet paper has well summarized also the socio-economic consequences of an unhealthy diet in 195
countries, expressed as DALYs (disability adjusted life-years) (GBD 2017 Diet Collaborators, 2019). The main
diet-associated losses occurred via the intake of too much sodium (3 mio. deaths, 70 mio. DALYs lost),
insufficient consumption of whole grains (3 mio. deaths, 82 mio. DALYs) and fruits (2 mio. deaths, 65 mio.
DALYs), which compares high to e.g. DALYs lost due to ischemic heart disease (180 mio. DALYs). Similarly, a
recent study in Canada has estimated that not adhering to the recommended intake of fruits and vegetables
alone has resulted in additional health care costs (direct and indirect) of 3.3 billion Canadian dollars (Ekwaru et
al., 2017). In line with this, general estimations of WHO suggest that adhering to a sufficient fruit and vegetable
intake could prevent 31% of deaths from IHD, 19% of gastro-intestinal cancer deaths and 11% of deaths from
stroke (World Health Organization., 2002).

Predominant dietary problems, i.e. the discrepancy between dietary guidelines such as food based dietary
guidelines (FBDGs) by the WHO (World Health Organization, 2020) or, for nutrients and non-nutrients such as
by the European Food Safety Agency (EFSA, 2017) versus the observed dietary patterns include the following,
according to findings from the Lancet paper (GBD 2017 Diet Collaborators, 2019):

      •   Too high intake of dietary sodium, related to elevated risk of developing hypertension and thus
          arterial diseases and stroke;
      •   Too low intake of fruits and vegetables;
      •   Too low intake of whole-grain products;
      •   Too low intake in nuts and seeds
      •   Related to the latter 3 points, a too limited intake of dietary fibre, which contributes to lower blood
          cholesterol and reduced risk of digestive cancers;
      •   Too high intake of free/added sugars, such as via sweetened beverages;
      •   Too high intake of red meat and also processed meat, which has been associated in several meta-
          analyses to several cardio-metabolic diseases, including T2D;
      •   Related to the latter aspect, too high intake of saturated fatty acids vs. rather unsaturated fatty acids,
          especially seafood omega-3 fatty acids, likewise increasing the risk of cardio-metabolic diseases;
      •   Risk of too high intake of trans-fatty acids;
      •   Too few milk products (and related low calcium intake).

A major challenge related at least in part to dietary patterns are also the increasing numbers of people with
overweight and obesity, as obesity is associated with many co-morbidities, most notably T2D, stroke, CVD and
non-alcoholic fatty liver disease, among other (Guh et al., 2009). These still increasing trends are observable in
most countries of the EU, including the COEN (Table 1). In parallel, diabetes prevalence (T2D) as a main co-

5
morbidity of obesity also remains high (Table 1). Finally, the number of children with obesity remains high
(Table 2).
Table 1. Brief summary of prevalence of overweight and obesity in adults living in COEN of the EU (World
Obesity, 2022a), as well as prevalence of diabetes among adults (T2D and T1D) (International Diabetes
Federation, 2021).
Country (year) Age category Prevalence Prevalence obesity Diabetes prevalence
overweight, (BMI>30 kg/m2), % (%)
including obesity
(BMI>25 kg/m2), %
Belgium (2019) 18+ 50.2 16.3 3.6
France (2019) 18+ 47.1 15.0 5.3
Germany (2019) 18+ 53.5 19.0 6.9
Luxembourg (2019) 18+ 48.4 16.5 5.9
The Netherlands (2020) 20+ 51.1 14.2 4.5
Spain (2019-20) 15+ 53.8* 16.0* 10.3
Switzerland (2014-15) 18-75 43.3 12.6 4.6
*average of males and females taken as global mean was not reported
Table 2. Prevalence of overweight and obesity in children (World Obesity, 2022b) in COEN.
Country (year) Age category (y) Prevalence overweight Methods
including obesity (%)
Belgium (2018) 2-17 18.8 WHO
France (2016) 7-9 16.5 IOTF
Germany (2014-7) 3-17 24.0 IOTF
Luxembourg (2017-8) 15 22.0* WHO
The Netherlands (2020) 4-12 13.2 IOTF
Spain (2019 6-9 40.6 WHO
Switzerland (2017-8) 6-12 15.9 CDC
*average of girls and boys taken as global mean was not reported
6General overview of the intakes of various nutrients and main sources that are of main public
health concern in the COEN
Various reports have looked at the major food groups and their contribution to nutrient and non-nutrient
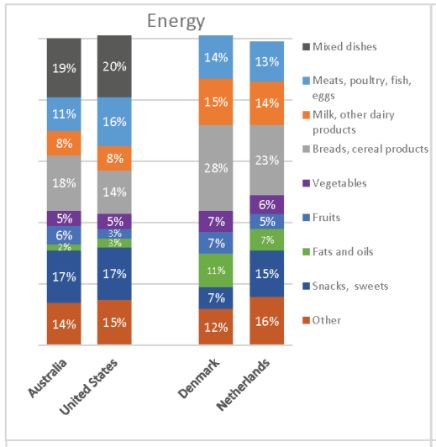
(dietary fibre and energy) intake. A typical scenario for a European COEN country is shown in figure 1.
Figure 1 – food group contributors to energy, saturated fat and sodium, for the Netherlands as a COEN –and
additional countries, from 2015, taken from (Auestad et al., 2015).
The following presents a brief overview about the contribution of food groups to the intake of energy, saturated
fats, total fats, sodium, total sugar and dietary fibre:
Energy: Energy intake is not so much dominated by a specific food group, with major contributing food groups
being typically (in Westernized countries) breads and cereals, followed by others, snacks and sweets, milk and
dairy products, and meat and eggs (figure 1).
Saturated fat: it is apparent that for countries with a rather dairy-based agriculture, such as the Netherlands,
milk and dairy products are significant sources of saturated fats, followed by meat and fats and oils. However,
this is similar to other Westernized countries, with a large variable contribution from the group “snacks and
sweets” (figure 1).
Sodium: For this mineral, major contributing food groups include breads and cereal products, followed by meat,
fish and eggs, as well as other/diverse products (figure 1).
Total fats: According to a study in 15 EU countries (Eilander et al., 2015), major food group contributors to the
intake of the most energetic macronutrients were added fats and oils (which contributed 9–46% to total fat
intake across countries), meat and meat products (17–26%), and dairy (11– 24%). In the UK, Finland, and the
Netherlands, also cereals and cereal products contributed substantially to total fat intake (10–18%).
Total sugar: According to a study from 2017 (Azaïs-Braesco et al., 2017) with data from France, Belgium, and the
Netherlands, main food groups contributing to total sugar intake entail sweet products (27-34%), beverages (15-
30%), fruits and vegetables (11-25%), as well as dairy products (14-19%).
Dietary fibre: Main sources, according to a publication from 2017 (Stephen et al., 2017) of dietary fibre include,
in European countries such as Belgium, France, Spain and the Netherlands typically the food groups grain
products and breads (ca. 30-50%), potatoes (6-18%), vegetables including legumes (15-32% ) and fruits (11-23%).
7Proteins: For proteins, major contributing food sources in Europe were meat and meat products, followed by
grains and grain-based products, and milk and dairy products. These three food groups contribute to about 75 %
of the protein intake (EFSA Panel on Dietetic Products, Nutrition and Allergies (NDA), 2012)
A good guidance emphasizing the importance of various food groups is given within a recent draft document
produced by EFSA, dealing with front-of-pack nutrient profiling, which was under public consultancy until January
9, 2022 (EFSA Panel on Nutrition, Novel Foods and Food Allergens (NDA), 2021). The food groups highlighted in
the same document, playing an important though varying role in the diet of European countries include:
• starchy foods (cereals and potatoes),
• fruits and vegetables,
• legumes and pulses,
• milk and dairy products,
• meat and meat products,
• fish and shellfish and products thereof,
• oils and fats,
• nuts and seeds,
• and non- alcoholic beverages, as recognised in FBDGs in Member States.
Various nutrients and non-nutrients and their potential for inclusion in for front-of-pack nutrient profiling are
likewise discussed and it is again highlighted that certain food groups and nutrients are either under or over-
consumed, including the following:
• whole grains, fruits and vegetables, nuts and seeds, fat-reduced milk and dairy products, fish and
water intake is encouraged, whereas food products high in SFAs, sugars and/or sodium owing to food
processing are generally discouraged,
• regular consumption of legumes and pulses instead of meat, especially red meat and processed meat,
is encouraged,
• the consumption of vegetable oils rich in cis-MUFAs and cis-PUFAs instead of fats high in SFA and
trans-fats is advised,
• dietary intakes of SFAs, sodium and added/free sugars are above current dietary recommendations in
a majority of European populations; a decrease in intake is advised,
• intakes of dietary fibre and potassium are below current dietary recommendations in a majority of
European adult populations, their intake is encouraged.
1.2 Nutri-Score algorithm
The algorithm underpinning the Nutri-Score is an adaptation to front-of-pack nutrition labelling (FOPL) of the
2005 Office of Communication – Food Standards Agency nutrient profile model, developed for the purpose of
regulating advertising to children in Great Britain.
The initial development of the algorithm was conducted by an independent research team from Oxford, taking
into account the main nutrients of concern in the dietary patterns of the United Kingdom. The initial
development of the algorithm considered multiple adjustments and modelling in order to select the most
appropriate model (Rayner et al., 2005).
The algorithm strives on one hand to limit the intake of certain nutrients and non-nutrient components from
the diet – namely energy, saturated fatty acids, sugars and sodium – and on the other hand to encourage the
intake of other nutrient and non-nutrient components from the diet – namely fruits, vegetables, pulses and
nuts, fibres and proteins (Rayner et al., 2009). Of note, proteins were integrated in the algorithm at a
8secondary stage, as the initial nutrient profile model considered instead n-3 fatty acids, iron and calcium. Proteins were integrated as a proxy for calcium and iron, following discussions on the feasibility and burden to stakeholders of including elements that were not part of the nutrient declaration at the time (Rayner et al., 2005). The FSA-OfCom model has been adapted for the purpose of FOPL in the COEN (as a basis for the Nutri-Score) and in Australia and New-Zealand, for the purpose of regulating health and nutrition claims in Australia, New Zealand and South Africa, and for the purpose of regulating advertising to children in the United Kingdom and Ireland (Labonté et al., 2018). The adaptation of the original algorithm for the purpose of a FOPL system in the form of the Nutri-Score was conducted by an independent group at the French High Council for Public Health in 2015 (Haut Conseil de la Santé Publique, 2015). The review of the algorithm included specific adaptations pertaining to three food groups: beverages, fats and oils and cheeses. The High Council for Public Health also defined the thresholds for the allocation of the ‘colours/letters’ to the Nutri-Score. The adaptations from the High Council for Public Health were integrated in the final algorithm in 2015. Of note, a specific opinion from the French Food Safety Agency in 2019 added to the list of ingredients qualifying for the “fruits, vegetables, pulses and nuts components” certain oils that were considered as favourable in the French dietary guidelines – namely olive, canola and nut oils (ANSES, 2019). Considering the nutrient and non-nutrient components of concern identified in the recent report by EFSA on nutrient profiling currently under public consultation (until January 9 th, 2022), the algorithm of the Nutri-Score is consistent with the main recommendations from the Panel on Nutrition, Novel Foods and Food Allergens (NDA) of EFSA (EFSA Panel on Nutrition, Novel Foods and Food Allergens (NDA), 2021). Saturated fatty acids, added/free sugars, sodium and energy were all considered by EFSA among the nutrients and non-nutrients for which a limitation of intake is warranted in most European populations. Of note, while the EFSA Panel considered that added/free sugars were the main component of concern, total sugars were considered an adequate proxy, in particular in the case of category-based nutrient profile models. As to elements considered favourable to health, the EFSA Panel identified fibres as a non-nutrient component of concern with inadequate intakes in most European countries, as well as iron and calcium in sub-groups of the population. Considering that proteins were included in the algorithm as a proxy for both iron and calcium, there appears again to be a consistency between the nutrients identified as of concern and the Nutri-Score algorithm. Of note, other favourable nutrient and non-nutrient components identified by the EFSA Panel are not included in the Nutri-Score algorithm, such as long-chain n-3 fatty acids (eicosapentaenoic acid – EPA – and docosahexaenoic acid – DHA), potassium, iodine, vitamin D and folates. These components are not included in the mandatory nutrient declaration. Most of them can appear as a voluntary addition by the manufacturer under the EU1169/2011 regulation, but only if they reach a sufficient concentration. As to EPA and DHA, they are not mentioned among the components that can be added in the nutrient declaration, either as mandatory or voluntary elements. Validation studies conducted for the Nutri-Score have shown that the nutrient profile model underpinning it (termed FSAm-NPS DI for Food Standards Agency modified Nutrient profile model dietary index) was able to characterize the diet quality of individuals (Deschamps et al., 2015; Julia et al., 2014, 2016). As an indicator of the nutritional value of the foods consumed - using the algorithm underpinning the Nutri-Score, this dietary index in general increases with decreasing nutritional quality of the foods consumed. The dietary index was found to be associated in the expected direction (i.e. negatively) regarding the consumption of fruits, 9
vegetables, pulses and fish, and (positively) with the consumption of sugary and salty snacks and soft drinks.
Importantly, the dietary index was associated with intakes of vitamins and minerals (other than sodium) at the
diet levels, while the algorithm itself does not take those into account directly in the evaluation of the
nutritional value of foods.

Finally, the validation of the nutrient profile model showed that a dietary index based on the nutrient profile of
the foods consumed was associated with an increased risk of weight gain and nutrition-related non-
communicable diseases. Initial results in France (NutriNet-Santé and SU.VI.MAX cohorts) were replicated in
multiple countries, in particular in the Spanish ENRICA and SUN cohorts and in the EU-wide EPIC cohort study.
The nutrient profile was found to be significantly associated with mortality (overall and specific mortality
(Deschasaux et al., 2020)), cancer overall and specific locations of cancer (breast, colo-rectal cancer in
particular) (Deschasaux et al., 2017, 2018; Donnenfeld et al., 2015), cardiovascular disease (CVD) (Adriouch et
al., 2016, 2017; Donat-Vargas et al., 2021; Gómez-Donoso et al., 2021), metabolic syndrome (Julia, Fézeu, et al.,
2015) and weight gain (Egnell et al., 2020; Julia, Ducrot, et al., 2015).

Finally, the use of Nutri-Score was estimated to have the potential to contribute substantially to a reduced
burden of nutrition-related non-communicable diseases in France using a simulation model (Egnell et al., 2019).

Overall, these elements suggest that the algorithm underpinning the Nutri-Score includes relevant elements
with regards to dietary balance and health and that the overall structure of the algorithm is valid.

    1.3 Place of the Nutri-Score within nutritional policies in the COEN
1.3.1 Belgium1
In Belgium, policies related to healthy diets are a joint responsibility of the federal as well as regional
governments. At federal level, Belgium has developed a Nutrition and Health Plan in 2006.The most recent
actions of this Plan, that target, among others, overweight and obesity, are: 1) a Convention for a Balanced Diet
(Category-specific commitments by the food industry in Belgium to reduce sodium, sugar, saturated fat and
energy in food products within specific food categories) since 2016, 2) Adoption of the Nutri-Score logo since
April 2019, 3) a tax on soft drinks (since 2016, the Belgian government applies an excise duty of 0,0743
eurocents per liter to all soft drinks, including non-alcoholic drinks and water containing added sugar or other
sweeteners or flavours). In addition, already since 1985, the legislation in Belgium establishes a 2% maximum
salt content in bread. Flanders (since 2008) and the Federation of Wallonia-Brussels (since 2013) both have
voluntary guidelines with food-based standards for foods available in schools, including restrictions on (deep)
fried food, sweet treats and soft drinks.

1.3.2 France
The Nutri-Score was developed initially in France in the framework of the French National Nutrition and Health,
a national program under the umbrella of the French Ministry of Solidarities and Health initiated in 2001 and
supervising all nutrition-related public health policies.

The Nutri-Score acts both at the individual level and at the environmental level though the reformulation of
products, which could lead to an overall improvement of the food offer. At the individual level, the Nutri-Score
operates as a complementary measure to the dietary guidelines, which were updated in 2017 in France, aiming
for the first time at taking into account both nutritional and environmental elements of dietary behaviour.

1
    This paragraph was amended following feedback from the steering committee.

10
At the environmental level, the Nutri-Score is complementary to other actions such as the prohibition of
vending machines in schools (2005) or the taxation of sugar-sweetened and artificially-sweetened beverages
(2012, updated in 2018). Targets for reformulations of products are also under development, to ensure an
improvement of the food offer.
National policies in the framework of the French Nutrition and Health program are evaluated every five years
by the French High Council for Public Health, whose mandate includes setting nutritional objectives at the
population level for the subsequent five years and provide an outline of the main axes of nutritional policies to
be implemented to achieve these goals in the population. The main orientations are then selected and
integrated at ministerial level in a blueprint report.
One of the goals of the new French National Nutrition and Health program (2019-2023) is to extend the Nutri-
Score to the products consumed out of home and foods sold in bulk. Experiments and discussions with
stakeholders are ongoing to define how to use the Nutri-Score in these particular contexts.
1.3.3 Germany
In Germany, several holistic steps were implemented within the last years:
With the IN FORM initiative, the Federal Ministry of Food and Agriculture promotes healthy living. IN FORM
pools together projects on healthy lifestyles from across Germany and provides information on good dietary
practices for all spheres of life – from nutrition for children at school and kindergarten, to balanced diets for
women during pregnancy, people at work and the elderly.
On behalf of the Federal Ministry of Food and Agriculture, the German Nutrition Society (DGE) developed
quality standards and criteria for health-promoting, balanced and sustainable community catering.
The implementation of the National Reduction and Innovation Strategy started at the beginning of 2019. The
food sector has committed itself to achieve specific reduction targets by 2025 – with a special focus on
products targeted at children and adolescents. The overall aim is that processed foodstuffs contain less energy,
sugar, fats and salt, but still have sufficient nutrients such as vitamins and minerals.
Furthermore, a ban on the addition of sugar, honey, fruit juice (concentrate), malt extract or other syrups or
thick juices derived from plant-based foods to infant and young child teas was adopted together with the
mandatory indication to purchasers and users that sugar and other sweetening ingredients should not be
added during preparation or administration.
With the implementation of the FOPL system Nutri-Score in 2020, Germany joined the COEN and enabled food-
producers to use this FOPL on their products. Together with the food-based dietary guidelines (FBDGs) of the
DGE, the Nutri-Score could support consumers in their informed choice regarding a favourable and health-
conscious food choice.
1.3.4 Luxembourg
Luxembourg has summarized its position regarding nutrition and health goals in a statement published by the
Ministry of Health (Vers un plan national alimentation saine et activité physique, n.d.). Furthermore, a national
activity plan (created by the Ministries of Health, Sports, Education and Family) supporting such
recommendations has also been published, namely the « Gesond iessen, méi bewegen Plan Cadre National
2018-2025 (Présentation du Plan cadre national ‘Gesond iessen, Méi bewegen’ 2018-2025, n.d.).
Two major objectives (regarding diet) have been highlighted, being
a) the creation of an environment stimulating a balanced diet and
11b) the improvement of the competences required to adapt a balanced diet. This entails food-based recommendations for specific population groups, i.e. children, adults, etc. based on the recommendations of the EFSA and WHO (regarding the intake of macronutrients as well as some further general recommendations (key elements), emphasizing that the availability and affordability of healthy food items should be increased). It will also be strived to regularly update these national dietary recommendations (Besoins nutritionnels de chacun, n.d.). 1.3.5 Netherlands2 In the Netherlands, relevant policy on food and nutrition is the responsibility of the Ministry of Health, Welfare and Sport (nutrition and food safety) and the Ministry of Agriculture, Nature and Food Quality (sustainability and food security). An important policy document related to overweight and nutrition is the public private National Prevention Agreement (NPA) (2019–2040) to which over 70 parties committed to a ‘healthier Netherlands’, including a target to reduce the prevalence of overweight, by 2040, to 1997 levels. With the new government (January 2022), new progress will be made, e.g. the introduction of a soft drinks tax is announced in the coalition agreement. At the food level, apart from EU regulations national food legislation rules apply (e.g. salt and fibre contents of bread) and public procurement schemes for foods. Introduction of a single food logo is one of the actions of the NPA. The decision on the introduction of Nutri-Score will be made after the evaluation of the algorithm by the scientific committee and Health Council. Within the Prevention agreement The National Approach to Product Improvement (Nationale Aanpak Productverbetering, NAPV) is set to start in 2022. This approach is intended to speed up the improvements to processed food composition that are already under way due to previously made agreements. Benchmarks (at three levels- low, middle, high) are established for contents of salt, sugar, saturated fat and fibre for major contributing foods. Producers are incentivized to produce foods with lower levels of saturated fat, sugar and salt. The benchmarks will be aligned with the Nutri-Score algorithm as much as possible. For consumer-oriented action on choosing healthy and sustainable foods current dietary policy is centred around dietary recommendations. The evidence based food-based dietary guidelines (Health Council of the Netherlands, n.d.) are translated into practical recommendations for the lay public by the Netherlands Nutrition Center. The main visual scheme framework used for this translation is the Wheel of Five. The Wheel of Five applies a dichotomous scheme and indicates for specific food groups which foods are recommended to be consumed (i.e. are within the Wheel of Five) and in what amounts and which foods are considered discretionary foods (i.e. are outside the Wheel of Five). 1.3.6 Spain The Spanish Agency for Food Safety and Nutrition (AESAN) of the Ministry of Consumer Affairs launched in 2005 the NAOS Strategy -Strategy for Nutrition, Physical Activity and Obesity Prevention-, aimed to reverse the trend in the prevalence of obesity through the promotion of a healthy diet and physical exercise. NAOS Strategy was reinforced in 2011 by Law 17/2011, on food security and nutrition. The main strategic lines are: Health protection facilitating access to a varied and balanced diet with a moderate intake of calories, fat, sugar and salt; promoting food reformulation; improving information to consumers such as through FOPL, and reducing the pressure of food marketing to minors; Health promotion about a healthy and varied diet and 2 This paragraph was amended following feedback from the steering committee. 12
physical activity: NAOS official website, Informative campaigns, Publications, NAOS Annual Convention and the
NAOS Strategy Awards; Multisectoral collaborative activities through coordination and cooperation between
national, regional and local administrations; Monitoring and evaluation through the Observatory of Nutrition
and for the Obesity Study.
In 2021, related to FOPL Nutri-Score AESAN has participated in the international structures for the governance,
launched an official registration and information web site and an information campaign. Other ongoing
activities are: Draft of a specific regulation to limit food and drink advertising aimed at children; Evaluation of a
four-year Plan for the improvement of the composition of food and drink products; A study on the socio-
economic dimension of childhood obesity; A programme to monitor the nutritional quality of school menus,
vending machines and school canteens; Other actions planned in 2022 are the development of the "Healthy
Meal Plate" and the updating of the Spanish Nutritional Pyramid for the dissemination of food-based
recommendations and the adoption of nutritional quality and sustainability criteria in public procurements in
schools and other centres dependent on public administrations.
1.3.7 Switzerland
The Swiss Nutrition Policy 2017–2024 is intended to make an important contribution to the national policy for
preventing non-communicable diseases (NCDs) 2017–2024 (NCD Policy). Its vision is that all people can decide
in favor of a balanced and varied diet. They should have a framework that enables them to maintain a healthy
lifestyle on their own – regardless of their background, socio-economic status or age. Three goals were defined
as part of the Swiss Nutrition Policy 2017-2024:
- Increase nutritional competences: the general public should be familiar with nutritional
recommendations. The information about these should be available, easy to understand and simple to
implement in everyday life.
- Improve the framework conditions: In order to facilitate the choice of healthy foods, there must be a
corresponding offering.
- Integrate the food industry: Ever more producers and suppliers of foodstuffs and meals are making a
voluntary contribution to healthy nutrition.
An action plan implements the strategy through various measures in four fields of action: 1. Information and
education, 2. Framework conditions, 3. Coordination and cooperation, 4. Monitoring and research.
One priority of the first action field is assistance in choosing food products by promoting the clarity of food
labelling. By helping consumers to choose healthy foods, the Nutri-Score represents an important element of
the Swiss Nutrition strategy. The Swiss authorities supports its introduction since Sept 2019.
All countries having adopted the Nutri-Score agree on the efficiency of the system and its broad alignment with
national nutritional policies. Overall, in all COEN, the Nutri-Score operates as a complementary measure to
dietary guidelines or other nutritional policies, and is only one of the multiple strategies put forward to
improve the nutritional status of the population. The ScC recognizes therefore the importance of considering
the overall framework in which the Nutri-Score operates, which includes multiple avenues to accompany the
implementation of the Nutri-Score, in particular in terms of population education to its use and potential
limitations.
1.4 Front-of-pack nutrition labelling and Nutri-Score outside of COEN
The Nutri-Score is one of the FOPLs currently implemented in the EU. In the framework of the farm to fork
strategy (European Commission, 2020), the European Commission is currently making an evaluation of the
13various FOPLs implemented in the region, with a review of the evidence on their effectiveness by the Joint
Research Centre (JRC) in 2020 (European Commission. Joint Research Centre., 2020) and a review of the
potential nutrients to be included in a nutrient profiling system that could be used to underpin a harmonized
FOPL for European countries by EFSA (EFSA Panel on Nutrition, Novel Foods and Food Allergens (NDA), 2021),
under public consultation up to January 9, 2022.
The European Commission is expected to decide upon a harmonized and mandatory FOPL for the EU by the
end of 2022, following an impact assessment (Proposal revision Regulation of FIC, n.d.).
The Scientific Committee welcomes the assessment of the EU commission of various types of labels, and
recognizes the potential of the Nutri-Score to be among the contenders for a harmonised and mandatory
system across the EU. The report from the JRC highlighted the research effort behind Nutri-Score, and the fact
that its implementation is supported by substantial evidence of its preference in consumers but also its
performance in terms of objective understanding and effects on purchases and purchasing intentions. The
EFSA’s NDA Panel opinion – though under public consultation at the time of publication of this report – also
showed consistency between the nutrients and non-nutrient components identified as of concern in the EU
and the elements included in the algorithm underpinning the Nutri-Score.
As such, while currently only COEN have adopted the Nutri-Score, the Scientific Committee understands the
necessity of an assessment of the potential modifications to the Nutri-Score beyond its current geographical
scope, considering the context in which this assessment is being made. This could include impact assessment in
other countries if databases of nutritional composition are available – and if resources are allocated to allow
for such an expansion of the scope of the ScC work – and/or the interviews of scientists outside of COEN to
understand their concerns over the Nutri-Score algorithm or areas of improvement that they would consider as
a priority.
2 Objective of the revision of the Nutri-Score algorithm
Regular evaluation of the Nutri-Score is embedded within its regulatory framework. Evaluation of a public
health policy is considered a standard good practice implemented in all fields. Dietary guidelines or nutritional
recommendations are revised regularly against scientific developments so as to integrate new knowledge and
rely on the highest possible level and quality of evidence.
As such, the revision of the Nutri-Score algorithm is necessary to take into account new knowledge on the
relationship between nutrient and non-nutrient components of the diet and health. Considering that the initial
nutrient profile model was developed in 2004-2005 and adapted for FOPL in 2015, with first implementation in
2017, it appears also necessary to confront it with the reality on the ground and potential limitations that may
have arisen since its implementation in the real world.
The Steering Committee provided to the Scientific Committee a mandate for the revision of the algorithm that
included elements pertaining to the perimeter and objectives of the revision of the algorithm.
2.1 Mandate of the Scientific Committee
The ScC accepted the mandate of the Steering Committee and started its work in February 2021.
The elements included in the scope of the mandate are the following: To
− study the whole body of scientific knowledge in the field of nutrition and health, in view of
new data that may impact the computation of the algorithm
− study the scientific rationale for any request for a Nutri-Score update transmitted through the
Steering committee.
14− study the scientific rationale for also any request received from the food industry, consumer
associations and other stakeholders, which are transmitted by the Steering committee and
deemed relevant by the Scientific committee. The Scientific Committee may, on an ad hoc
basis, elect to invite experts from a non-COEN country to meetings dealing with specific
issues, when that non-COEN country has expressed interest in the subject of the meeting for
the purpose of its better understanding of the Nutri-Score.
− conduct corresponding literature reviews to assess the evidence of said request.
− propose to the Steering committee evidence-based adjustments, if relevant, to the nutrient
profiling system of Nutri-Score, taking into account scientific knowledge and public health
issues in the nutritional field, in synergy with the food-based dietary guidelines.
Of note, the Steering Committee posed specific boundaries as to the potential modifications that could be
undertaken by the ScC, as follows – and presented as examples: To
− elaborate new nutritional recommendations.
− modify the core principles of Nutri-Score algorithm based on the FSA score or other core
elements of the Nutri-Score (e.g. the algorithm cannot consider nutrients that are not part of
the nutritional declaration such as vitamins or minerals; the calculation will remain per 100
grams or 100 millilitres and not per portion, and should remain transversal to all product
categories, except for products like cheeses, beverages and added fat for comparability
reasons).
− modify the graphical format.
− carry out communication activities related to the opinions and activities of the ScC except if
mandated expressly and in writing by the Steering committee.
The full mandate of the ScC is included as an Annex to this report (Appendix 2).
The ScC committed to investigate modifications to the algorithm within the mandate stated by the Steering
Committee.
2.2 Principles guiding the revision of the Nutri-Score algorithm
In line with the mandate set by the Steering Committee, a series of principles were maintained in the revision
process of the Nutri-Score algorithm by the ScC.
The ScC agreed to the following principles:
1. Adherence to the scope and mandate of the Steering Committee
The Nutri-Score system is generally performing well in regards to its objective. It is overall aligned with the
main recommendations from EFSA and has been found to be useful to guide consumers towards healthier food
choices. As such, while a revision of the algorithm underlying the Nutri-Score should aim at improving it, it must
be stated that the current version of the label is already overall well aligned with national dietary guidelines of
the COEN.
2. Evidence-based approach to the revision of the algorithm
The ScC investigated priority areas of improvement to the algorithm that were identified by its members or
highlighted by the Steering Committee (based on stakeholders requests) and justified by the scientific
literature. Reviews of the evidence in specific cases were either conducted directly in the group or
commissioned to outside parties (see Review of the evidence below).
153. Preference for simple across-the-board scenarios of modification
Areas of improvement to the algorithm were generally identified in specific food groups. This is particularly the
case for stakeholder requests that usually cover the specific industry sector where the manufacturer operates.
However, in line with the mandate from the Steering Committee, the Nutri-Score algorithm should maintain an
across-the-board approach. The ScC therefore considered preferentially modifications to the algorithm that
would be across the board rather than specific exception and exemption rules for specific products or groups.
4. Constraints to scenarios for modifications in the algorithm
Modifications to the algorithm considered elements within the nutritional declaration, and in particular the
mandatory information available. As requested in the mandate, addition of components was not considered as
good practice for the revision of the algorithm, as well as changing drastically the structure of point allocation
within the overall scoring system.
Of note, in very specific cases, the ScC explored modifications outside the scope of the mandate. These were
undertaken only when the ScC considered that exploring other elements would be useful to have a full view of
the possible approaches to the issue.
5. Nutri-Score as one of many policies to address nutrition-related diseases
As stated previously, the Nutri-Score is only one of many policies developed in COEN to address the burden of
nutrition-related diseases. Its main purpose is to guide consumers towards healthier choices and industry
towards food reformulation within food groups. As such, it cannot be considered as the sole source of dietary
advice and is intended to complement dietary guidelines, which provide the overarching structure of the diet,
in particular the recommended frequency and amount for the main food groups.
163 Methods of the Scientific Committee
3.1 Identification of main areas of potential improvement
The main areas of potential improvement for the algorithm of the Nutri-Score were identified using a
combination of elements:
− Elements highlighted by the Steering Committee of the Nutri-Score as priority areas for the ScC to
consider
− Confrontation of the Nutri-Score with national policies and in particular dietary guidelines
− Confrontation of the Nutri-Score classification with the composition of foods in different countries,
taking into account both average compositions of specific types of foods and distribution of foods
within larger categories of foods
− Literature reviews pertaining to novel elements in the association between nutrition and disease
outcomes of markers thereof
− Stakeholder requests
The areas of improvement of the algorithm pertained essentially to large food groups. Hence, the investigation
was conducted separately for several food groups as well as for specific nutrients. However, the ScC
systematically explored the impact of a modification for a given food group in the more general context of the
classification of foods. Indeed, as the algorithm for the Nutri-Score is across-the-board, any modifications for
one food group may affect others.
Furthermore, the ScC investigated across-the-board modifications to the algorithm, once a specific scenario
was considered appropriate in terms of delivering enough discrimination in food groups specially highlighted in
relation to each component.
Of note, the identification of areas of improvement did not necessarily lead to a modification of the algorithm.
In particular, only elements that would be based on strong scientific evidence were considered for a
modification of the algorithm.
3.2 Review of the evidence
The assessment of the scientific literature on the topics covered by the ScC aimed to elucidate if, for certain
food groups, the Nutri-Score results were aligned, in a broad sense, with current scientific evidence on their
health effects or with recommendations of intake in FBDGs. Of particular interest was the ascertainment of the
health effects of each food relative to the effects of other foods within the same category (e.g., one vegetable
oil versus the other vegetable oils, or skimmed versus full fat dairy products).
The ScC has mainly summarised and discussed scientific evidence from previous systematic reviews and meta-
analyses (MA), where available, complemented with recently published studies. The ScC particularly focused on
systematic reviews and evidence reviews supporting dietary guidelines; these reviews included both
observational studies and randomized clinical trials (RCTs), using short-term-biological outcomes (i.e. surrogate
markers) as well as long-term disease outcomes.
The reviews conducted by the ScC were not based on a registered review protocol, and did not include a formal
systematic assessment of the grade of evidence, as the time frame and the resources available determined
these procedures out of the scope of the ScC.
A systematic review and meta-analysis of the health effects of vegetable oils was conducted by an external ad-
hoc Spanish scientific group and was presented by the Spanish members of the ScC.
17You can also read