URBAN GULL SURVEY: Highlights from the 2018 Survey in Birmingham
←
→
Page content transcription
If your browser does not render page correctly, please read the page content below
URBAN GULL SURVEY:
Highlights from the 2018 Survey
in Birmingham

        1. INTRODUCTION

Often referred to collectively as “seagulls” by members of the public, the breeding distributions of gulls in
the UK have historically largely been restricted to sites on or near the coast. However, the distributions of
Herring Gulls and Lesser Black-backed Gulls, in particular, have changed substantially over the last 50 years,
and increasing numbers now breed on rooftops in urban areas, sometimes far inland. Many of these birds
may feed exclusively in terrestrial habitats, whilst others nest in towns and cities but make more
‘traditional’ foraging trips out to sea.

The 2018 Urban Gull Survey in Birmingham was the first stage of a two-year project supported by Defra.
We would like to thank all volunteers in the Birmingham area who took part in the ground level surveys for
your interest and valuable contributions to the survey. In particular, we thank Steve Davies, BTO Regional
Representative for Birmingham and the West Midlands, who co-ordinated the survey coverage.

Volunteers in Birmingham contributed an impressive total of 113 hours observation time to carry out
surveys, covering 80 1-km squares, and counting a total of 284 Herring Gulls and 1,290 Lesser Black-backed
Gulls. The data from these surveys (together with those from 2019 in North Wales) will be compared with
data from aerial surveys and vantage point surveys to help us understand how we can monitor gulls nesting
in urban areas and produce robust population estimates from ground level counts.

        2.   OVERALL PROJECT AIMS

The UK is of international importance for many seabird species, and has international obligations (e.g.
under the Bern Convention and EU Birds Directive) to protect their populations. To inform policy regarding
gull conservation, and as part of the current national ‘Seabirds Count’ census of the UK and Ireland
(http://jncc.defra.gov.uk/page-7483), there is a need for robust population estimates of breeding gulls,
including those nesting in urban environments.

Presently, however, methods to estimate populations of urban breeding gulls across large spatial scales are
unproven. This study aims to evaluate the use of surveys from the ground as a means of determining
populations. As the probability of detecting nesting gulls in an urban environment from the ground may be
low and variable, the study aims to assess this variation, and to calculate a correction factor, if possible, to
enable ground level counts to be used to generate breeding population estimates.

The project aims to assess and account for the limitations of different survey methodologies using a two-
step approach to provide estimates of numbers of Apparently Occupied Nests (AONs) of two gull species,
Herring Gull Larus argentatus and Lesser Black-backed Gull Larus fuscus, within two different areas: (1)
Birmingham (in 2018) and (2) North Wales (in 2019). Analyses will provide: (i) a comparison of ground-
based counts, aerial counts and vantage point counts and (ii) population estimates with confidence limits
for two study areas (Birmingham Metropolitan District in 2018 and North Wales in 2019), incorporating
correction factors and estimated confidence ranges (note that these population estimates will be produced
after the surveys in both study areas have been completed, so population estimates are not included in this
interim summary produced for volunteers in Birmingham). The project is being undertaken by the BTO and
Hi-Def Aerial Surveying Limited on behalf of Defra.
3. SURVEY METHODOLOGY

3.1. Tetrad/1-km square selection for the 2018 Surveys

We selected tetrads from the Birmingham City Council metropolitan district boundary, rather than the
wider West Midlands area. One sample tetrad was subsequently dropped from the final sample and
replaced by random selection as it could not be covered by the digital aerial survey due to its proximity to
the Birmingham International Airport. Using a stratification of urban habitat which was developed for the
purposes of this study, to ensure that it would be suitable for a national survey, 1-km squares within the
selected tetrads were assigned to four strata: one dominated by ‘suburban’, one dominated by ‘industrial’,
one with a mix of ‘suburban and industrial’ and one with a mix of all three habitats, but the most ‘urban’.

3.2. Ground level surveys

Ground level surveys were undertaken by volunteers, co-ordinated by the BTO's Regional Representative
for the Birmingham area (Steve Davies). Surveyors were asked to undertake survey visits entirely at ground
level, without undertaking any surveying from higher level vantage points, even if buildings with vantage
points were publicly accessible. A single survey was carried out in each 1-km square, in May or June. The
vast majority of surveys were carried out between 13th May and 9th June. Surveyors were asked to check all
suitable habitat within the 1-km square boundary (i.e. primarily urban rooftops) and count the numbers of
apparently occupied nests, apparently occupied territories and individuals for both Herring Gulls and Lesser
Black-backed Gulls.

3.3. Vantage point surveys

The vantage point surveys were undertaken by staff from Natural England and Defra, with most visits being
carried out on 4th or 5th June 2018. Surveys were carried out from vantage points from which the surveyors
were able to observe the activity of gulls on nearby rooftops. The aim of the vantage point surveys was to
obtain comprehensive counts, with the expectation that bird behaviour and more extensive observation
periods would be less prone to missing or misinterpreting nest occupancy than a “snap-shot” obtained
from an aerial survey. Surveyors mapped each building or group of buildings and gave each survey area a
unique number. They were asked to observe the rooftops for as long as was necessary to count the
numbers of AONs, AOTs and individual birds, with Herring Gulls and Lesser Black-backed Gulls counted
separately.

3.4. Digital aerial surveys

Digital aerial surveys of the Birmingham study area were undertaken by HiDef Aerial Surveying Limited on
3rd June 2018. After data checks, video footage for all tetrads was analysed and gulls were marked. The
number of AONs and individual birds of each species was calculated for each 1-km square and vantage
point survey area. An AON was defined if a bird was associated with substantial nesting material i.e. plant
material in a structure, such as a circle or oval (depending on the nest location) extending clearly beyond
the typical size of a sitting bird. Quality checks were carried out both at the review/marking and
identification/behavioural assessment stages.

        4. RESULTS

4.1. Summary of Survey Coverage

A total of 25 tetrads (2x2km squares) were selected within the study area; hence a total of 100 1-km
squares were included in the sample. The level of coverage achieved in the 2018 surveys is summarised in
Table 1.
Table 1 Level of coverage achieved in Birmingham in 2018, summarised by strata.
Stratum No. of Volunteer
Vantage point survey Aerial survey
squares in Ground level survey
sample
No. of squares No. of No. of No. of squares covered (%
covered (% of total) squares survey areas of total)
surveyed within these
Industrial 11 11 (100%) 5 25 11 (100%)
Most Urban 18 15 (83%) 5 29 18 (100%)
Suburban 48 37 (77%) 4 13 48 (100%)
Ind/Sub Mix 23 17 (74%) 5 15 23 (100%)
TOTAL 100 80 (80%) 19 82 100 (100%)
4.2. Summary of total counts
We expected the ground level counts to be lower than the other methods, on average, as gulls on rooftops
will often be hidden from the view of observers at ground level. Indeed, one of the most important aims of
the survey is to assess the size and variability of this difference. The number of adult gulls counted by the
aerial survey in Birmingham (which excludes loafing flocks outside of suitable nesting habitat) was around
two times the number counted by the ground level survey for Herring Gulls, and four times the number
counted by the ground level survey for Lesser Black-backed Gulls. The numbers of AONs counted on the
aerial survey were seven and 14 times the ground level counts for Herring Gulls and Lesser Black-backed
Gulls respectively (Table 2). Maps of the number of AONs counted by the digital aerial survey show that
nests were mostly clustered in and closer to Birmingham city centre (Fig 1 and 2).
Table 2 Comparison of the total numbers of adult gulls and AONs counted in each stratum, by
species and method. Counts are for the 80 squares which were covered by both survey
methods (i.e. the aerial counts exclude squares which were not covered by the ground
level surveys).
Stratum (number of squares covered) Total
Ind/Sub Mix Industrial Most Urban Suburban
(17) (11) (15) (37)
Herring Gull
No. adults (ground level survey) 140 53 22 69 284
No. adults (aerial survey) 155 203 107 37 502
No. AONs (ground level survey) 8 15 1 0 24
No. AONs (aerial survey) 45 92 26 10 173
Lesser Black-backed Gull
No. adults (ground level survey) 263 388 218 421 1290
No. adults (aerial survey) 1282 2006 1245 436 4969
No. AONs (ground level survey) 20 84 15 9 128
No. AONs (aerial survey) 510 753 371 126 17604.3. Comparison of Ground Level and Aerial Surveys Numbers of nesting gulls were greatest and most variable in ‘Industrial’ squares in the Birmingham study area, followed by the ‘Ind/Sub Mix’ and ‘Most Urban’ squares, and were least in ‘Suburban’ squares. Large numbers of nesting gulls were concentrated in a small number of squares; this is not unusual in ecological datasets, particularly for colonial nesting species. 4.4. Comparison of Vantage Point Surveys and Aerial Surveys The expectation prior to the survey was that vantage point counts would nearly always be equal to or higher than aerial counts in most instances, as the aerial counts offered only a single snapshot of each rooftop, whereas more prolonged observation of activity would be carried out during the vantage point surveys. Excluding survey areas in which no records of a species were recorded in either survey, the 2018 Surveys met this expectation for Lesser Black-backed Gull in most survey areas within the 'Ind/Sub Mix' and 'Most Urban' strata, with the vantage point AONs equalling or exceeding the aerial AONs in 84% of survey areas. However, within the 'Industrial strata, 55% of aerial AON counts exceeded the vantage point AON counts for Lesser Black-backed Gull. Feedback from the vantage point surveyors confirmed that most of the larger discrepancies between the aerial and vantage point surveys occurred in survey areas which were more distant from the vantage points, or on more complex roofs where visibility from the vantage points was slightly restricted. This suggests that the most likely explanation for the discrepancies was that the quality of the available vantage points was an issue in Birmingham and that the number of AONs counted was therefore lower than the ‘true’ figure. However, it should be noted that visibility from the vantage point was believed to be good for at least one of the survey areas for which there were large differences in counts.
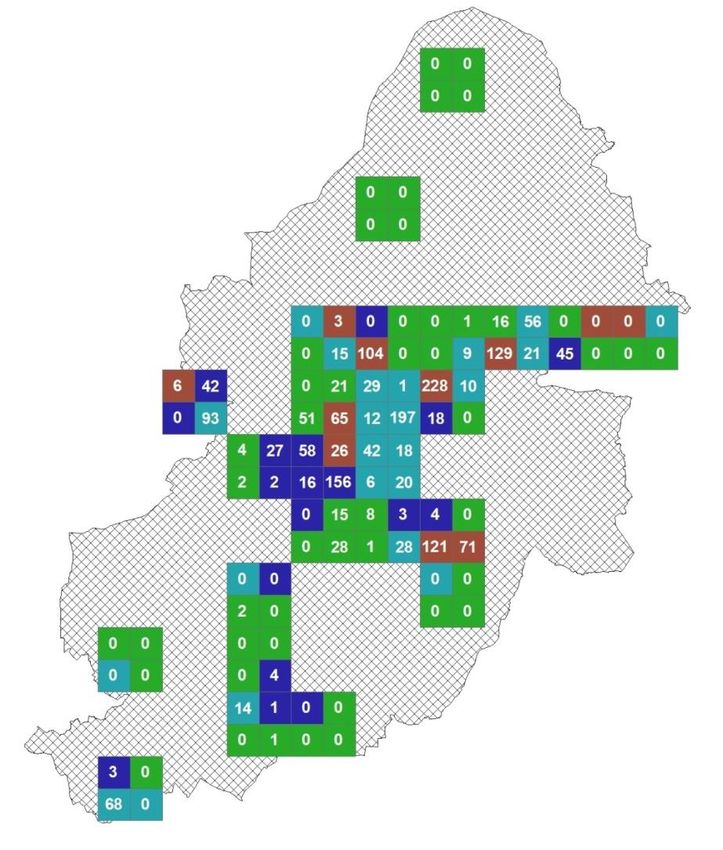
Figure 1   Map showing the number of AONs for Herring Gull counted by the aerial survey in each
           1-km square. The total number of AONs recorded in the 100 survey squares was 200.
Fig, 2 Map showing the number of AONs for Lesser Black-backed Gull counted by the aerial
survey in each 1-km square. The total number of AONs recorded in the 100 survey squares
was 1,921.5. DISCUSSION The 2018 surveys highlight wide variability in the density of gulls nesting in the Birmingham study area, particularly between the different strata, with higher numbers of nesting gulls being found in squares in the Industrial stratum by all three survey methods, and nesting gulls being mostly absent or found in only low numbers in squares in the Suburban stratum. In total, 200 Herring Gull AONs and 1,921 Lesser Black-backed Gull AONs were counted by the aerial survey across the 100 sample squares. This compares with totals of 35 confirmed or probable Herring Gull pairs and 500-600 confirmed pairs of Lesser Black-backed Gull counted by Jim Winsper in 2008-2011 (Winsper 2014). Assuming the aerial counts do not over-estimate the number of birds on nests, there are probably two different factors which explain the large increase. First, the earlier survey could only observe those rooftops which were visible from vantage points and hence the aerial survey would have enabled more complete coverage of the area. Second, the number of gulls in Birmingham may have increased in the 7–10 years since the earlier survey was completed. Bird Atlas 2007–11 (Balmer et al. 2013) highlighted the spread of gulls to inland urban areas in recent decades. The ground level surveys also observed adult gulls in squares in which the aerial surveys suggested that nesting gulls were absent, in particular in the suburban area. It seems likely that these observations relate to off-duty birds which were foraging away from the nest site. REFERENCES Balmer, D.E., Gillings, S., Caffrey, B.J., Swann, R.L., Downie, I.S. & Fuller R.J. 2013. Bird Atlas 2007–11: The Breeding and Wintering Birds of Britain and Ireland. BTO Books, Thetford. Winsper, J. 2014. Roof-top nesting gull study: concerning the population of gulls that breed within the Birmingham boundary. West Midland Bird Report 78: 237–249
You can also read