Field Measurements: USFS Fixed Radius Quarter-Acre Forest Plot
←
→
Page content transcription
If your browser does not render page correctly, please read the page content below
Field Measurements: USFS Fixed Radius Quarter-Acre Forest Plot
Created by: Steve Chignell, Matt Luizza and Bill Zawacki
Advisors: Robert Hubbard, Nicholas Young, Paul Evangelista
Date: June 15th, 2012

Lesson 1: Setting up the Plot
Background
The following tutorial takes you through the process of
delineating the boundaries of specified ¼ acre fixed
radius plots and the different forestry measurements
collected as part of a long-term monitoring program at
the USFS Fraser Experimental Forest in Colorado. Each
of these plots have been previously surveyed, so
locations of the plots were provided as GPS waypoints
and each plot had a marker (pictured right) which
denotes the center point of the plot (rebar staked in the
ground and covered with a piece of white pvc piping).
The purpose of this exercise is to use a three-person field
crew to visually determine the boundaries of the forest
plots for subsequent cataloguing and silvicultural
assessment of stand composition and structure, such as tagging and cataloguing the trees,
seedlings and saplings.

Required Materials
The following items are required for conducting a forest plot calibration:

       Topographic map of forest with GPS waypoints
       GPS unit (it’s best to have the plot waypoints already entered into the unit)
       Hard hats
       Blank data sheets
       Clipboard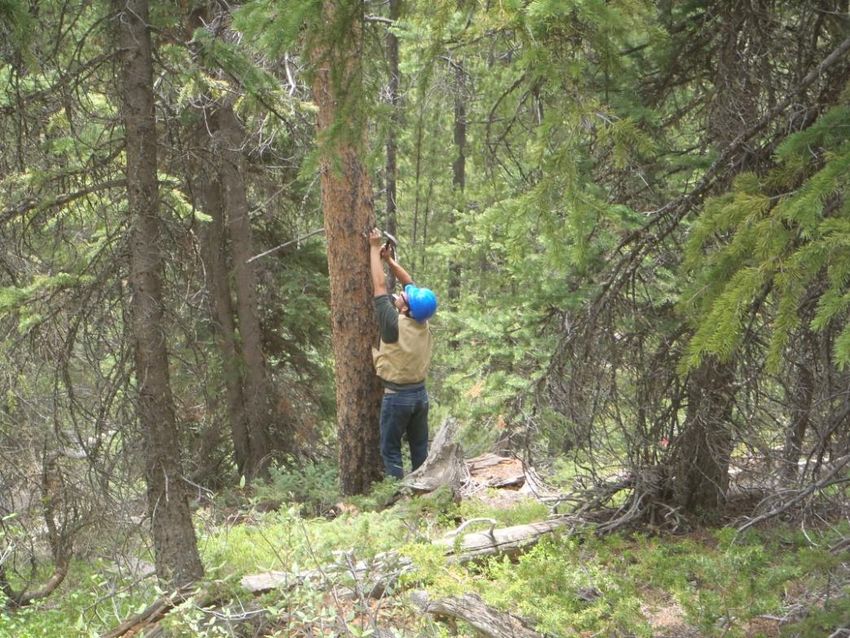
30-meter tape
       Pin flags
       Lumber crayons

*Note: Items that should always be on hand when conducting field research in forested areas:
Extra GPS batteries (make sure to take a waypoint with your GPS at the car for your return trip),
a bow saw (to remove trees that may fall and block the road), and fully charged two-way radios.

Creating the Fixed Radius Plot

The forest plot will be measured from the plot’s center point up slope, down slope and both
directions across. When calibrating a forest plot perimeter it is most efficient to use three people.
One person acting as anchor for the 30-meter tape from the central point of the plot, another, the
roller, rolling out and measuring the tape across the transect and the third, the flagger, marking
the measured boundaries with pin flags, marking the boundary trees with lumber crayon and
making sure the tape is run in a straight line.

Start by measuring out the upslope boundary. Often, these plots are established on uneven
topography. To correctly measure out a horizontal line on a slope, we must account for the
change in height. This is done by breaking the line up into segments.

From the plot’s central point, the anchor person will hold the end of the 30-meter tape above
their head. *Note: It is best to determine a set height and stick with it for measurement
consistency. The roller will walk out as far upslope as they can in a straight line, keeping the tape
taught and horizontal.

When the tape starts to slacken, the roller should reel in the tape until taught and the flagger
should mark that point. From there, the anchor will move up to the flagged point and start the
process again until the roller reaches 17.94 meters *Note: You may not be able to measure the
entire 17.94 meter quadrant transects in one measuring attempt. Depending on the terrain, slope,
height of crew members, etc. it can take multiple measurements. One crew member should be
designated to keep track of how far out each measuring attempt goes, adding the length of each
segment to the last until the total reaches 17.94 meters. When the 17.94 meter boundary is
reached and flagged, the flagger will mark the tree(s) at this farthest point within the plot
boundary with a lumber crayon (this can be a mark of “IN” or a simple vertical line. Whichever
is chosen, be consistent).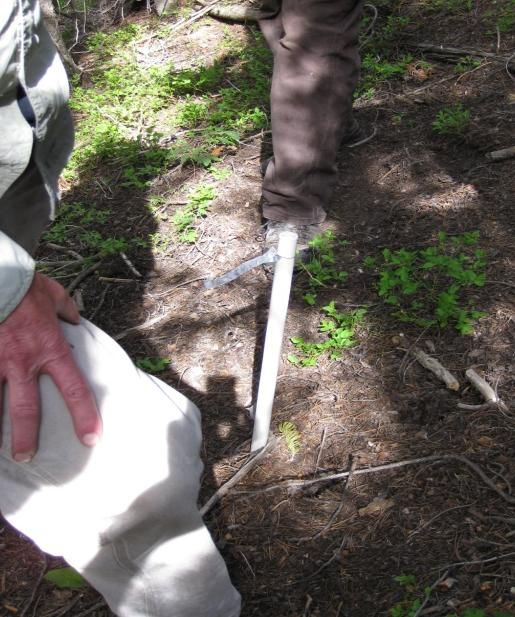
(Below): Keeping the tape taught and horizontal while measuring downslope.

                                                                        Measuring on a
                                                                        slope
                                                                             Plot              + 11
                                                                             Center              m
                                                                                          9m

                                                                                 +   10
                                                                                     m
                                                                             8
                                                                             m

Next, measure the downslope boundary. The process is very similar to the aforementioned
upslope transect measurement but one key distinction should be made. In this case, the
anchor holds the end-point of the 30-meter tape low to the ground and the roller holds the
tape above their head. The roller will walk out as far downslope as they can in a straight line,
keeping the tape taught. When the tape starts to slacken, the roller should reel in the tape
until taught and the flagger should mark that point. From there the anchor will move up to the
flagged point and start the process again until the roller reaches 17.94 meters.

Next, measure across slope ensuring measurements are made in both directions, while the
anchor and roller hold the tape at the same level (holding the tape lower is recommended).
As with the other directions, the roller will walk out as far across slope as they can in a
straight line, keeping the tape taught. When the tape starts to slacken, the roller should reel in
the tape until taught and the flagger should mark that point. From there the anchor will move
up to the flagged point and start the process again until the roller reaches 17.94 meters.

Once the four quadrant boundaries have been marked, it is recommended that four additional
diagonal transects be measured and flagged at the 17.94 meter boundaries. This makes the
forest plot boundaries more distinguishable, which will make subsequent plot assessments
much easier. These diagonal transect measurements are conducted in the same fashion as the
four boundary measurements previously noted. Upon marking the forest plot extent, remove
the pin flags that are NOT
denoting the 17.94 meter
boundary.

*Note: It is highly
recommended that you
double-check a few
boundary points and run
the 30-meter tape to the
central plot marker to
validate.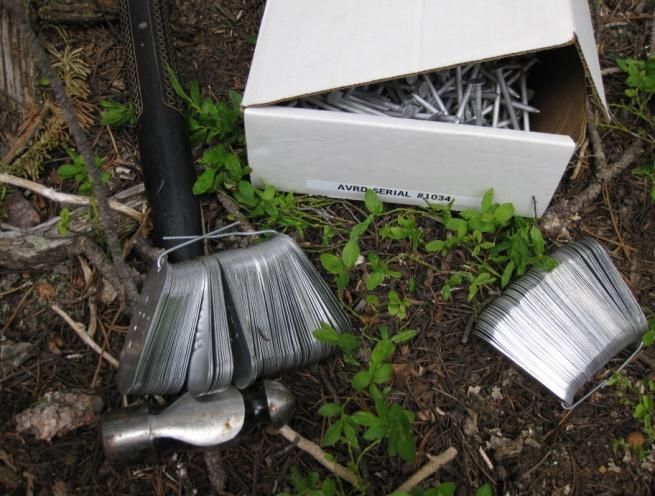
Lesson 2: Forest Field Plot Sampling (Tree Measurement and Tagging)
Required Materials

The following items are required for conducting a forest plot calibration:

       Topographic map of forest with GPS waypoints
       GPS unit (it’s best to have the plot waypoints already entered into the unit)
       Hard hats
       Data sheets
       Clipboard
       D-tape (diameter tape)
       Cruiser vests
       Hammer
       Aluminum nails
       Tree identification tags

*Note: Items that should always be on hand when conducting field research in forested areas:
Extra GPS batteries (make sure to take a waypoint with your GPS at the car for your return trip),
a bow saw (to remove trees that may fall and block the road), and fully charged two-way radios.

Tree Tagging

For this process, all trees within the quarter-acre plot with a DBH (diameter breast height)
greater than 2 centimeters will be tagged and catalogued. The tree tagger should be the first
member of the group to start work so that the other two who are cataloguing can easily identify
the tagged trees and record those in numerical order (if the tagger is unsure if a tree's DBH is > 2
                                                  centimeters, they can do a quick measurement,
                                                  explained later on in the tutorial).

                                                To tag a tree, feed the nail through the whole in
                                                the tag and hammer it into the tree 30- 60
                                                centimeters (approximately 1- 2 feet) above eye
                                                level. This makes sure the tag will be visible even
                                                with deep snow accumulation. Don’t drive the
                                                nail all the way into the tree. Leaving some space
                                                allows the tree to grow and not envelope the tag
                                                but limits the chance of the nail falling off the
                                                tree.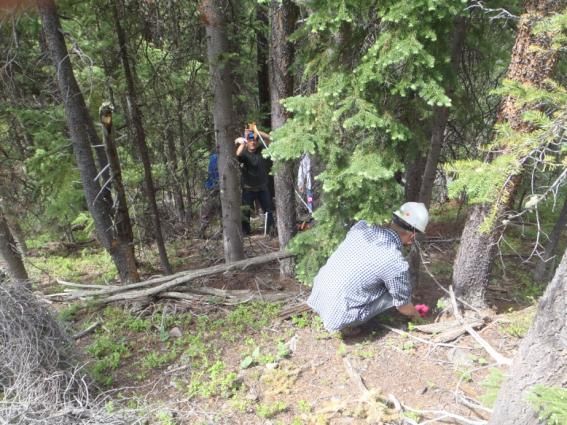
(Below): Good height for tagging trees

                                         Choose a spot such that
                                         the tag is facing the
                                         center point of the plot
                                         (rebar staked in the
                                         ground and covered
                                         with a piece of white
                                         pvc piping). Hammer
                                         the nail at a slight
                                         downward angle so the
                                         tag slides down and
                                         dangles freely at the
                                         nail head. Make sure
                                         the nail is solidly
                                         lodged inside the tree;
                                         2.5 - 5 centimeters
                                         (approximately 1.5 - 2.0
inches) is a good depth.

Movement

For each plot, always start the
tagging and cataloguing process by
moving upslope of the central plot
marker and work out towards the
edge of the plot, then back in to the
center--always move clockwise.
(See diagram to the right):

For the first tree noted, you need to
take a measurement of the distance
from the tree to the central plot
marker and take an azimuth compass
reading.
Cataloguing Once the first couple of trees have been tagged, the other two team members begin to catalogue each one based on the following data sheet: Additional categories will be marked in the Notes column. Track trees that have dwarf mistletoe by using the notation “DM”. Also include any trees that have likely fallen in the past four years. The plots were last assessed in 2008. To distinguish these from the standing trees catalogued use the following notation in the notes column: “D&D” for “Dead and Down” and L&D for “Living and Down”. *Note: For downed trees, make sure that the tree was rooted within the plot perimeter. If the root base is outside of the perimeter but the bole of the tree (i.e. the trunk) and/or crown is inside, it is not a part of the plot and should NOT be catalogued. Additionally, downed trees do NOT have a crown class. Seedling and sapling counts for each plot will be catalogued in the # Seedling and # Sapling columns by species. A 5x5 meter sub-plot based around the center point of the 17.94 meter plot needs to be created. This will be done in the same fashion as the larger plot you are working within (See the Lesson 1: Forest Field Plot Sampling (Plot Perimeter Calibration) tutorial for specifics on how to calibrate plot boundaries).Seedlings are less than 1.4 meters high, meaning they do not have a diameter breast height (DBH) to measure. Saplings are at least 1.4 meters tall (approximately 4.5 feet) or greater but have a DBH less than 2 centimeters (measuring DBH is explained in the next section). *Note: The most common trees in Fraser Experimental Forest are sub-alpine fir (Abies lasiocarpa), Engelmann spruce (Picea engelmannii) and lodgepole pine (Pinus contorta), with an occasional alder (Alnus tenuifolia) or aspen (Populus tremuloides). Only 5-10 Douglas firs (Pseudotsuga menziesii) are found in the forest and are thus unlikely to be encountered. When
distinguishing the canopy characteristics of trees (listed above the Crown Class column), very
few trees in the plots will likely be “dominant”. More often than not the most common
classifications will be “co-dominant”, “understory” and “dead”.
Measuring DBH
In addition to noting the species of each tree and characteristics found in the adjoining data sheet,
you will be measuring the DBH (diameter breast height) and tagging each tree with a unique
identification number. It is suggested that you continue to work in a crew of three, with one
person tagging the trees, one person measuring DBH, and one person following behind filling in
the data sheet. Regular communication between all three team members helps keep the work
accurate and efficient. *Note: All crew members should take part in identifying tree species and
characteristics.
When measuring DBH, the d-tape should be used with the white side, which has diameter
measurements (the yellow side has a normal metric ruler). The person measuring should stand
upslope of the tree and measure around the base of the tree 1.4 meters high (approximately 4.5
feet). The “0” on the tape should be visible to the person measuring and the starting point of the
measurement. The tape should then be wrapped around the base of the tree until the tape
overlaps with the “0”. This intersection is the tree’s DBH measurement.
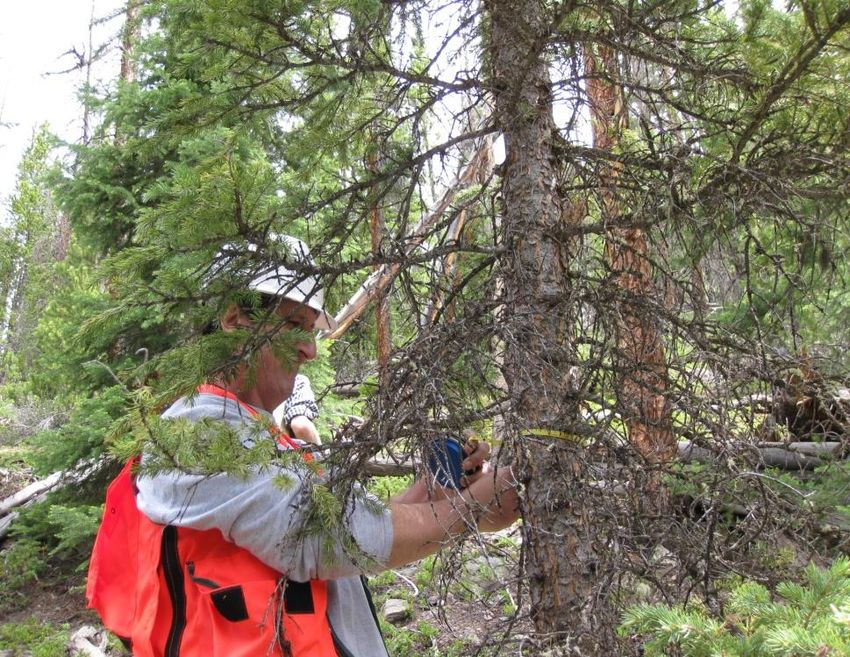
(Below): Measuring DBH
*Note: Make sure the tape is
not being obstructed by a
branch on the blind side of
the tree which would make
the measurement greater
than the actual diameter.
Final Check and
Completion
*IMPORTANT! Once all
the trees in the plot have
been catalogued, the team should walk within and around the entire plot to ensure they did not
miss any trees. If any were missed, tag and record them just as you did the others.
Once all trees are tagged, finish the plot by removing the marker flags around the perimeter, pack
all gear up, and move on to the next location.Congratulations! You have successfully calibrated a USFS fixed radius quarter-acre forest plot!
You can also read