Use of a Paid Digital Marketing Campaign to Promote a Mobile Health App to Encourage Parent-Engaged Developmental Monitoring: Implementation Study
←
→
Page content transcription
If your browser does not render page correctly, please read the page content below
JMIR PEDIATRICS AND PARENTING                                                                                                       Arshanapally et al

     Original Paper

     Use of a Paid Digital Marketing Campaign to Promote a Mobile
     Health App to Encourage Parent-Engaged Developmental
     Monitoring: Implementation Study

     Suraj Arshanapally1,2, MPH; Katie Green2, MPH; Karnesha Slaughter2, MPH; Robert Muller3; Demeika Wheaton3
     1
      Oak Ridge Institute of Science and Education, Atlanta, GA, United States
     2
      National Center on Birth Defects and Developmental Disabilities, Centers for Disease Control and Prevention, Atlanta, GA, United States
     3
      Porter Novelli, Atlanta, GA, United States

     Corresponding Author:
     Suraj Arshanapally, MPH
     National Center on Birth Defects and Developmental Disabilities
     Centers for Disease Control and Prevention
     4770 Buford Highway
     Mail Stop S106-4
     Atlanta, GA
     United States
     Phone: 1 404 498 1007
     Email: otv1@cdc.gov

     Abstract
     Background: The internet has become an increasingly popular medium for parents to obtain health information. More studies
     investigating the impact of paid digital marketing campaigns for parents on promoting children’s healthy development are needed.
     Objective: This study aims to explore the outcomes of a paid digital marketing campaign, which occurred from 2018 to 2020,
     to promote messages about parent-engaged developmental monitoring and ultimately direct parents to the Centers for Disease
     Control and Prevention’s (CDC’s) Milestone Tracker app, a mobile health (mHealth) app developed by the CDC.
     Methods: The paid digital marketing campaign occurred in 3 phases from 2018 to 2020. In each phase, 24 to 36 marketing
     messages, in English and Spanish, were created and disseminated using Google’s Universal App Campaigns and Facebook Ads
     Manager. Outcomes were measured using impressions, clicks, and install data. Return on investment was measured using
     click-through rate (CTR), cost per click, and cost per install metrics.
     Results: The Google-driven marketing messages garnered a total of 4,879,722 impressions (n=1,991,250, 40.81% for English
     and n=2,888,472, 59.19% for Spanish). The messages resulted in a total of 73,956 clicks (n=44,328, 59.94% for English and
     n=29,628, 40.06% for Spanish), with a total average CTR of 1.52% (2.22% for English and 1.03% for Spanish). From these
     clicks, there were 13,707 installs (n=9765, 71.24% for English and n=3942, 28.76% for Spanish) of the CDC’s Milestone Tracker
     app on Google Play Store. The total average cost per install was US $0.93 across all phases. The phase 3 headline “Track your
     child’s development” generated the highest CTR of 3.23% for both English and Spanish audiences. The Facebook-driven marketing
     messages garnered 2,434,320 impressions (n=1,612,934, 66.26% for English and n=821,386, 33.74% for Spanish). The messages
     resulted in 44,698 clicks (n=33,353, 74.62% for English and n=11,345, 25.38% for Spanish), with an average CTR of 1.84%
     (2.07% for English and 1.38% for Spanish). In all 3 phases, animated graphics generated the greatest number of clicks among
     both English and Spanish audiences on Facebook when compared with other types of images.
     Conclusions: These paid digital marketing campaigns can increase targeted message exposure about parent-engaged developmental
     monitoring and direct a parent audience to an mHealth app. Digital marketing platforms provide helpful metrics that can be used
     to assess the reach, engagement, and cost-effectiveness of this effort. The results from this study suggest that paid digital marketing
     can be an effective strategy and can inform future digital marketing activities to promote mHealth apps targeting parents of young
     children.

     (JMIR Pediatr Parent 2022;5(2):e34425) doi: 10.2196/34425

     https://pediatrics.jmir.org/2022/2/e34425                                                             JMIR Pediatr Parent 2022 | vol. 5 | iss. 2 | e34425 | p. 1
                                                                                                                         (page number not for citation purposes)
XSL• FO
RenderX
JMIR PEDIATRICS AND PARENTING Arshanapally et al
KEYWORDS
health communication; health promotion; internet; social media; child development; mobile health; pediatrics; parenting; early
child development; developmental disability; mobile phone
marketers. In their efforts to only serve the most valuable content
Introduction to each user, most businesses and organizations saw a decline
Background in their organic reach [8]. Ogilvy, a public relations firm,
analyzed Facebook brand pages to assess the extent of the
An estimated 1 in 6 children in the United States has a diagnosed decline of organic (unpaid) reach [9]. Organic reach was defined
developmental disability [1]. Developmental disabilities are as the number of people who saw the page’s post through their
conditions because of impairments in physical, learning, news feed or the page’s timeline or, in other words, anyone who
language, and behavioral domains. Early intervention of children saw content that was not a consequence of paid advertising.
with developmental disabilities can have a positive impact on They selected 106 brand pages representing various industries,
their lives [2]. As a response, the Centers for Disease Control markets, countries, and sizes to obtain a comprehensive sample.
and Prevention (CDC) developed the Learn the Signs. Act Early. The total audience reach for the sample was 48 million. In
program, which aims to improve early identification of October 2013, the organic content from brand pages reached
developmental delays and disabilities by facilitating 12.05% of the total audience. By February 2014, there was a
parent-engaged developmental monitoring using developmental 49% drop, resulting in only 6.15% of the total audience being
milestone checklists from birth through the age of 5 years. For reached. In 2018, Facebook also announced that an update to
many years, the CDC’s milestone checklists were offered as their news feed algorithm would likely result in further decreases
printed handouts and booklets. A Pew Research Center study in organic reach [10]. This demonstrates the limits of organic
[3] found that 85% of Americans owned a smartphone in 2021, reach, thus making the argument for methods such as paid digital
which has increased from just 35% in 2011. The groups most marketing to increase the exposure to a message.
dependent on smartphones include lower income Americans
and those with a high school education or less. In addition, On Google, Yang and Ghose [11] found higher click-through
approximately half of parents with cell phones download apps rates (CTRs), which are the total clicks on a message divided
on their mobile phones compared with one-third of nonparents by the total impressions, when paid content was available on
[4]. Owing to the increasing smartphone use in America and Google search engines in addition to organic (unpaid) content,
the interest in mobile apps among parents, Learn the Signs. Act instead of organic content alone. As paid digital marketing plays
Early. developed the CDC’s Milestone Tracker mobile app, a an increasingly important role in reaching large audiences on
mobile-friendly version of the milestone checklists. The app the web, the need for more studies examining the effectiveness
helps parents actively monitor their children’s developmental of such strategies in promoting health information and resources
progress, sends notifications to parents about their child’s is warranted.
progress, and encourages parents to share any potential concerns Study Objective
with their child’s physician, a critical step toward early
identification and connection with intervention services and This study assesses the outcomes of a paid digital marketing
supports. campaign that was conducted in 3 phases using both Google’s
Universal App Campaigns (UAC) and Facebook Ads Manager
Although traditional promotion using brochures and flyers have to promote the CDC’s Milestone Tracker app among parents
supported the promotion of the CDC’s Milestone Tracker app of young children.
for a few years, there is mounting evidence that parents of young
children learn about parenting and health information and Methods
resources through the internet and social media [5]. In a study
conducted by Plantin and Daneback [6], first-time mothers aged Google’s UAC
30 to 35 years were found to actively use the internet for health Google’s UAC is a paid service to promote mobile apps. UAC
and parenting information and resources as well as social distributes marketing messages across several Google formats
support. In addition, Facebook was reported as the most and networks, such as the first page of relevant Google search
frequently used social media platform among parents seeking results and small banner advertisements appearing on relevant
social support and health information on infant and child health YouTube channels. Google’s UAC also offers placement across
[7]. the Google Display Network, which includes small banners
The internet offers ample opportunities for promoting public next to videos on webpages and within apps in the Google Play
health messages for many audiences, including parents of young Store, Gmail, and more [12]. This platform optimizes message
children. There are easy-to-use digital marketing platforms such performance by disseminating messages during certain times
as Facebook and Google. Both platforms offer unpaid and paid and in placements that the desired audience engages with the
placement options. However, the paid options increase the most.
visibility of content, whereas the unpaid options do not, thereby
Facebook Ads Manager
increasing the likelihood of message exposure.
Facebook Ads Manager is a paid advertising management
In 2014, Facebook announced that the mass production of service used to oversee paid digital marketing campaigns across
content on their platform made it highly competitive for the Facebook platform. Paid content is displayed within the
https://pediatrics.jmir.org/2022/2/e34425 JMIR Pediatr Parent 2022 | vol. 5 | iss. 2 | e34425 | p. 2
(page number not for citation purposes)
XSL• FO
RenderXJMIR PEDIATRICS AND PARENTING Arshanapally et al
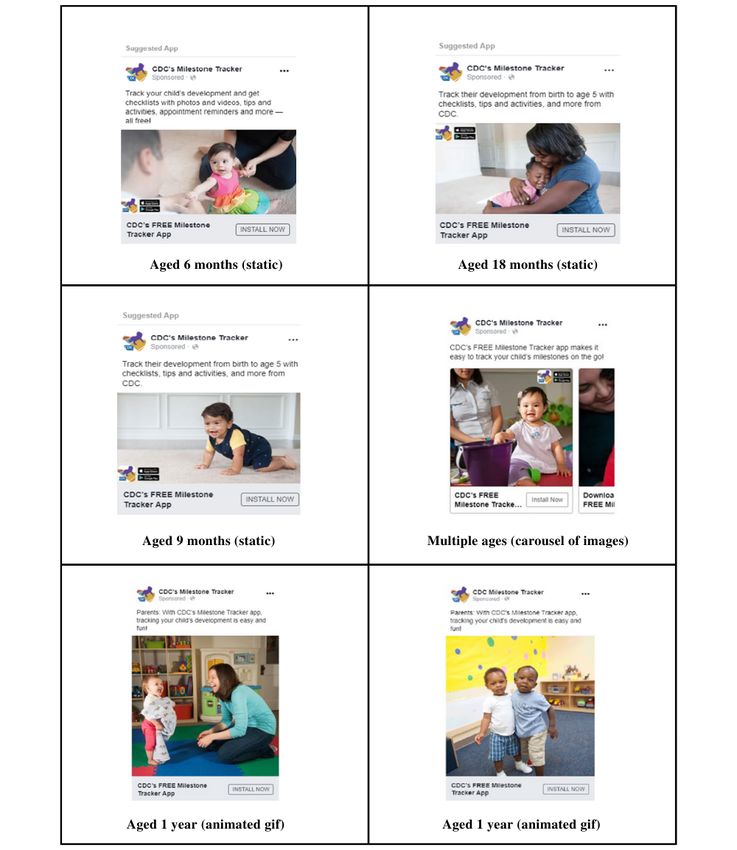
Facebook news feeds as well as in between videos and news message included 1 graphic (series of 2-3 rotating images
articles that appear when the user is scrolling [13]. The [carousel], animated graphics interchange format [GIF], or static
Campaign Budget Optimization feature within this service helps image) and 1 copy (text) combination. The graphics depicted
campaigns more efficiently spend the allocated budget by young children from varying racial backgrounds agedJMIR PEDIATRICS AND PARENTING Arshanapally et al
Figure 1. Screenshots of paid digital marketing posts on Facebook used in phases 1 to 3. GIF: graphics interchange format.
In addition, Google and Apple do not share data between their
Audience Parameters respective platforms and properties; thus, Google-driven traffic
For Google-driven marketing messages, UAC uses machine to Apple’s App Store was not collected. Google-driven
learning to target users who are likely to install and use the marketing messages were only served on Android devices using
CDC’s Milestone Tracker app: parents of young children. English and Android devices using Spanish, which is a limitation
Google’s automated targeting strategy is based on user data of the study.
collected by its platforms and properties, similar digital
marketing campaigns, and current reach and engagement trends On Facebook, the audience parameters for marketing messages
[10]. For instance, the marketing messages were served to users were set for parents in the United States aged 18 to 45 years
who searched keywords on children’s development. with young children agedJMIR PEDIATRICS AND PARENTING Arshanapally et al
parents (0-12 months), parents with toddlers (1-2 years), and the Google Play Store or Apple’s App Store, depending on their
parents with preschoolers (3-5 years). Separate sets were created device type.
for English- and Spanish-speaking parents. Marketing messages
were distributed to four types of devices: Android devices using
Data Collection
English, Android devices using Spanish, iOS devices using When users receive a Google- or Facebook-driven marketing
English, and iOS devices using Spanish. Therefore, when a user message, they may click on the message. They will be directed
clicked on a marketing message, they were directed to either to the App Store or Google Play Store, where they can install
the CDC’s Milestone Tracker app. These steps are measured
by the following metrics in Textbox 1.
Textbox 1. Definitions of digital marketing metrics.
Metric and definition
• Impressions
• Number of times a paid digital marketing message is served to a user (includes repeat exposures)
• Click
• Action taken by a user upon seeing a paid digital marketing message to visit the App Store or Google Play Store to learn more about the
Centers for Disease Control and Prevention’s (CDC’s) Milestone Tracker app
• Click-through rate
• Total number of clicks on the paid digital marketing message divided by the total number of impressions
• Cost per click
• Total cost of the paid digital marketing campaign divided by the number of clicks on a paid digital marketing message
• Install
• Downloads of the CDC’s Milestone Tracker app
• Install rate
• Total number of installations of the CDC’s Milestone Tracker app divided by the total number of clicks on the paid digital marketing message
• Cost per install
• Total cost of the paid digital marketing campaign divided by the number of installations of the CDC’s Milestone Tracker app
As Google shares information between platforms, including and the analyzed data were limited to publicly available digital
Google Display Network, YouTube, and Google Play Store, metrics collected in aggregate.
UAC could capture the number of Google-driven impressions,
clicks, and installs on Android devices. Results
Facebook-driven marketing messages were served on both Apple Impressions
and Android devices in both English and Spanish. However,
install data were not available. To obtain install data from Across all 3 phases, Google-driven marketing messages
Facebook, the CDC’s Milestone Tracker app would need to be generated a total of 4,879,722 impressions, and Facebook-driven
registered with Facebook, which includes the implementation marketing messages generated 2,434,320 impressions. In phase
of the Facebook Software Development Kit—a functionality 3, the CDC manually allocated more of the Facebook budget
that integrates Facebook into the app. As the CDC’s Milestone toward Spanish-speaking audiences as the Campaign Budget
Tracker app must adhere to federal guidelines, this capability Optimization feature was allocating more funds toward and
was restricted and thus served as a limitation in terms of data generating more impressions for English-speaking audiences
collection. in phase 2. For this reason, the number of Facebook-driven
Spanish impressions was larger than English impressions in
Ethical Considerations phase 3 (Table 1).
Institutional review board approval was not required for this
project as no human participants were involved in the study,
https://pediatrics.jmir.org/2022/2/e34425 JMIR Pediatr Parent 2022 | vol. 5 | iss. 2 | e34425 | p. 5
(page number not for citation purposes)
XSL• FO
RenderXJMIR PEDIATRICS AND PARENTING Arshanapally et al
Table 1. Impressions from Google- (N=4,879,722) and Facebook-driven (N=2,434,320) marketing messages.
Campaign phases Impressions, n (%)
Phase 1 (2018)
Googlea
English 982,568 (20.14)
Facebook
English 626,382 (25.73)
Phase 2 (2019)
Googlea
English 676,628 (13.87)
Spanish 1,009,547 (20.68)
Total 1,686,175 (34.55)
Facebook
English 444,658 (18.27)
Spanish 217,465 (8.93)
Total 662,123 (27.2)
Phase 3 (2020)
Googlea
English 332,054 (6.8)
Spanish 1,878,925 (38.5)
Total 2,210,979 (45.31)
Facebook
English 541,894 (22.26)
Spanish 603,921 (24.81)
Total 1,145,815 (47.07)
a
For Google, the messages were only served on Android devices, not Apple devices, because of a tracking pixel needed to share data between Google
and Apple.
Display Network, and YouTube properties, most of the
Clicks and CTR impressions, clicks, and installs were driven by Google Display
During the campaign, the Google-driven marketing messages Network in all 3 phases (Table 3). In all 3 phases, the English
were clicked a total of 73,956 times (CTR 1.52%; Table 2). messages had a higher CTR than the Spanish messages.
Although they were displayed across Google Search, Google
https://pediatrics.jmir.org/2022/2/e34425 JMIR Pediatr Parent 2022 | vol. 5 | iss. 2 | e34425 | p. 6
(page number not for citation purposes)
XSL• FO
RenderXJMIR PEDIATRICS AND PARENTING Arshanapally et al
Table 2. Clicks, CTRa,b, and CPCc,d metrics from Google- (N=73,956) and Facebook-driven (N=44,698) marketing messages.
Campaign phases Clicks, n (%) CTR (%) CPC (US $)
Phase 1 (2018)
Googlee
English 19,782 (26.75) 2.01 0.20
Facebook
English 11,822 (26.45) 1.89 0.30
Phase 2 (2019)
Googlee
English 16,284 (22.02) 2.41 0.18
Spanish 18,138 (24.53) 1.80 0.12
Total 34,422 (46.54) 2.04 0.15
Facebook
English 9711 (21.73) 2.18 0.34
Spanish 3595 (8.04) 1.65 0.34
Total 13,306 (29.77) 2.01 0.34
Phase 3 (2020)
Googlee
English 8262 (11.17) 2.49 0.23
Spanish 11,490 (15.54) 0.61 0.16
Total 19,752 (26.71) 0.89 0.19
Facebook
English 11,820 (26.44) 2.18 0.14
Spanish 7750 (17.34) 1.28 0.15
Total 19,750 (44.19) 1.71 0.19
a
CTR: click-through rate.
b
Total number of clicks on the paid digital marketing message divided by the total number of impressions.
c
CPC: cost per click.
d
Total cost of the paid digital marketing campaign divided by the number of clicks on a marketing message.
e
For Google, the messages were only served on Android devices, not Apple devices, because of a tracking pixel needed to share data between Google
and Apple.
https://pediatrics.jmir.org/2022/2/e34425 JMIR Pediatr Parent 2022 | vol. 5 | iss. 2 | e34425 | p. 7
(page number not for citation purposes)
XSL• FO
RenderXJMIR PEDIATRICS AND PARENTING Arshanapally et al
Table 3. Metricsa for Google-driven marketing messages by Google platform placement.
Placements Impressions (N=4,879,722), n (%) Clicks (N=73,956), n (%) CTRb (%) Installs (N=13,707), n (%)
Phase 1 (2018)
Google Search 20,236 (0.41) 1542 (2.09) 7.62 671 (4.9)
Google Display Network 962,257 (19.72) 18,226 (24.64) 1.89 2669 (19.47)
YouTube 75 (0) 14 (0.01) 18.67 0 (0)
Total 982,568 (20.14) 19,782 (26.75) 2.01 3340 (24.37)
Phase 2 (2019)
Google Search 12,506 (0.26) 1027 (1.39) 8.21 442 (3.22)
Google Display Network 1,672,818 (34.28) 33,376 (45.13) 2.00 4218 (30.77)
YouTube 851 (0.02) 19 (0.03) 2.23 2 (0.01)
Total 1,686,175 (34.55) 34,422 (46.54) 2.04 4662 (34.01)
Phase 3 (2020)
Google Search 18,828 (0.39) 1389 (1.88) 7.38 613 (4.47)
Google Display Network 2,191,913 (44.92) 18,357 (24.82) 0.84 5091 (37.14)
YouTube 238 (0) 6 (0.01) 2.52 1 (0.01)
Total 2,210,979 (45.31) 19,752 (26.71) 0.89 5705 (41.62)
a
Cost per click and cost per install metrics were not included. Google’s optimization features allocated varying amounts of the budget to each placement.
Thus, individualized cost metrics could not be calculated.
b
CTR: click-through rate.
Of the 73,956 clicks, during phase 1, the top-performing Google among English marketing messages; images of babies aged 9
copy was “Track Milestones Today,” with 9288 (12.56%) clicks months resonated with both English and Spanish audiences,
(CTR 2.97%); however, in phase 2, this headline was the resulting in a total of 1797 (4.02%) clicks (CTR 0.91%) and
second-best, with 3458 (4.68%) clicks (CTR 2.86%), whereas 4175 (9.34%) clicks (CTR 1.19%) during phase 3, respectively.
“Track Child Development” was the top-performing headline,
with 4802 (6.49%) clicks (CTR 2.78%). In phase 3, the adapted
Cost per Click
phase 2 headline “Track your child’s development” generated For all 3 phases, the Google-driven marketing messages, on
the best CTR (3.23%). average, cost a total of US $0.17 per click (cost per click [CPC]).
Specifically, it cost US $4000 to receive 19,782 clicks (CPC
The Facebook-driven marketing messages were clicked a total US $0.20) in phase 1, US $5000 to receive 34,422 clicks (CPC
of 44,698 times (CTR 1.84%). In all 3 phases, the animated US $0.15) in phase 2, and US $3750 to receive 19,752 clicks
GIFs in both English and Spanish generated the greatest number (CPC US $0.19) in phase 3 (Tables 2 and 4).
of clicks when compared with other types of graphics,
suggesting that the marketing messages formatted as animated Overall, the average Facebook-driven marketing messages cost
GIFs may result in higher engagement than standalone static a total of US $0.26 per click (CPC). They improved in efficiency
images. Of the 44,698 clicks, an image of 2 boys aged 1 year from phase 2 to 3. In phase 2, it cost US $4500 to receive 13,306
hugging from phase 3 received 8330 (18.64%) clicks (CTR clicks (CPC US $0.34), whereas in phase 3, it cost US $3750
4.75%) singlehandedly, which made it the top-performing image to receive 19,572 clicks (CPC US $0.19). In phase 1, it cost US
$3500 to receive 11,822 clicks (CPC US $0.30).
Table 4. Campaign budget breakdown.
Phases Google (US $) Facebook (US $)
Phase 1 (June 6 to July 28, 2018) 4000 3500
Phase 2 (March 27 to May 21, 2019) 5000 4500
Phase 3 (May 4 to June 14, 2020) 3750 3750
phase 1 end, there were only 19,391 app installs, a 44% decrease
Installs and Cost per Install compared with when the paid digital marketing messages were
During the 7-week period of phase 1, there were 34,431 app running in phase 1 (Table 5). The Google-driven marketing
installs, an 84% increase compared with 7 weeks before the messages contributed to 3340 app installs at a cost per install
paid digital marketing campaign began. After 7 weeks from the (CPI) of US $1.19 (Table 6). During the 8-week period of phase
https://pediatrics.jmir.org/2022/2/e34425 JMIR Pediatr Parent 2022 | vol. 5 | iss. 2 | e34425 | p. 8
(page number not for citation purposes)
XSL• FO
RenderXJMIR PEDIATRICS AND PARENTING Arshanapally et al
2, there were 39,443 app installs, a 14% increase compared with During the 6-week period of phase 3, there were 42,239 app
8 weeks before the paid digital marketing messages ran. After installs. No major differences in app installs were found between
8 weeks from phase 2, there were only 23,725 app installs, a phase 3 and the 6-week periods before and after the phase. The
40% decrease compared with when the paid digital marketing Google-driven marketing messages contributed to 5705 app
messages were running in phase 2 (Table 5). The Google-driven installs at a CPI of US $0.66 (Table 6). For all 3 phases, the
marketing messages contributed to 4662 app installs at a CPI average CPI for Facebook could not be calculated because of
of US $1.07 (Table 6). the limitation of collecting Facebook-driven installs. The
average CPI for Google across all 3 phases was US $0.93.
Table 5. Total CDCaMilestone Tracker app install data.
Time point and period Installs, n
Before campaign
7 weeks before 18,755
8 weeks before 34,730
6 weeks before 41,255
During campaign
Phase 1b 34,431
Phase 2c 39,443
Phase 3d 42,239
After campaign
7 weeks after 19,391
8 weeks after 23,725
6 weeks after 43,196
a
CDC: Centers for Disease Control and Prevention.
b
Phase 1 occurred from June 6 to July 28, 2018, a 7-week period.
c
Phase 2 occurred from March 27 to May 21, 2019, an 8-week period.
d
Phase 3 occurred from May 4 to July 14, 2020, a 6-week period.
https://pediatrics.jmir.org/2022/2/e34425 JMIR Pediatr Parent 2022 | vol. 5 | iss. 2 | e34425 | p. 9
(page number not for citation purposes)
XSL• FO
RenderXJMIR PEDIATRICS AND PARENTING Arshanapally et al
Table 6. Installs, install rate, and CPIa,b metrics from Google- (N=13,707) and Facebook-driven marketing messages.
Campaign phases Installsc, n (%) Install rate (%) CPI (US $)
Phase 1 (2018)
Googled
English 3340 (24.37) 16.89 1.19
Facebook
English —d — —
Phase 2 (2019)
Googled
English 3308 (24.13) 20.31 0.88
Spanish 1354 (9.88) 7.46 1.62
Total 4662 (34.01) 13.54 1.07
Facebook
English — — —
Spanish — — —
Total — — —
Phase 3 (2020)
Googlee
English 3117 (22.74) 37.73 0.60
Spanish 2588 (18.88) 22.52 0.73
Total 5705 (41.62) 28.88 0.66
Facebook
English — — —
Spanish — — —
Total — — —
a
CPI: cost per install.
b
Total cost of the paid digital marketing campaign divided by the number of installs of the Centers for Disease Control and Prevention’s Milestone
Tracker app.
c
For Facebook, install data were not available because of federal guidelines against the integration of Facebook Software Development Kit into a mobile
app.
d
Data not available.
e
For Google, the messages were only served on Android devices, not Apple devices, because of a tracking pixel needed to share data between Google
and Apple.
installs (n=9765, 71.24% for English and n=3942, 28.76% for
Discussion Spanish) of the CDC’s Milestone Tracker app on Google Play
Principal Findings Store. The total average CPI was US $0.93 across all phases.
The phase 3 headline, “Track your child’s development,”
This study investigated the outcomes of a paid digital marketing generated the highest CTR of 3.23% for both English and
campaign for promoting Google- and Facebook-driven Spanish audiences. The Facebook-driven marketing messages
marketing messages about parent-engaged developmental garnered 2,434,320 impressions (n=1,612,934, 66.26% for
monitoring and direct parents with children agedJMIR PEDIATRICS AND PARENTING Arshanapally et al
Marketing Messages addition, the focus of our campaign was not to sell a medical
Among the Facebook- and Google-driven marketing messages product but rather to promote public health messages to parents
fielded through this campaign, the marketing messages with with young children. The Campaign Budget Optimization
animated GIFs and images with younger children (eg, 2 boys feature’s tendency to increase the efficiency of budget spending
aged 1 year hugging and a baby aged 9 months) performed by disregarding lower performing devices and increasing
higher than messages without GIFs and images of older children. delivery of impressions to higher performing devices is not ideal
The marketing messages with simple and direct calls to action, for public health purposes. It is crucial that messages about the
such as the “Track your child’s development” copy, generated CDC’s Milestone Tracker app are equitably promoted to all
high CTRs. Future public health campaigns targeting parents populations, which includes all device types regardless of
of young children can consider these findings when designing performance. Thus, comparing CTR and CPC with marketing
marketing messages for Facebook and Google. campaigns with similar populations, public health topics, and
campaign goals may provide a more useful reference point than
Return on Investment solely industry benchmarks.
The return on investment was measured by the increase in app For instance, Graham et al [18] conducted a similarly structured
installs during the paid digital marketing campaign compared 3-phased paid digital marketing campaign using both Google-
with the periods before and after the campaign, when no paid and Facebook-driven messages on healthy weight gain with
digital marketing efforts were active. As no benchmarks for expecting parents and parents of young children up to the age
CPI for similar populations or studies were found for of 6 years in Alberta, Canada. Although their study differed in
comparison, CTR and CPC were also analyzed. CTR provides audience size, public health topic, and budget spending, their
additional information on the returns of the study, whereas CPC CTR and CPC could be used as reference points for evaluating
provides additional information on the cost-effectiveness of the the effectiveness of our campaign in terms of reaching similar
investment. According to Table 5, the app installs during phases audience demographics. On average, their Facebook-driven
1 and 2 were higher than the periods both before (84% and 14% messages resulted in a CTR of 1.88% and a CPC of CAD $0.35
higher, respectively) and after the campaign (44% and 40% (US $0.26). Their Google-driven messages resulted in a CTR
higher, respectively). This demonstrates the effectiveness that of 5.8% and CPC of CAD $0.76 (US $0.56). In comparison,
the paid digital marketing campaign had on increasing app our total average CTR for Facebook was 1.84%, and CPC was
installs. The app installs during phase 3 remained consistent US $0.26, whereas for Google, the CTR was 1.52%, and CPC
with the periods before and after the campaign, likely because was US $0.17. A contributing reason for our Google CTR
of the competing health information on the web during the (1.52%) being much lower than their Google CTR (5.8%) was
COVID-19 pandemic. our study’s efforts to message Spanish-speaking audiences, a
In total, the campaign generated 13,707 Google-driven installs, group that had lower Google CTRs (phase 2: 1.80%; phase 3:
which excludes the app installs from Facebook. With a US 1.65%) than the Google CTRs for English-speaking audiences
$12,750 Google budget, the Google-driven marketing messages (phase 2: 2.41%; phase 3: 2.49%; Table 2). Nevertheless, this
resulted in 13,707 users installing the CDC’s Milestone Tracker paid digital marketing campaign was shown to be on par with
app. industry benchmarks as well as a campaign with a similar public
health approach. In addition, the metrics from this study can
The CTR depicted the effectiveness of a marketing message, serve as a reference point for future digital marketing campaigns
particularly whether it could persuade the parents to click on that target parents with children agedJMIR PEDIATRICS AND PARENTING Arshanapally et al
and CPC, were used as proxies. Third, mobile app use could marketing campaigns on Google and Facebook to promote
not be tracked through this study. public health messages to parents of young children. As the
internet and social media have become an increasingly popular
Conclusions medium of accessing health information, public health
This study contributes to the literature by reporting on the organizations should consider paid digital marketing as a tactic
outcomes and providing a cost analysis of using paid digital for reaching target audiences on the web.
Acknowledgments
This study was supported by appointment to the Research Participation Program at the National Center on Birth Defects and
Developmental Disabilities, Centers for Disease Control and Prevention (CDC), administered by the Oak Ridge Institute for
Science and Education through an interagency agreement between the US Department of Energy and CDC. The findings and
conclusions in this report are those of the authors and do not necessarily represent the official position of the (US) CDC.
Conflicts of Interest
None declared.
References
1. Zablotsky B, Black LI, Maenner MJ, Schieve LA, Danielson ML, Bitsko RH, et al. Prevalence and trends of developmental
disabilities among children in the United States: 2009-2017. Pediatrics 2019 Oct;144(4):e20190811 [FREE Full text] [doi:
10.1542/peds.2019-0811] [Medline: 31558576]
2. Majnemer A. Benefits of early intervention for children with developmental disabilities. Seminars Pediatric Neurol 1998
Mar;5(1):62-69. [doi: 10.1016/s1071-9091(98)80020-x]
3. Demographics of mobile device ownership and adoption in the United States: mobile fact sheet. Pew Research Center.
URL: https://www.pewresearch.org/internet/fact-sheet/mobile/ [accessed 2022-03-22]
4. Downloading apps for children. Pew Research Center. URL: https://www.pewresearch.org/internet/2012/05/15/
downloading-apps-for-children/ [accessed 2022-03-22]
5. Moon RY, Mathews A, Oden R, Carlin R. Mothers' perceptions of the internet and social media as sources of parenting
and health information: qualitative study. J Med Internet Res 2019 Jul 09;21(7):e14289 [FREE Full text] [doi: 10.2196/14289]
[Medline: 31290403]
6. Plantin L, Daneback K. Parenthood, information and support on the internet. A literature review of research on parents and
professionals online. BMC Fam Pract 2009 May 18;10:34 [FREE Full text] [doi: 10.1186/1471-2296-10-34] [Medline:
19450251]
7. Pretorius K, Johnson KE, Rew L. An integrative review: understanding parental use of social media to influence infant and
child health. Matern Child Health J 2019 Oct 20;23(10):1360-1370. [doi: 10.1007/s10995-019-02781-w] [Medline: 31222601]
8. Boland B. Organic reach on Facebook: your questions answered. Facebook. URL: https://www.facebook.com/business/
news/Organic-Reach-on-Facebook [accessed 2022-03-22]
9. Manson M. Facebook zero: considering life after the demise of organic reach. Social@Ogilvy. URL: http://www.techenet.com/
wp-content/uploads/2014/03/Facebook-Zero-a-Social@Ogilvy-White-Paper.pdf [accessed 2022-03-22]
10. Mosseri A. News feed FYI: bringing people closer together. Facebook. URL: https://www.facebook.com/business/news/
news-feed-fyi-bringing-people-closer-together [accessed 2022-03-22]
11. Yang S, Ghose A. Analyzing the relationship between organic and sponsored search advertising: positive, negative, or zero
interdependence? Marketing Sci 2010 Jul;29(4):602-623. [doi: 10.1287/mksc.1090.0552]
12. About App campaigns. Google. URL: https://support.google.com/google-ads/answer/6247380?hl=en [accessed 2022-03-22]
13. Meta Ads Manager. Google Play. URL: https://play.google.com/store/apps/details?id=com.facebook.adsmanager&
hl=en_IN&gl=USt.google.com/google-ads/answer/6247380?hl=en [accessed 2022-03-22]
14. Plain Writing at CDC. Centers for Disease Control and Prevention. URL: https://www.cdc.gov/other/plainwriting.html
[accessed 2022-03-22]
15. Health equity guiding principles for inclusive communication. Centers for Disease Control and Prevention. URL: https:/
/www.cdc.gov/healthcommunication/Health_Equity.html [accessed 2022-03-22]
16. Google AdWords benchmarks for YOUR industry updated!. WordStream. URL: https://www.wordstream.com/blog/ws/
2016/02/29/google-adwords-industry-benchmarks [accessed 2022-03-22]
17. Irvine M. Facebook ad benchmarks for YOUR industry data. WordStream. URL: https://www.wordstream.com/blog/ws/
2017/02/28/facebook-advertising-benchmarks [accessed 2022-03-22]
18. Graham JE, Moore JL, Bell RC, Miller T. Digital marketing to promote healthy weight gain among pregnant women in
Alberta: an implementation study. J Med Internet Res 2019 Feb 01;21(2):e11534 [FREE Full text] [doi: 10.2196/11534]
[Medline: 30707100]
https://pediatrics.jmir.org/2022/2/e34425 JMIR Pediatr Parent 2022 | vol. 5 | iss. 2 | e34425 | p. 12
(page number not for citation purposes)
XSL• FO
RenderXJMIR PEDIATRICS AND PARENTING Arshanapally et al
Abbreviations
CDC: Centers for Disease Control and Prevention
CPC: cost per click
CPI: cost per install
CTR: click-through rate
GIF: graphics interchange format
PN: Porter Novelli
UAC: Universal App Campaigns
Edited by S Badawy; submitted 22.10.21; peer-reviewed by K Reuter, N Hu; comments to author 21.12.21; revised version received
04.02.22; accepted 27.02.22; published 05.04.22
Please cite as:
Arshanapally S, Green K, Slaughter K, Muller R, Wheaton D
Use of a Paid Digital Marketing Campaign to Promote a Mobile Health App to Encourage Parent-Engaged Developmental Monitoring:
Implementation Study
JMIR Pediatr Parent 2022;5(2):e34425
URL: https://pediatrics.jmir.org/2022/2/e34425
doi: 10.2196/34425
PMID:
©Suraj Arshanapally, Katie Green, Karnesha Slaughter, Robert Muller, Demeika Wheaton. Originally published in JMIR Pediatrics
and Parenting (https://pediatrics.jmir.org), 05.04.2022. This is an open-access article distributed under the terms of the Creative
Commons Attribution License (https://creativecommons.org/licenses/by/4.0/), which permits unrestricted use, distribution, and
reproduction in any medium, provided the original work, first published in JMIR Pediatrics and Parenting, is properly cited. The
complete bibliographic information, a link to the original publication on https://pediatrics.jmir.org, as well as this copyright and
license information must be included.
https://pediatrics.jmir.org/2022/2/e34425 JMIR Pediatr Parent 2022 | vol. 5 | iss. 2 | e34425 | p. 13
(page number not for citation purposes)
XSL• FO
RenderXYou can also read