Using a 24 h Activity Recall (STAR-24) to Describe Activity in Adolescent Boys in New Zealand: Comparisons between a Sample Collected before, and ...
←
→
Page content transcription
If your browser does not render page correctly, please read the page content below
International Journal of
               Environmental Research
               and Public Health

Article
Using a 24 h Activity Recall (STAR-24) to Describe Activity in
Adolescent Boys in New Zealand: Comparisons between a
Sample Collected before, and a Sample Collected during the
COVID-19 Lockdown
Meredith C. Peddie * , Tessa Scott                   and Jillian J. Haszard

                                          Department of Human Nutrition, Dunedin 9016, New Zealand; tessa.scott@otago.ac.nz (T.S.);
                                          jill.haszard@otago.ac.nz (J.J.H.)
                                          * Correspondence: Meredith.peddie@otago.ac.nz

                                          Abstract: Background: Tools that assess all three components of 24 h movement guidelines (sleep,
                                          physical activity, and screen use) are scarce. Our objective was to use a newly developed Screen Time
                                          and Activity Recall (STAR-24) to demonstrate how this tool could be used to illustrate differences
                                          in time-use across the day between two independent samples of male adolescents collected before
                                and during the COVID-19 lockdown. Methods: Adolescent boys aged 15–18 years (n = 109) each

                                          completed the STAR-24 twice, n = 74 before lockdown and n = 35 during lockdown. Results: During
Citation: Peddie, M.C.; Scott, T.;
                                          lockdown more than 50% of the sample reported gaming between 10 a.m. and 12 noon, transport was
Haszard, J.J. Using a 24 h Activity
                                          not reported as an activity, and activities of daily living spiked at mealtimes. Gaming and screen time
Recall (STAR-24) to Describe Activity
in Adolescent Boys in New Zealand:
                                          were more prevalent in weekends than weekdays, with the highest prevalence of weekday screen use
Comparisons between a Sample              (before lockdown) occurring between 8 and 9 p.m. Differences in estimates of moderate-to-vigorous
Collected before, and a Sample            physical activity prior to and during lockdown (mean difference (95% CI); 21 (−9 to 51) min) and
Collected during the COVID-19             sleep (0.5 (−0.2 to 1.2) h) were small. Total and recreational screen time were higher during lockdown
Lockdown. Int. J. Environ. Res. Public    (2 h (0.7 to 3.3 h) and 48 min (−36 to 132 min), respectively). Conclusions: The STAR-24 holds
Health 2021, 18, 8035. https://           promise as a single tool that assesses compliance with 24 h movement guidelines. This tool also
doi.org/10.3390/ijerph18158035            allows clear illustration of how adolescent boys are using their time (instead of only providing
                                          summary measures), providing richer data to inform public health initiatives.
Academic Editors: Belén
Martínez-Ferrer,
                                          Keywords: 24 h activity recall; 24 h activity; device measurement; physical activity; sleep; screen time;
Celeste León-Moreno and
                                          COVID 19
Ana Romero-Abrio

Received: 21 June 2021
Accepted: 26 July 2021
                                          1. Introduction
Published: 29 July 2021
                                               In line with many other countries including Canada [1] and Australia [2], the New
Publisher’s Note: MDPI stays neutral
                                          Zealand physical activity guidelines for children and adolescents include recommendations
with regard to jurisdictional claims in
                                          on sleep and recreational screen time [3]. While there is a multitude of studies that assess
published maps and institutional affil-   physical activity, sleep or screen time in isolation, few studies exist that have assessed all
iations.                                  three components together in the same sample. This may be because it is often difficult
                                          to combine the methods used to assess the individual components in a manner that then
                                          accurately represents time-use across a 24 h period in a contextually appropriate manner,
                                          that is not overly burdensome for both researchers and participants. While sleep and
Copyright: © 2021 by the authors.
                                          physical activity can be measured using accelerometers, accurate assessment of screen use
Licensee MDPI, Basel, Switzerland.
                                          during the same time period is rarely undertaken.
This article is an open access article
                                               Recently there has been a renewed interest in use-of-time recalls to assess 24 h activity
distributed under the terms and           because they have the ability to provide rich contextual information [4], they are less
conditions of the Creative Commons        subject to common bias that affects traditional questionnaires [5], and they result in better
Attribution (CC BY) license (https://     compliance than accelerometery [6]. However, most of the 24 h activity recalls currently
creativecommons.org/licenses/by/          in use require access to specialised computer programmes to administer them [4]. There-
4.0/).                                    fore, the original aim of this study was to compare the results of a simple, paper-based,

Int. J. Environ. Res. Public Health 2021, 18, 8035. https://doi.org/10.3390/ijerph18158035                   https://www.mdpi.com/journal/ijerph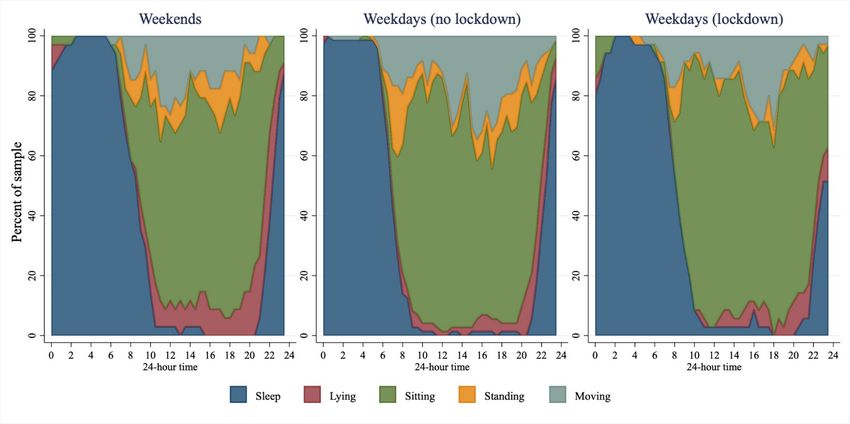
Int. J. Environ. Res. Public Health 2021, 18, 8035                                                                                2 of 11

                                        interviewer-administered 24 h activity recall with the results of accelerometery in a sample
                                        of male adolescents in New Zealand who were participating in the SuNDiAL (Survey of
                                        Nutrition, Dietary Assessment and Lifestyle) 2020 study.
                                              However, in March 2020 when data collection for the SuNDiAL project had already be-
                                        gun, the COVID-19 global pandemic hit New Zealand. On 23 March it was announced that
                                        from 25 March New Zealand would enter into a 4 week lockdown, where everyone (except
                                        for essential workers) would be required to stay home, to exercise in their local neighbour-
                                        hood, and to only make trips for food and medicine. Schools, sports facilities, gyms and
                                        playgrounds were all closed, and learning was conducted remotely [7]. What occurred in
                                        the following weeks was one of the strictest lockdowns in the world, with high adherence
                                        by the population [8]. While there is some evidence emerging that indicates decreases in
                                        physical activity and increases in screen time as a result of the global pandemic-related
                                        restrictions [9], most of these data are retrospective, based on self-reported changes [10,11],
                                        or small longitudinal studies that have not captured the entire 24 h day [12]. The lock-
                                        down in New Zealand meant that recruitment for SuNDiAL 2020 and the movement of
                                        accelerometers around the country to collect data was suspended. However, where possible
                                        data collection was continued remotely (over phone or video calls) with participants who
                                        had already enrolled in the study, providing an opportunity to describe the 24 h activity
                                        patterns of two groups—one before and one during lockdown. Therefore, the revised aim
                                        of this study was to describe the 24 h activity patterns measured via the Screen Time and
                                        Activity Recall (STAR-24) in samples of adolescent boys before and during New Zealand’s
                                        level 4 COVID-19 lockdown. A further aim was to show how this tool could be used to
                                        illustrate differences in 24 h time-use across the day for different populations in different
                                        environmental settings.

                                        2. Materials and Methods
                                        2.1. Study Design
                                             The data used in this study were collected as part of the larger SuNDiAL (Survey of
                                        Nutrition, Dietary Assessment and Lifestyles) 2020 project. This study was a nationwide
                                        cross-sectional survey of male adolescents in New Zealand (NZ). The main aim of SuNDiAL
                                        2020 was to describe the nutritional status, dietary habits, health status, attitudes and
                                        motivations for food choice, 24 h activity patterns and screen time of adolescent boys.
                                        Many of the methods mirror closely those used for the ‘sister’ study (SuNDiAL 2019) that
                                        focused on female adolescents and are described here [13]. The sample size required for
                                        the primary objective (to estimate mean nutrient intakes with a +/− 0.2SD 95% precision
                                        interval) was n = 100. To allow for drop-outs, incomplete data and small design effect from
                                        school clusters the aim was to recruit 150 adolescent boys. The study was approved by
                                        the University of Otago Human Ethics committee (Health): H20/004. Online informed
                                        consent was obtained from all participants and from parents/guardians for those under
                                        16 years. The study is registered with the Australian New Zealand Clinical Trials Registry:
                                        ACTRN12620000185965.
                                             To correspond with data collector ability and school terms, data collection was planned
                                        to be conducted in two phases, February to April 2020 and July to September 2020. How-
                                        ever, recruitment was halted on the 23 March 2020 when it was announced the country
                                        was going into level 4 lockdown [7] as a result of the COVID-19 pandemic. Data collection
                                        continued for the recruited participants where it was possible to do so in an online setting.

                                        2.2. Participants
                                             Initially, all high schools who had male students enrolled with a total roll of greater
                                        than 400 that were in the predetermined data collection areas across New Zealand were
                                        emailed an invitation to participate. The five locations in the first phase (Otago, Christchurch,
                                        Wellington, Bay of Plenty, and Auckland) were chosen based on the living arrangements of
                                        the data collectors, who were second-year Master of Dietetics students from the Univer-
                                        sity of Otago, Dunedin. Adolescent boys were then recruited from the schools through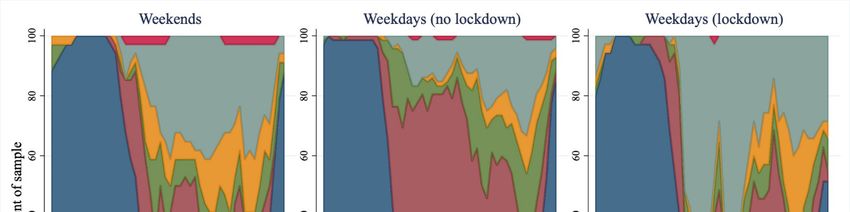
Int. J. Environ. Res. Public Health 2021, 18, 8035                                                                               3 of 11

                                        presentations to individual classes, year groups, or the whole school. Adolescents who
                                        were enrolled in one of the participating schools, were between 15 and 18 years of age,
                                        who self-identified as male and who could speak and understand English were eligible
                                        to participate.

                                        2.3. Study Protocol
                                              Most of the data collection was conducted at school during school hours. Prior to
                                        the in-school data collection appointments, participants provided consent and completed
                                        a questionnaire via an online REDCap survey. The questionnaire included basic demo-
                                        graphic and health questions, as well as questions on dietary patterns, and attitudes and
                                        motivations towards food choice [13]. Each participant was then scheduled to participate
                                        in an in-school data collection visit that took approximately 60 min to complete. This
                                        in-school visit included anthropometric measures (weight and height), assessment of blood
                                        pressure, a 24 h diet recall, and the STAR-24 described here. A follow up data collection
                                        visit was performed the following week, over Zoom/Facetime/phone, to collect a second
                                        diet and activity recall. After the announcement of the lockdown, all 24 h recall data were
                                        collected remotely only (over phone or video calls) and the in-person collection of this
                                        data ceased.

                                        2.4. Previous Day Screen Time and Activity
                                             The STAR-24 was developed by the authors based on the Previous Day Physical Activ-
                                        ity Recall [14], and the authors’ experiences of conducting 24 h dietary recalls [13]. Previous
                                        recalls of a similar nature have been shown to produce estimations of light and moderate
                                        intensity physical activity that are similar to estimates produced by accelerometry [4]. The
                                        STAR-24 was conducted using a multiple pass technique. In the first pass, participants
                                        were asked to identify the dominant activity for each 30 min time block from midnight to
                                        midnight of the day immediately preceding the day of the week data was being collected
                                        on. Data collectors categorised the reported activity into one of 13 possible categories that
                                        included sleep, schoolwork, activities of daily living, and physical activity at the time of
                                        administration (see Supplementary Table S1). When more than one activity occurred in
                                        a 30 min block, participants were encouraged to prioritise activities based on time, and
                                        then energy expenditure. In the second pass participants were asked to assign an intensity
                                        (sleep, very light intensity, light intensity, medium intensity or hard/vigorous intensity)
                                        to each activity they had identified in the first pass. Descriptions of these intensities were
                                        provided to the participants (see Supplementary Table S2). In the third pass, participants
                                        were asked to identify the posture they performed each activity in (lying, sitting, standing
                                        or stepping/moving). In the final pass participants were asked to identify which activities
                                        involved screen use as either none, phone, TV, computer/laptop or tablet/iPad. When
                                        more than one screen was used in the 30 min block participants were encouraged to identify
                                        the screen that was interacted with the most over that time period. Administration of each
                                        STAR-24 took ~15 min.
                                             The same protocol was followed for a second recall that was carried out on a different
                                        day of the week so that, ideally, a weekend day and a weekday was captured for each
                                        participant. Weighted estimates of time spent in each category were calculated for each par-
                                        ticipant, where weekends contributed 2/7 and weekdays contributed 5/7. If participants
                                        only provided one day of data then estimates were not weighted.

                                        2.5. Anthropometric Measurements
                                              Measurements of weight (measured using one of Medisana PS420; Salter 9037 BK3R;
                                        Seca Alpha 770; or Soehnle Style Sense Comfort 400 scales) and height (measured using a
                                        Seca 213 or Wedderburn stadiometer) were taken in duplicate with the participant wearing
                                        light clothing and no footwear, and recorded to the nearest 0.1 kg or cm, respectively. Body
                                        mass index (BMI) was calculated and then converted to z-scores using the WHO child
Int. J. Environ. Res. Public Health 2021, 18, 8035                                                                             4 of 11

                                        growth standards [15], and participants were classified as overweight if their BMI z-score
                                        was >1.

                                        2.6. Statistical Analysis
                                              All statistical analysis was carried out using Stata 16.1 (StataCorp, College Station,
                                        TX, USA). While the original aim was to validate the STAR-24 against accelerometry, the
                                        lockdown resulted in insufficient data to be able to do this.
                                              To compare demographics between the samples before and during lockdown, un-
                                        paired, two-tailed t-tests were used for continuous variables and Fisher’s exact tests for
                                        categorical variables. To illustrate how the STAR-24 data can be used to describe the time
                                        use of the sample across 24 h, stacked area charts were used. These were split up to repre-
                                        sent three different types of day: weekends, weekdays before lockdown, and weekdays
                                        during lockdown. Only one day from each participant was used in each plot—if they had
                                        two days available (e.g., if they had data for two weekdays before lockdown), then the
                                        first day was chosen. Some categories were further collapsed to more easily illustrate the
                                        data (these are described alongside each figure). Stacked area charts were generated for
                                        activities, intensity, posture, and screen use.
                                              Estimated time in each activity, intensity, posture or using screens was described
                                        for the full sample using medians, 25th and 75th percentiles. As not everyone did each
                                        activity, this was also presented for those who did the activity, along with the number of
                                        participants and proportion of the sample.
                                              To determine how lockdown might have influenced time spent asleep, in MVPA,
                                        and using screens, estimated durations from STAR-24 were used. As the data collected
                                        before lockdown were from a different sample than those collected during lockdown,
                                        linear regression models were used to estimate mean differences in time with adjustment
                                        for age, ethnicity, and deprivation. Residuals of models were plotted and assessed for
                                        heteroskedasticity and normality.

                                        3. Results
                                        3.1. Participants
                                             All participants (n = 146) consented, completed online questionnaires and had anthro-
                                        pometrics collected prior to lockdown. Of those participants 109 completed at least one
                                        STAR-24, 74 of which were completed before lockdown, and 35 of which were completed
                                        during lockdown (Figure 1). The mean age (SD) of participants was 16.6 (0.7) years, 76% of
                                        the sample lived in areas of low to moderate deprivation and 67% were categorised as
                                        having a healthy BMI [15] (Table 1). The participants who completed the STAR-24 during
                                        lockdown were of a similar age (p = 0.894) but were more likely to: identify as Asian
                                        ethnicity (p < 0.001); live in an area of low deprivation (p = 0.005) and have a BMI z-score
                                        that categorised them as normal weight (p = 0.088), when compared to participants who
                                        completed the STAR-24 before lockdown.

                                                     Table 1. Characteristics of the samples (n = 109).

                                                                                         Completed STAR-24   Completed STAR-24
                   Characteristic                                    All
                                                                                          before Lockdown     during Lockdown
                      N                                              109                           74               35
              Age, mean (SD) years                                16.6 (0.7)                    16.6 (0.7)       16.6 (0.8)
                Ethnicity, n (%)
                                                                   NZEO a                       68 (61.8)         55 (73.3)
                                                                    Māori                      10 (9.1)          10 (13.3)
                                                                    Asian                       32 (29.1)         10 (13.3)
     Household area deprivation b , n (%)
                                                                     Low                        36 (34.6)         20 (28.6)
                                                                   Medium                       43 (41.4)         27 (38.6)
                                                                     High                       25 (24.0)         23 (32.9)
            BMI z-score c , mean (SD)                             0.38 (1.15)                  0.50 (1.15)       0.04 (1.09)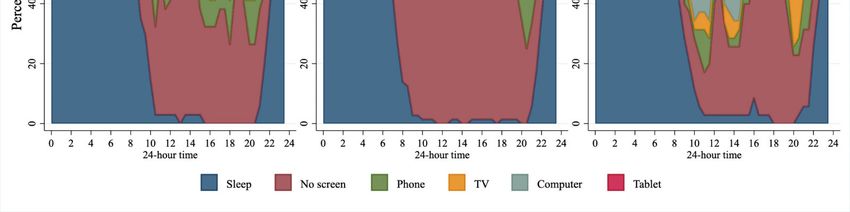
Age, mean (SD) years 16.6 (0.7) 16.6 (0.7) 16.6 (0.8)
Ethnicity, n (%)
NZEO a 68 (61.8) 55 (73.3)
Māori 10 (9.1) 10 (13.3)
Int. J. Environ. Res. Public Health 2021, 18, 8035
Asian 32 (29.1) 10 (13.3) 5 of 11
Household area deprivation b, n (%)
Low 36 (34.6) 20 (28.6)
Medium 43 (41.4) 27 (38.6)
Table 1. Cont.
High 25 (24.0) 23 (32.9)
BMI z-score c, mean (SD) 0.38 (1.15) 0.50
Completed (1.15)
STAR-24 before 0.04 (1.09)
Completed STAR-24 during
Characteristic All
Weight status c, n (%) Lockdown Lockdown
Weight status c, n (%) Normal weight 64 (67.4) 44 (62.9)
Overweight
Normal weight 26 (27.4)
64 (67.4) 22 (31.4)
44 (62.9)
Overweight
Obese 5 (5.3)(27.4)
26 4 (5.7) (31.4)
22
Obese 5 (5.3) 4 (5.7)
a NZEO—New Zealand European and Others, this includes those who chose not to specify (n = 4).b Household level dep-
a NZEO—New Zealand European and Others, this includes those who chose not to specify (n = 4). b Household level deprivation measured
rivation measured using the NZDep2018 index split into deciles: Low (1–3); Medium (4–7); High (8–10). N = 4 participants
using the NZDep2018 c
were missing NZDep data.index
c BMIsplit into deciles:
z-scores Low (1–3);
calculated usingMedium (4–7); High
WHO growth (8–10).
charts, withN =overweight
4 participants
>1were missing
z-score andNZDep
obese data.
> 2 BMI
z-scores calculated using WHO growth charts, with overweight > 1 z-score and obese > 2 z-scores. N = 14 participants did not have BMI
z-scores. N = 14 participants did not have BMI z-score data.
z-score data.
Figure 1. Participant flow chart.
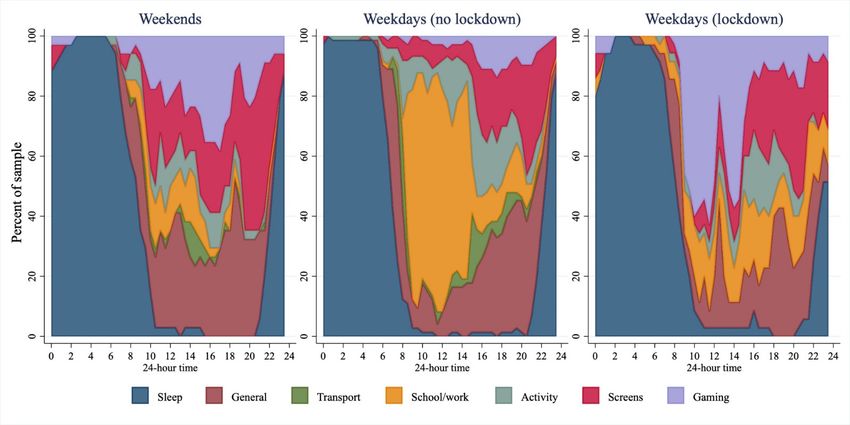
3.2. 24 h Activity before and during Lockdown
Figure 2 presents data from STAR-24, with weekdays separated by lockdown status.
Prior to lockdown, on weekdays more than 80% of the sample was awake by 8:00 a.m.;
most of the sample reported schoolwork between 9:00 a.m. and 3:00 p.m. with screen use
becoming more prevalent throughout the afternoon and evening. Approximately 80% of
the sample reported being asleep by 10:00 p.m. During lockdown, transport disappeared
as a reported activity, while gaming was markedly higher (more than 50% of the sample
reported gaming between 10:00 a.m. and 12:00 noon). While there was only a small, non-
statistically significantly higher amount of total sleep reported in those during lockdown
(Table 2), sleep measured during lockdown appeared to happen later: 80% of the sample
were asleep by midnight, with wakeup times closer to 10:00 a.m. The median times spent in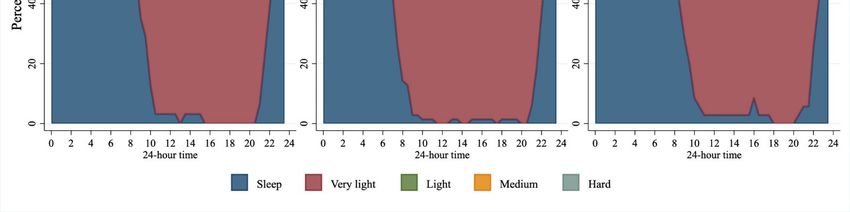
Median (25th, 75th percen- Mean difference (95%
                                             Median (25th, 75th percentiles)
                                                                                              tiles)                   CI) a
                 Sleep, hours                           9.0 (8.0, 10.0)                  9.8 (8.8, 10.3)          0.5 (−0.2, 1.2)
              MVPA, minutes                                45 (0, 90)                     60 (30, 105)              21 (−9, 51)
Int. J. Environ. Res. Public Health 2021, 18, 8035                                                                                6 of 11
         Screen time (total), hours                      6.4 (4.8, 9.0)                  9.7 (8.0, 11.2)           2.0 (0.7, 3.3)
     Screen time (outside of school
                                                         3.6 (1.8, 5.5)                 5.0 (2.5, 8.0)           0.8 (−0.6, 2.2)
                work), hours
                                         each activity for the full sample, and for those who displayed the behaviour are presented
         a Mean difference (95% CI) estimated using regression models adjusted for age, ethnicity, and deprivation. N = 5 missing

         demographic data.               in Supplementary Table S3.

     Figure 2. Activities across 24 h for weekends (n = 34), weekdays before lockdown (n = 73), and weekdays during lockdown
      Figure 2. Activities across 24 h for weekends (n = 34), weekdays before lockdown (n = 73), and weekdays during lockdown
     (n = 35). ‘General’ included activities of daily living; ‘Transport’ included car/bus/train/e-scooter; ‘Activity’ included
      (n = 35). ‘General’ included activities of daily living; ‘Transport’ included car/bus/train/e-scooter; ‘Activity’ included active
     active transport, PE, sport, or other physical activity; ‘Screens’ included TV, computers, phones, not including gaming; and
     ‘Gaming’ included games played on PC, playstation, Xbox, Switch, mobile, etc.

                                              Table 2. 24-h time-use factors by lockdown (n = 109).

                                              before Lockdown                        during Lockdown
                                                   (n = 74)                               (n = 35)
                                      Median (25th, 75th percentiles)         Median (25th, 75th percentiles)         Mean difference (95% CI) a
           Sleep, hours                       9.0 (8.0, 10.0)                         9.8 (8.8, 10.3)                      0.5 (−0.2, 1.2)
          MVPA, minutes                         45 (0, 90)                             60 (30, 105)                          21 (−9, 51)
   Screen time (total), hours                    6.4 (4.8, 9.0)                         9.7 (8.0, 11.2)                       2.0 (0.7, 3.3)
    Screen time (outside of
                                                 3.6 (1.8, 5.5)                          5.0 (2.5, 8.0)                      0.8 (−0.6, 2.2)
     school work), hours
     a   Mean difference (95% CI) estimated using regression models adjusted for age, ethnicity, and deprivation. N = 5 missing demographic data.

                                            Moderate to vigorous physical activity was not significantly lower during compared
                                      to before lockdown (Table 2). The pattern of accumulation of moderate-to-hard inten-
                                      sity activity did not differ dramatically across the sample before and during lockdown
                                      (Figure 3).
                                            Total screen use was 2 h (95% CI 0.7 to 3.3 h) higher during lockdown, compared
                                      to before lockdown, although recreational screen time was not statistically significantly
                                      higher during lockdown (difference 0.8 h; 95% CI −0.6 to 2.2 h). However, Figures 2 and 4
                                      illustrate a marked difference in the pattern of screen use before and during lockdown:
                                      computers appeared to be more widely used throughout the middle of the day during
                                      lockdown, corresponding with the higher rates of gaming reported. TV use was more
                                      widespread during lockdown, particularly in the evening, while phone use seemed to be
                                      lower. Tablet use does not seem to make a large contribution to screen use in this group.
widespread during lockdown, particularly in the evening, while phone use seemed to be
lower. Tablet use does not seem to make a large contribution to screen use in this group.
During waking hours sitting was the most predominant posture. Before lockdown,
~60% of the sample reported being seated at any one time. This appeared to hold true
during lockdown, although there was a higher prevalence of sitting, and a lower preva-
Int. J. Environ. Res. Public Health 2021, 18, 8035 7 of 11
lence of standing between 8 am and 10 am during lockdown compared to before lock-
down (Figure 5).
Figure 3. Intensity of activity across 24 h for weekends (n = 31), weekdays before lockdown (n = 72), and weekdays
Figure 3. Intensity of activity across 24 h for weekends (n = 31), weekdays before lockdown (n = 72), and weekdays during
during lockdown (n = 35). Very light intensity—activities that involve very little or no movement, breathing rate is slow;
lockdown (n = 35). Very light intensity—activities that involve very little or no movement, breathing rate is slow;
Light intensity—activities that involved some movement, but do not elevate breathing rate; Medium intensity—moving
Light intensity—activities
Int. J. Environ. Res. Public Health 2021, 18,that involved
x FOR some movement, but do not elevate breathing rate; Medium inten-8 of 12
PEER REVIEW
quickly/briskly, breathing rate is increased but you can still talk; Hard/vigorous intensity—moving very quickly, breathing
sity—moving quickly/briskly, breathing rate is increased but you can still talk; Hard/vigorous intensity—
so hard you cannot talk at the same time.
moving very quickly, breathing so hard you cannot talk at the same time.
Figure 4. Screen use across 24 h for weekends (n = 34), weekdays before lockdown (n = 72), and weekdays during lockdown
Figure 4. Screen use across 24 h for weekends (n = 34), weekdays before lockdown (n = 72), and weekdays during lockdown
(n = 35). If multiple screens in use then the one they were interacting with most was prioritised.
(n = 35). If multiple screens in use then the one they were interacting with most was prioritised.
During waking hours sitting was the most predominant posture. Before lockdown,
~60% of the sample reported being seated at any one time. This appeared to hold true
during lockdown, although there was a higher prevalence of sitting, and a lower prevalence
of standing between 8 a.m. and 10 a.m. during lockdown compared to before lockdown
(Figure 5).Int. J. Environ. Res. Public Health 2021, 18, 8035 8 of 11
Figure 4. Screen use across 24 h for weekends (n = 34), weekdays before lockdown (n = 72), and weekdays during lockdown
(n = 35). If multiple screens in use then the one they were interacting with most was prioritised.
Figure 5. Posture across 24 h for weekends (n = 34), weekdays before lockdown (n = 72), and weekdays during lockdown
Figure 5. Posture across 24 h for weekends (n = 34), weekdays before lockdown (n = 72), and weekdays during lockdown
(n = 35).
(n = 35).
4. Discussion
4. Discussion
The results of this study illustrate that STAR-24 has the ability to describe 24 h activity
The of
patterns results of this study
adolescence boysillustrate that
with rich STAR-24
detail, and has the abilitydifferences
to illustrate to describe in
24 time
h activ-
use
ity patterns
between theof adolescence
two boys withprior
samples collected rich to
detail,
and and to illustrate
during the level differences
4 COVID-19 in lockdown
time use
between
in the two samples
New Zealand. There didcollected prior to
not appear to and
be aduring
marked the level 4 COVID-19
difference lockdown
in total sleep in
between
New Zealand. There did not appear to be a marked difference in total sleep
the two samples. However, the stacked area charts allowed for easy visualisation of thebetween the
differences in when sleep was occurring. Most of the lockdown sample went to bed later
and got up later in comparison to the pre-lockdown sample.
In contrast to other literature [9], MVPA of those in lockdown was not dramatically
lower than the MVPA of those prior to lockdown. In fact, if anything the lockdown sample
were doing slightly more MVPA than those who were assessed prior to lockdown. While
parks and recreational facilities were closed, it is possible that messages to be physically
active during the lockdown were more strongly expressed in New Zealand. For example,
organisations encouraged the public to include physical activity in lockdown routines [16]
and the state owned broadcaster (TVNZ) aired Les Mills’ virtual classes at 9 a.m. and
3 p.m. daily on two TV channels, with the classes also available on TVNZ on demand [17].
Interestingly, despite other measured components of the day differing in their timing
(e.g., sleep), the timing of MVPA did not differ dramatically during lockdown, although
timing of activity was variable with medium and hard intensity activities being reported at
almost every time point during waking hours across the sample both prior to and during
lockdown (i.e., at least one person reported during activity of moderate and hard intensity
in almost every 30 min increment across the day).
Median leisure time screen time (screen time not for schoolwork) was higher than
the recommended two hours a day for this age group both before (3.6 h) and during
lockdown (5 h). Total screen time, however, was two hours greater in the sample under
lockdown compared to those not in lockdown. Differences in total screen time appear to
be driven mostly by an increase in gaming that was the predominant activity reported
in the mid-morning during lockdown, with more than half the sample reporting gaming
at around 10 am. This might suggest that boys were replacing schoolwork with gaming.
However, at the beginning of lockdown (when most of these data were collected) many
schools had teacher-only days to facilitate the move to online learning, and school holidays
were brought forward [18], so it is likely that the boys did legitimately have less schoolInt. J. Environ. Res. Public Health 2021, 18, 8035 9 of 11
work to complete over this time. Higher rates of screen time in adolescents have been
associated with several poorer health outcomes including insulin resistance [19], higher
BMI [20], and increased likelihood of metabolic syndrome [21]. Additionally, video games
and computer use (as opposed to TV viewing) have also been associated with reporting of
more severe depressive symptoms [22]. Clearly any health messages developed around
ongoing or future lockdowns should consider targeting reductions in screen time.
The STAR-24 provided rich, contextual information on the time-use of samples of
adolescent males before and during COVID-19 lockdown. Illustration of their time-use
showed that gaming was a prevalent activity during lockdown. Other noticeable differences
that occurred during lockdown include that no transport was reported during lockdown
(compared to pre-lockdown), and patterns of activities of daily living changed markedly.
While the reduction in transport is not unexpected given the lockdown restrictions [7],
any reduction in active transport must have been replaced with other activity as overall
moderate-to-hard intensity activity was not lower in those during lockdown. Interestingly,
during lockdown activities of daily living seemed to spike around mealtimes, with ~50% of
the sample reporting being involved in activities of daily living around lunch and dinner
time. These peaks are also observed in weekends prior to lockdown, but the percentage
of boys doing activities of daily living at any point during waking hours is higher, so
these peaks are less exaggerated. It seems likely that these peaks represent the adolescent
boys taking an active role in meal preparation or clean up but differentiating this from
other activities of daily living was not possible. Given the paper-based administration
of STAR-24, asking participants to differentiate activities of daily living into further sub-
categories would be easily achieved if the focus of future research required it. The ability
of STAR-24 to provide contextual information of this level is promising, particularly given
that activities outside traditional MVPA may become the focus of future interventions in
line with the new WHO recommendations that indicate that #everymovecounts [23].
Unfortunately, the lockdown meant that we were unable to collect enough accelerom-
eter data to conduct any sort of validation of STAR-24. Ideally, in the future STAR-24 will
be validated against a combination of data from wearable cameras and accelerometery
collected in a manner that allows within participant comparisons of the same day. The
use of both accelerometery and wearable cameras would allow for validation of not just
estimates of sedentary time, physical activity and sleep, but also screen time and other
contextual information that could not be validated by accelerometry alone. Clearly, how-
ever, this simple, easy-to-perform, paper-based activity recall holds promise as a means of
assessing 24 h activity patterns, physical activity, posture and screen time at a population
level. Moreover, it does so in a manner that is less burdensome to both participants and
researchers, when compared to accelerometry, and more accurate when compared to other
self-report measures [4].
Limitations
The major limitation of the work presented here is that the original aim was not
achievable given the COVID-19 lockdown, and the overall study was not designed to
investigate the effects of a lockdown on 24 h time use. As a result, instead of comparing
the activity of the same sample measured before and during lockdown using a validated
assessment tool (which would have been the ideal), this study describes the 24 h activities
of two samples of boys who differ in ways other than just their lockdown status using
a tool that has yet to be formally validated. We have accounted for these limitations by
adjusting for demographic differences in any comparisons. In doing so, we acknowledge
that the differences presented here do not truly reflect changes to 24 h activity patterns as
a result of the COVID-19 lockdown in New Zealand but rather differences between two
similar samples in different lockdown situations.
STAR-24 itself does have some limitations that could be rectifiable by us or others
during future validation studies. Upon reflection, and when compared to other 24 h activity
recalls, 30 min increments of time are probably too big to represent some of the subtletiesInt. J. Environ. Res. Public Health 2021, 18, 8035 10 of 11
of movement accumulation, especially given that MVPA has been shown to mostly be
accumulated in very short bouts in New Zealand female adolescents [24]. However, any
smaller time increment would increase participant burden markedly and accuracy would
depend on the ability of the participant to remember more detail about the previous day.
While paper-based questionnaires require less resources to develop and administer, the
presence of an interviewer may increase the likelihood of social desirability bias that may
be lessened by self-administration. In addition, STAR-24 asked participants to identify the
single screen that was most dominant in each 30 min time increment; however, the use of
multiple screens at once has been reported in this age group. Therefore, future adaptions
of STAR-24 could include the categorisations of secondary, and possible tertiary screens
used in each time increment.
5. Conclusions
The COVID-19 lockdown in New Zealand likely impacted the 24 h activity of adoles-
cent males, with more gaming during the day, and sleep timing—but not duration—shifting
by about two hours. The STAR-24 holds promise to provide rich contextual information
in a manner that is less burdensome to participants and researchers when compared to
accelerometery and is likely more accurate than other self-report measures. It also has the
ability to measure, with a single instrument, all the components of current physical activity
guidelines for this age group, which, at least in New Zealand, contain messages about
MVPA, sleep and screen time [25]. However, formal validation is still required.
Supplementary Materials: The following are available online at https://www.mdpi.com/article/10
.3390/ijerph18158035/s1, Table S1: Coding of possible activity reported in STAR-24, Table S2: Coding
of possible intensities reported in STAR-24, Table S3: Median (25th, 75th) percentiles of 24 h time use
(n = 109).
Author Contributions: Conceptualization, J.J.H. and M.C.P.; methodology, J.J.H., M.C.P., T.S.; formal
analysis, J.J.H.; investigation, J.J.H., M.C.P., T.S.; resources, M.C.P.; data curation, J.J.H.; writing—
original draft preparation, M.C.P.; writing—review and editing, J.J.H., M.C.P., T.S.; visualization,
J.J.H.; supervision, J.J.H. and M.C.P.; project administration, T.S. All authors have read and agreed to
the published version of the manuscript.
Funding: This research received no external funding.
Institutional Review Board Statement: The study was conducted according to the guidelines of the
Declaration of Helsinki, and approved by the University of Otago Human Ethics Committee (Health)
(H20/004, 10 February 2020).
Informed Consent Statement: Informed consent was obtained from all subjects involved in the study.
Data Availability Statement: The datasets generated for this study are available upon reasonable
request to the corresponding author.
Acknowledgments: We thank the Master of Dietetics students enrolled in HUND 5B in 2020 who
worked vigilantly as the study data collectors in this study both prior to and during the COVID-19
lockdown.
Conflicts of Interest: The authors declare no conflict of interest.
References
1. Tremblay, M.S.; Carson, V.; Chaput, J.P.; Gorber, S.C.; Dinh, T.; Duggan, M.; Faulker, G.; Gary, C.E.; Gruber, R.; Janson, K.; et al.
Canadian Society for Exercise Physiology Candian 24-hour Movement Guidelines For Children and Youth.An Integration of
Physical Activity, Sedentary Behaviour, and Sleep. 2016. Available online: https://csepguidelines.ca/children-and-youth-5-17/
(accessed on 21 June 2021).
2. Australian Government Department of Health. Australian 24-hour Movement Guidelines for Children and Young People (5–17
Years). An Integration of Physical Activity, Sedentary Behaviour and Sleep; Australian Government Department of Health: Canberra,
Australia, 2018.
3. Ministry of Health. Children and Young People (5–17 Years) ‘Sit Less, Move More, Sleep Well’. 2017. Available online:
https://www.health.govt.nz/our-work/preventative-health-wellness/physical-activity#kids/ (accessed on 21 June 2021).Int. J. Environ. Res. Public Health 2021, 18, 8035 11 of 11
4. Matthews, C.E.; Berrigan, D.; Fischer, B.; Gomersall, S.R.; Hillreiner, A.; Kim, Y.; Leitzmann, M.F.; Maurice, P.; Olds, T.; Welk, G.J.
Use of previous-day recalls of physical activity and sedentary behavior in epidemiologic studies: Results from four instruments.
Bmc Public Health 2019, 19, 478. [CrossRef] [PubMed]
5. Matthews, C.E.; Keadle, S.K.; Sampson, J.; Lyden, K.; Bowles, H.R.; Moore, S.C.; Libertine, A.; Freedson, P.S.; Fowke, J.H.
Validation of a Previous-Day Recall Measure of Active and Sedentary Behaviors. Med. Sci. Sports Exerc. 2013, 45, 1629–1638.
[CrossRef]
6. Kozey-Keadle, S. Validation of previous day recalls. In ACSM 2020 Virtual Expereince. 2020. Available online: https://www.
acsm.org/blog-detail/acsm-certified-blog/2020/06/17/acsm-2020-virtual-experience-is-here/ (accessed on 10 November 2020).
7. New Zealand Government. Unite against COVID-19. About the Alert System 2020. Available online: https://covid19.govt.nz/
alert-system/about-the-alert-system/#alert-level-4-%E2%80%94-lockdown (accessed on 10 November 2020).
8. Jefferies, S.; French, N.; Gilkison, C.; Graham, G.; Hope, V.; Marshall, J.; McElnay, C.; McNeill, A.; Muellner, P.; Paine, S.; et al.
COVID-19 in New Zealand and the impact of the national response: A descriptive epidemiological study. Lancet Public Health
2020, 5, e612–e623. [CrossRef]
9. Bates, L.C.; Zieff, G.; Stanford, K.; Moore, J.B.; Kerr, Z.Y.; Hanson, E.D.; Gibbs, B.B.; Kline, C.E.; Stoner, L. COVID-19 Impact on
Behaviors across the 24-Hour Day in Children and Adolescents: Physical Activity, Sedentary Behavior, and Sleep. Children 2020,
7, 138. [CrossRef] [PubMed]
10. Guerrero, M.D.; Vanderloo, L.M.; Rhodes, R.E.; Faulkner, G.; Moore, S.A.; Tremblay, M.S. Canadian children’s and youth’s
adherence to the 24-h movement guidelines during the COVID-19 pandemic: A decision tree analysis. J. Sport Health Sci. 2020, 9,
313–321. [CrossRef] [PubMed]
11. Moore, S.A.; Faulkner, G.; Rhodes, R.E.; Brussoni, M.; Chulak-Bozzer, T.; Ferguson, L.J.; Mitra, R.; O’Reilly, N.; Spence, J.C.;
Vanderloo, L.M.; et al. Impact of the COVID-19 virus outbreak on movement and play behaviours of Canadian children and
youth: A national survey. Int. J. Behav. Nutr. Phy. 2020, 17, 85. [CrossRef] [PubMed]
12. Zenic, N.; Taiar, R.; Gilic, B.; Blazevic, M.; Maric, D.; Pojskic, H.; Sekulic, D. Levels and Changes of Physical Activity in Adolescents
during the COVID-19 Pandemic: Contextualizing Urban vs. Rural Living Environment. Appl. Sci. 2020, 10, 3997. [CrossRef]
13. Peddie, M.; Ranasinghe, C.; Scott, T.; Heath, A.-L.; Horwath, C.; Gibson, R.; Brown, R.; Houghton, L.; Haszard, J. Dietary
intakes, nutrient status and lifestyles of New Zealand female adolescent vegetarians and non-vegetarians: Methods of a clustered,
cross-sectional survey. Jmir. Res. Protoc. 2020, 9, e17310. [CrossRef] [PubMed]
14. Weston, A.T.; Petosa, R.; Pate, R.R. Validation of an instrument for measurement of physical activity in youth. Med. Sci. Sports
Exerc. 1997, 29, 138–143. [CrossRef] [PubMed]
15. Onis, M.; Onyango, A.W.; Borghi, E.; Siyam, A.; Nishida, C.; Siekmann, J. Development of a WHO growth reference for
school-aged children and adolescents. Bull World Health Organ. 2007, 85, 660–667. [CrossRef] [PubMed]
16. Hursthouse, N. Keeping the Bodt and Mind Well in Self-Isolation. 2020. Available online: https://www.heartfoundation.org.nz/
about-us/news/blogs/keeping-the-body-and-mind-well-in-self-isolation (accessed on 15 December 2020).
17. TVNZ. Daily Free Les Mills Fitness Workouts Launch Today on TVNZ. 2020. Available online: https://www.tvnz.co.nz/one-
news/new-zealand/daily-free-les-mills-fitness-workouts-launch-today-tvnz (accessed on 15 December 2020).
18. Minstry of Education. School Term and Holiday Dates. 2020. Available online: https://www.education.govt.nz/school/school-
terms-and-holiday-dates/#cal2020 (accessed on 15 December 2020).
19. Hardy, L.L.; Denney-Wilson, E.; Thrift, A.P.; Okely, A.D.; Baur, L.A. Screen Time and Metabolic Risk Factors Among Adolescents.
Arch. Pediat. Adol. Med. 2010, 164, 643–649. [CrossRef] [PubMed]
20. Falbe, J.; Rosner, B.; Willett, W.C.; Sonneville, K.R.; Hu, F.B.; Field, A.E. Adiposity and Different Types of Screen Time. Pediatrics
2013, 132, e1497–e1505. [CrossRef] [PubMed]
21. Mark, A.E.; Janssen, I. Relationship between screen time and metabolic syndrome in adolescents. J. Public Health 2008, 30, 153–160.
[CrossRef] [PubMed]
22. Maras, D.; Flament, M.F.; Murray, M.; Buchholz, A.; Henderson, K.A.; Obeid, N.; Goldfield, G.S. Screen time is associated with
depression and anxiety in Canadian youth. Prev. Med. 2015, 73, 133–138. [CrossRef] [PubMed]
23. WHO. Guidelines on Physical Activity and Sedentary Behaviour; WHO: Geneva, Switzerland, 2020.
24. Tye, L.S.; Scott, T.; Haszard, J.J.; Peddie, M.C. Physical Activity, Sedentary Behaviour and Sleep, and Their Association with BMI
in a Sample of Adolescent Females in New Zealand. Int. J. Environ. Res. Public 2020, 17, 6346. [CrossRef] [PubMed]
25. McIntyre, L.; Dutton, M. Eating and Activity Guidelines for New Zealand Adults; Ministry of Health: Wellington, New Zealand, 2015.You can also read