Agreement of Sedentary Behavior Metrics Derived From Hip- and Thigh-Worn Accelerometers Among Older Adults: With Implications for Studying ...
←
→
Page content transcription
If your browser does not render page correctly, please read the page content below
Journal for the Measurement of Physical Behaviour, 2021, 4, 79-88
https://doi.org/10.1123/jmpb.2020-0036
© 2021 Human Kinetics, Inc.                                                                                                                    ORIGINAL RESEARCH

 Agreement of Sedentary Behavior Metrics Derived From Hip- and
Thigh-Worn Accelerometers Among Older Adults: With Implications
          for Studying Physical and Cognitive Health
          John Bellettiere and                                            Jordan A. Carlson                                   Nicola D. Ridgers
           Fatima Tuz-Zahra                                       Children’s Mercy Hospital and                                 Deakin University
  University of California San Diego                            University of Missouri–Kansas City

                 Sandy Liles                                      Mikael Anne Greenwood-                                  Andrea Z. LaCroix and
  University of California San Diego                             Hickman and Rod L. Walker                                 Marta M. Jankowska
                                                                  Kaiser Permanente Washington                        University of California San Diego
                                                                     Health Research Institute

                                           Dori E. Rosenberg                                                                    Loki Natarajan
                Kaiser Permanente Washington Health Research Institute                                                University of California San Diego

      Little is known about how sedentary behavior (SB) metrics derived from hip- and thigh-worn accelerometers agree for older adults.
      Thigh-worn activPAL (AP) micro monitors were concurrently worn with hip-worn ActiGraph (AG) GT3X+ accelerometers (with
      SB measured using the 100 counts per minute [cpm] cut point; AG100cpm) by 953 older adults (age 77 ± 6.6, 54% women) for
      4–7 days. Device agreement for sedentary time and five SB pattern metrics was assessed using mean error and correlations. Logistic
      regression tested associations with four health outcomes using standardized (i.e., z scores) and unstandardized SB metrics. Mean
      errors (AP − AG100cpm) and 95% limits of agreement were: sedentary time −54.7 [−223.4, 113.9] min/day; time in 30+ min bouts
      77.6 [−74.8, 230.1] min/day; mean bout duration 5.9 [0.5, 11.4] min; usual bout duration 15.2 [0.4, 30] min; breaks in sedentary
      time −35.4 [−63.1, −7.6] breaks/day; and alpha −.5 [−.6, −.4]. Respective Pearson correlations were: .66, .78, .73, .79, .51, and .40.
      Concordance correlations were: .57, .67, .40, .50, .14, and .02. The statistical significance and direction of associations were
      identical for AG100cpm and AP metrics in 46 of 48 tests, though significant differences in the magnitude of odds ratios were observed
      among 13 of 24 tests for unstandardized and five of 24 for standardized SB metrics. Caution is needed when interpreting SB metrics
      and associations with health from AG100cpm due to the tendency for it to overestimate breaks in sedentary time relative to AP.
      However, high correlations between AP and AG100cpm measures and similar standardized associations with health outcomes suggest
      that studies using AG100cpm are useful, though not ideal, for studying SB in older adults.

      Keywords: frailty and physical function, physical activity, sedentary accumulation patterns, sedentary behavior patterns,
      sitting time

      Sedentary behavior is increasing in modern society, and                              waking behaviors while in a seated or lying posture that result in an
among older adults, it is the most prevalent behavior among sleep,                         energy expenditure ≤1.5 metabolic equivalents (Tremblay et al.,
sedentary behavior, and physical activity. (Diaz et al., 2016; Du                          2017). When measured using ActiGraph (AG) accelerometers
et al., 2019; Jefferis et al., 2015; Matthews et al., 2012; Yang et al.,                   worn around the participant’s hip, sedentary time is estimated
2019) By consensus, sedentary behavior has been defined as all                              based on lack of movement and does not factor in posture. To
                                                                                           obtain device-based measures of sedentary behavior derived from
                                                                                           both posture and movement, the most common approach is to
Rosenberg and Natarajan are co-senior authors. Bellettiere, Tuz-Zahra, Liles, LaCroix,     attach an activPAL (AP) monitor—an inclinometer/accelerometer
and Natarajan are with the Herbert Wertheim School of Public Health and Human              specifically designed as a thigh-worn device capable of assessing
Longevity Science, University of California San Diego, La Jolla, CA, USA. Carlson is       posture and thus capturing sitting/lying—to the participant’s thigh
with the Center for Children’s Healthy Lifestyles and Nutrition, Children’s Mercy          (Edwardson et al., 2016). This approach is often viewed as the
Hospital, Kansas City, MO, USA; and the Department of Pediatrics, Children’s Mercy         device-based standard for the measurement of sedentary behavior.
Hospital and University of Missouri, Kansas City, Kansas City, MO, USA. Ridgers is
                                                                                                Accelerometers produce time-stamped data, making it possi-
with the Institute for Physical Activity and Nutrition, School of Exercise and Nutrition
Sciences, Deakin University, Geelong, Victoria, Australia. Greenwood-Hickman,
                                                                                           ble to identify when during the day activity occurs (Glazer et al.,
Walker, and Rosenberg are with the Kaiser Permanente Washington Health Research            2013; Lord et al., 2011), as well as the patterns in which behaviors
Institute, Seattle, WA, USA. Jankowska is with the Qualcomm Institute/Calit2,              are accumulated (Chastin & Granat, 2010). These patterns include
University of California San Diego, La Jolla, CA, USA. Bellettiere (jbellettiere@          the timing, frequency, and duration of sedentary bouts and breaks
ucsd.edu) is corresponding author.                                                         throughout the day (Tremblay et al., 2017). While there has been an
                                                                                                                                                                79
                                                                                                                     Unauthenticated | Downloaded 11/22/21 02:58 AM UTC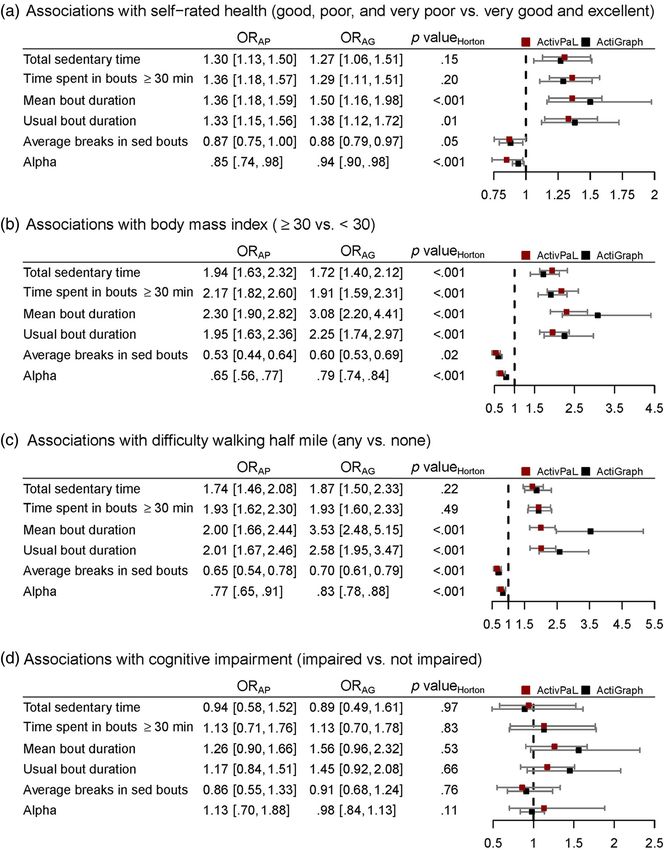
80     Bellettiere et al.

increase in the number of studies examining sedentary patterns and      the Kaiser Permanente Washington Institutional Review Board,
their associations with health (e.g., Brocklebank, Falconer, Page,      and all participants provided written informed consent.
Perry, & Cooper, 2015; Jefferis et al., 2019), the Physical Activity
Guidelines for Americans, 2nd edition (U.S. Department of Health        Accelerometers
and Human Services, 2018), and the update (Katzmarzyk et al.,
2019) both highlighted that further research using prospective          Participants were asked to wear devices for the same 7 days and to
cohorts to study sedentary patterns in relation to mortality and        complete sleep logs each night of wear to document their in-bed
other health outcomes is needed.                                        and out-of-bed times. Sleep-log data were double entered to protect
      One challenge to updating this literature is that most prospec-   against transcription errors. Missing data were imputed using
tive cohort studies use hip-worn AG accelerometers rather than the      person-specific means if available and ACT sample means other-
thigh-worn AP monitor (Lee & Shiroma, 2014), and the measure-           wise. Recorded in-bed and out-of-bed times were used to identify
ment of sedentary bouts and breaks using hip-worn accelerometers        awake time for processing data from both devices.
and standard data processing techniques (Migueles et al., 2017) is           The AG GT3X+ was worn 24 hr/day on an elastic waistband at
not accurate (Barreira, Zderic, Schuna, Hamilton, & Tudor-Locke,        the right hip region with data collected at 30 Hz. Using ActiLife
2015). For example, when compared with direct observation of            (version 6.13.3; ActiGraph LLC, Pensacola, FL), 15-s epoch data
sit-to-stand transitions during usual free-living conditions, one       were generated using the normal filter then aggregated to 1-min
study of 13 adults reported 0.3% bias for thigh-worn AP-measured        epochs. Device nonwear was determined using the Choi algorithm
transitions and 98.6% bias for hip-worn AG-measured transitions         (Choi, Liu, Matthews, & Buchowski, 2011; Choi, Ward, Schnelle,
(Lyden, Kozey Keadle, Staudenmayer, & Freedson, 2012). Despite          & Buchowski, 2012) applied to vector magnitude counts per
the inaccuracy, the authors reported correlation coefficients com-       minute (CPM) using a 90-min window, 30-min streamframe, and
pared with direct observation of .97 for the AP-measured transi-        2-min tolerance. To classify awake-wear-time epochs as sedentary,
tions and .92 for the AG-measured transitions (Lyden et al., 2012).     the most common cut point (100 CPM) was applied to the vertical
There has also been evidence of convergent validity in several          axis (Migueles et al., 2017). Sedentary bouts were then derived as
labs and cohorts around the world that showed AG-derived                consecutive waking sedentary time epochs with no minimum and
measures of sedentary patterns were associated with various             no tolerance.
health outcomes in the expected direction (Bellettiere et al.,               The AP3 micro was placed in a waterproof casing and secured
2019; Brocklebank et al., 2015; Diaz, Goldsmith, et al., 2017;          to the center of the right thigh using Tegaderm adhesive tape
Diaz, Howard, et al., 2017). Given the historical and continuing        (3M, St. Paul, MN). Using the default setting in palBatch (version
use of AG accelerometers in prospective cohorts, understanding          7.2.32; PAL Technologies, Glasgow, Scotland, UK), data were
the agreement between AG- and posture-based measures for                converted to event-level files which were then visually inspected
assessing sedentary behavior, including accumulation patterns,          for anomalies using heat maps that had sleep-log and AG data
is critical for advancing the field.                                     superimposed. Sitting events that occurred while participants were
      The aim of this study was to assess agreement between the         awake (a.k.a., sitting bouts) were used to compute sedentary
most commonly used hip-worn AG measures of volumes and                  behavior metrics.
patterns of sedentary time and thigh-worn AP measures in a
well-characterized cohort of older adults and determine how any
measurement error may bias associations of sedentary behavior           Sedentary Behavior Metrics
with physical or cognitive health.                                      Sedentary behavior metrics were computed using only adherent
                                                                        days on which both devices were worn. Total sedentary time was
                            Methods                                     averaged across all adherent days for each device. Five of the
                                                                        most commonly used sedentary accumulation pattern metrics were
In 1994, adults over 65 without dementia were randomly sampled          evaluated. Time spent in 30+ min bouts was computed as the
from the King County membership of Group Health Cooperative of          average sedentary time per day that was accumulated in bouts that
Puget Sound (now Kaiser Permanente Washington) to join the              were 30 min in duration or greater. Mean bout duration was
Adult Changes in Thought (ACT) study, a longitudinal cohort             computed as the sum of all sedentary bout durations divided by the
study of aging and incident dementia. An expansion cohort was           number of bouts. The usual bout duration (UBD) and alpha were
enrolled starting in 2000. In 2005, a cohort refreshment protocol to    computed using the methods described by Chastin and colleagues
maintain a constant 2000 participants was initiated by enrolling        (Chastin & Granat, 2010; Chastin et al., 2015). UBD is the
new members to replace those who died, were diagnosed with              midpoint of the cumulative distribution of sedentary bout durations,
dementia, or dropped out of the study. Beginning in April 2016,         computed using nonlinear regression. UBD indicates the bout
enrolled participants were given the option to wear an AG GT3X+         duration above which half of all sedentary time is accumulated—
accelerometer (ActiGraph LLC, Pensacola, FL) and/or an AP               higher values indicate a more prolonged accumulation pattern. Alpha
micro (PAL Technologies, Glasgow, Scotland, United Kingdom).            characterizes the shape of the sedentary bout duration distribution
Of the 1688 eligible participants who were able to and asked to         for each person with lower alphas reflecting frequent long bouts
wear devices, 1,151 wore the AG (1,088 returned devices with four       with few short bouts and higher alphas reflecting frequent short
or more adherent days, which for both devices were defined as days       bouts with few long bouts (see Supplementary Figure 1 in our
having 10 or more hours of awake wear), and 1,135 wore the AP           earlier publication for more details [Bellettiere et al., 2017]).
(1,039 returned devices with at least four adherent days). The 953      The number of breaks was computed as the average number of
men and women who wore both devices concurrently for at least           sedentary bouts per day over all adherent days. In this regard,
four adherent days comprised our study population. Details on the       sedentary breaks represented the number of times per day there
ACT cohort and accelerometer deployment are published else-             was a transition from a sedentary bout to movement above the
where (Rosenberg et al., 2020). Ethics approval was obtained from       100 cpm cut point, while sitting breaks represented the number of
                                                          JMPB Vol. 4, No. 1, 2021
                                                                                                  Unauthenticated | Downloaded 11/22/21 02:58 AM UTC
ActivPAL and ActiGraph GT3X Accelerometer Agreement 81
times per day there was a transition from a sitting/lying posture to metrics were compared with the corresponding standardized ORs
standing or stepping. from models using AP metrics, according to the methods described
by Horton and Fitzmaurice (2004). Results from analyses of
Outcomes sedentary behavior and health outcomes were also reported using
unstandardized ORs, which were computed using sedentary behav-
At the ACT study visit when accelerometers were distributed, ior metrics that were not converted to z scores and instead remained
participants’ height and weight were measured by trained staff in their original units of measure.
using a tape measure and the clinic scale. Body mass index (BMI) Following initial peer review, we reran agreement analyses
was computed as the weight (in kilogram) divided by height (in after classifying sedentary behavior using alternate cut points of
meter square). Participants also completed questionnaires. From 200 cpm applied to the vector magnitude and 25 cpm applied to the
the RAND 36 questionnaire (Ware, 2000; Ware & Sherbourn, vertical axis (Aguilar-Farías, Brown, & Peeters, 2014), cut points
1992), self-rated health was assessed with a single item asking “In that were similar to those reported by Koster et al. (2016).
general, would you say your health is: excellent, very good, good, Analyses were conducted using R (R Foundation for Statistical
fair, poor?”; difficulty walking half a mile was assessed with a Computing, Vienna, Austria) with two-tailed statistical tests and
single item asking “Does your health now limit you in walking half statistical significance set to p < .05.
a mile and if so, how much?” Responses were yes, limited a lot;
yes, limited a little; and no, not limited at all. Global cognitive
performance was measured using the Cognitive Abilities Screening Results
Instrument, which consists of a short series of tests that assess nine
domains of cognitive impairment (Chiu, Yip, Woo, & Lin, 2019; The 953 ACT participants included in this study were, on average,
De Oliveira et al., 2016; Teng et al., 1994). Resulting scores range aged 77 ± 7 years, 54.3% female, 87.0% non-Hispanic White, and
from 0 to 100 (best functioning). Cognitive impairment was 72.7% completed college (Table 1).
defined as having a score ≤86 on the Cognitive Abilities Screening Distributions for each sedentary behavior metric separately
Instrument and/or referral for additional diagnostic workup. For for AP and AG100cpm measures are presented in Supplementary
analyses, BMI, self-rated health, difficulty walking a half mile, and
cognitive function—selected for analysis because of known or
expected associations with sedentary behavior—were dichoto- Table 1 Participant Characteristics for Men and
mized as ≥30 versus82 Bellettiere et al.
Table 2 Summary and Agreement Results for Sedentary Time and Patterns of Sedentary Time Measured Using AG
GT3X+ and AP Micro Among ACT Participants; N = 953
Time spent in 30+ Number of
Total sedentary min bouts Mean bout breaks in
Statistic time (min/day) (min/day) duration (min) UBD (min) sedentary time Alpha
AP, mean (SD) 598.4 (116.1) 351.2 (135.5) 14.8 (6.6) 37.9 (17.8) 44.5 (12.8) 1.30 (.04)
AG, mean (SD) 653.2 (95.2) 273.6 (128.0) 8.9 (3.9) 22.7 (12.5) 79.9 (18.1) 1.79 (.13)
Person-level agreement
Mean error (AP – AG) −54.7 77.6 5.9 15.2 −35.4 −.49
95% LoA [−223.4, 113.9] [−74.8, 230.1] [0.5, 11.4] [0.4, 30.0] [−63.1, −7.6] [−.6, −.4]
Mean absolute error 80.1 92.9 6.1 15.7 35.3 .49
Pearson correlation .66 [.62, .70] .78 [.76, .81] .73 [.7, .76] .79 [.77, .82] .51 [.46, .56] .40 [.34, .45]
Concordance correlation .57 [.53, .61] .67 [.64, .70] .40 [.37, .43] .50 [.47, .53] .14 [.12, .15] .02 [.01, .02]
Note. ACT = Adult Changes in Thought; AP = activPAL; AG = ActiGraph; LoA = limits of agreement; UBD = usual bout duration.
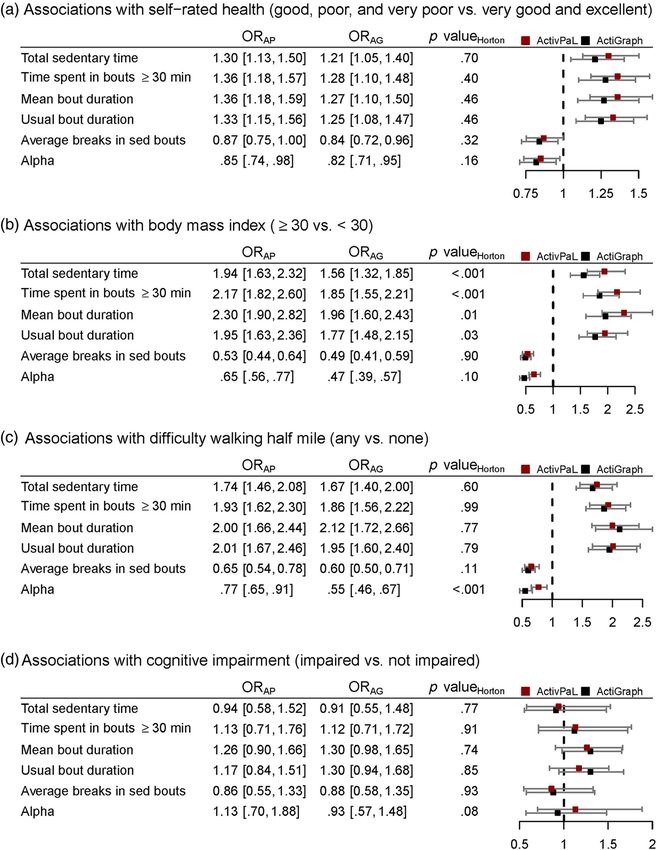
Figure 1 (available online). Mean total sedentary time as measured Figure 1 shows standardized ORs and 95% confidence inter-
by AG100cpm (653 min/day) was 9.1% higher compared with the vals (CIs) for associations between sedentary behavior and health.
AP (598 min/day), resulting in a mean difference of 54.7 min/day Lower self-rated health (i.e., good, poor, or very poor) was
(limit of agreement [LOA] = −223.4, 113.9; Table 2). There were significantly related to all sedentary behavior metrics regardless
nearly twice as many breaks in sedentary time detected by the of the device used, and there were no statistically significant differ-
AG100cpm (mean = 79.9 breaks/day) than the AP (mean = ences between the computed ORs for AG100cpm and AP measures.
44.5 breaks/day; mean difference = 35.4 breaks/day; LOA = [−63.1, While not significantly different for all metrics, point estimates for
−7.6]). The higher number of breaks recorded using AG100cpm ORs were generally stronger when computed using AP measures than
resulted in 77.6 fewer minutes per day (LOA = [−74.8, 230.1]) when using AG100cpm measures of total sedentary time, 30+ min
by AG100cpm than AP in time spent in 30+ min sedentary bouts. bouts, mean bout duration, and UBD; OR point estimates were
The mean difference in mean bout durations was 5.9 min (LOA = slightly larger when computed using AG100cpm measures of alpha
[0.5, 11.4] min), resulting in a 39.9% shorter mean when measured and sedentary breaks. The same general pattern was observed for
by AG100cpm (8.9 min) than by AP (14.8 min). The mean difference associations with BMI, in that differences in ORs between AG and AP
in UBDs was 15.2 min (UBDAG = 22.7 min, UBDAP = 37.9 min), were significant for total sedentary time (p < .001), 30+ min bouts
resulting in a 40.1% shorter mean. The higher frequency of and (p ≤ .001), mean bout duration (p = .01), and usual bout duration
generally shorter duration of bouts detected by AG100cpm resulted in (p = .03). For example, a 1 SD increment in total sedentary time
a more rapid decay of the bout duration distribution and higher alpha measured by AP was associated with 1.94 times higher odds of BMI
values (alphaAG = 1.3, alphaAP = 1.8). Bland–Altman plots illustrat- ≥30 compared with BMIActivPAL and ActiGraph GT3X Accelerometer Agreement 83
Figure 1 — Forest plots for standardized (based on a 1 SD unit change in each metric) associations of AG100cpm and AP sedentary behavior metrics with
self-rated health (a), BMI (b), difficulty walking half mile (c), and cognitive impairment (d). All models are adjusted for age, sex, race/ethnicity, and
education. The p valueHorton is from models testing the hypothesis that ORAG and ORAP are different. AP = activPAL; AG = ActiGraph; BMI = body mass
index; CI = confidence interval; ORAP = odds ratio and 95% CI for associations with AP-measured variables; ORAG = odds ratio and 95% CI for
associations with AG-measured variables.
AG100cpm detected significantly more breaks in sedentary time than the values that might be considered “too sedentary” or “too pro-
did the AP, which resulted in shorter sedentary bouts, on average. longed of a sedentary behavior pattern” will differ depending on the
Estimates of AG100cpm metrics thus reflected more frequently inter- device used. More studies are needed to quantify the between-device
rupted sedentary time accumulation than AP estimates, as shown by differences and their potential impact on future recommendations.
significantly shorter mean bout duration and UBD, and higher alpha. Notably, the approximate 1 hr/day difference in total sedentary time
Studies that rely on AG100cpm estimates of sedentary behavior and time in 30+ min bouts observed in this study highlight that the
patterns (e.g., descriptive epidemiology studies, dose–response between-device differences are large enough that they could have
analyses) should take these between-device differences into account, important public health implications.
recognizing that AG100cpm-derived metrics systematically misesti- On the other hand, even with the between-device differences in
mate sedentary behavior patterns. This will be particularly important estimates of sedentary behavior volume and patterns, we observed
for researchers working to establish sedentary behavior guidelines as moderate to high linear relationships between sedentary behavior
JMPB Vol. 4, No. 1, 2021
Unauthenticated | Downloaded 11/22/21 02:58 AM UTC84 Bellettiere et al.
Figure 2 — Forest plots for unstandardized associations between sedentary behavior measured using AG100cpm and AP and self-rated health (a), BMI
(b), difficulty walking half mile (c), and cognitive impairment (d). AP = activPAL; AG = ActiGraph; BMI = body mass index; CI = confidence interval;
CPM = counts per minute; ORAP = odds ratio and 95% CI for associations with AP-measured variables; ORAG = odds ratio and 95% CI for associations
with AG-measured variables; USD = usual bout duration. All models are adjusted for age, sex, race/ethnicity, and education. The p valueHorton is from
models testing the hypothesis that ORAG and ORAP are different. Odds ratios are unstandardized, meaning that for AP and AG100cpm, they are presented
for the same increments for each sedentary behavior metric: 116 min/day for total sedentary time; 136 min/day for time in 30+ min bouts; 6.6 min for mean
bout duration; 17.8 for USD; 12.8 for breaks in sedentary behavior; and .04 for alpha.
metrics measured by AG100cpm and AP (except for breaks in were most apparent when sedentary behavior metrics were stan-
sedentary time and alpha), which suggest that metrics from either dardized (five associations out of 24 were significantly different)
device similarly ranked participants according to high versus low compared with when they were unstandardized (13 associations out
sedentary time, and according to prolonged versus frequently of 24 were significantly different). Accuracy of the magnitude of
interrupted sedentary behavior patterns. And when the metrics associations are important because they enable more accurate
were first standardized, inferences of associations between seden- computation of population attributable risk (or population attribut-
tary behavior and health outcomes were not appreciably different able fraction), which are needed for efficiently allocating public
for AG100cpm versus AP measures. Associations have three main health- and research-related resources. In addition and importantly,
components: direction, magnitude, and statistical significance. in all but one test, the statistical significance and the direction of
AG100cpm and AP similarities in the magnitude of associations associations were consistent between AG100cpm and AP measures
JMPB Vol. 4, No. 1, 2021
Unauthenticated | Downloaded 11/22/21 02:58 AM UTCActivPAL and ActiGraph GT3X Accelerometer Agreement 85
as illustrated by the 95% confidence intervals. Taken together, Among children, the most common accelerometer data pro-
when interpreting associations using standardized (not unstan- cessing protocol is to classify sedentary time using a 25 counts/15-s
dardized) metrics, the two devices resulted in generally similar cut point. Using that protocol among 195 children aged 10.5
inferences about the relationship of sedentary behavior with physi- (SD = 0.7) years, Carlson et al. (2019) reported that AG25 counts
cal and cognitive health. detected a 307% mean absolute increase in the number of breaks
compared with AP. While they reported that the respective mean
Similar Findings From Other Studies absolute increase was just 25% when using AG100cpm, the interclass
correlation between AG100cpm and AP breaks was just .31. A deep
As far as we know, the only other studies that evaluate agreement of dive into data revealed that despite similar averages (AG100cpm =
AG100cpm and AP measures of sedentary behavior patterns among 89.9/day; AP = 82.8/day), the timing of the breaks was very different
adults focus on the metric “breaks in sedentary time.” Breaks in between the devices, with the AP detecting breaks that went unde-
sedentary time are the main component for measuring how sitting tected by AG100cpm, and AG100cpm detecting breaks that went
and sedentary time are accumulated because they define the undetected by the AP. Deviation in the timing of transitions resulted
beginning and end of each sedentary bout, and sedentary bouts in a 57% and a 59% mean difference in UBD and alpha, respectively,
are the underlying input for all sedentary behavior pattern metrics. and similar mean differences were observed in this study.
In this study, we observed that significantly more breaks were Similar to two smaller studies of agreement in measuring total
counted by AG100cpm compared with AP devices, leading to a high sedentary time, AG100cpm overestimated measures of daily seden-
mean error and low concordance in the number of breaks measured tary time—by 55 min/day in this study compared with 107 min/day
per day, but a modest Pearson correlation coefficient of .51. These among 37 adults aged 74 ± 7 years (Aguilar-Farías et al., 2014) and
first findings among older adults, who accumulate sitting time to 114 min/day among 62 adults aged 78 ± 6 years (Koster et al.,
differently than younger adults (Diaz et al., 2016), corroborate 2016). Like in the two previously mentioned studies, when alternate
results from the previous studies discussed below that were con- cut points were used, agreement with AP in total sedentary time
ducted among adults (Barreira et al., 2015; Lyden et al., 2012) and improved and was underestimated by 45 min/day for AG200cpm and
children (Carlson et al., 2019). 27 min/day AG25cpm.
Lyden et al. (2012) directly observed 13 participants between
20 and 60 years old (mean ± SD age 25 ± 5 years) on two 10-hr
Strengths and Limitations
occasions, one during normal living, and another during a time when
they were asked to reduce their sitting and to breakup sedentary This study has several strengths. Data were collected from a large
time more frequently. The authors found that AP data provided community-based cohort study of older men and women. We
accurate estimates of the number of breaks compared with direct included five different measures of sedentary behavior patterns as
observation. However, AG data, processed using the 100 cpm cut there remains a lack of consensus concerning which metric might be
point, overestimated breaks by more than twofold. Despite the best. In addition, our criterion measure (AP) has been shown to be as
differences in accuracy, the correlation between AG100cpm and good as direct observation for identifying breaks in sedentary behav-
direct observation was .86 during normal living and .64 during the ior, which is requisite for measuring sedentary behavior patterns.
treatment condition. As in all studies, our results should be interpreted within the
Barreira and colleagues compared breaks measured by AP to context of study limitations. Generalizability would be enhanced
those measured by AG among 15 participants aged 28 ± 3 years. by introducing more racial/ethnic diversity and by including more
The number of AG100cpm breaks were, on average, almost two geographic variability. Our AG sedentary behavior metrics were
times (90%) higher than AP breaks (Barreira et al., 2015). Most of derived from data processed with the normal filter within ActiLife,
the additional AG100cpm breaks (52%) occurred when, according to as we do not yet have data processed using the low-frequency
the AP, participants were sitting. This demonstrates one source of extension filter. However, at least one previous study among adults
error when measuring breaks in sedentary time using AG100cpm: showed that agreement between sedentary breaks measured using
long sitting bouts are artificially broken into several shorter bouts AG100cpm and direct observation is nearly the same when data were
when enough movement occurs (e.g., fidgeting or wiggling) that processed using the low-frequency extension filter or the normal
the 100 cpm threshold is breached. Barreira et al. (2015) also frequency filter (Lyden et al., 2012). The Choi algorithm classifies
reported that 40% of the additional AG100cpm breaks occurred periods of 90 min or more with zero movement (and requiring a
while participants were standing. This demonstrates a second 30-min streamframe and 2-min tolerance) as nonwear time. The
source of error when measuring breaks in sedentary time using 90-min duration and streamframe criteria were developed specifi-
AG100cpm. AG100cpm breaks reflect a transition from low levels of cally for older adults and help prevent misclassifying sedentary
movement (i.e., movement below 100 cpm) to relatively more time as nonwear time (Choi et al., 2012). However, it is possible
movement, and does not capture transitions in posture from sitting that differences in sedentary behavior metrics between devices
to standing. Therefore, AG100cpm breaks can occur when a partici- could have been impacted by using this data processing protocol,
pant is standing with low level of movement then transitions to a which is the most commonly used protocol among studies of older
higher level of movement (e.g., walking), or when they are adults (Migueles et al., 2017). To test this, we repeated all analyses
engaging in a high level of movement and then stand sufficiently among the 596 adults who had four or more days without Choi-
still before going back to a high level of movement. As this source identified nonwear time, and the results were not appreciably
of error will occur more often among people who stand more and changed (data not shown). While the AG GT3X+ is no longer
standing has been associated with beneficial health outcomes sold by AG, the cross-generational accuracy with the currently
(Katzmarzyk, 2014; Purva, 2021; Winkler et al., 2018), this might available model (w-GT3X-BT) is exceptionally high (Miller, 2015).
explain why, in this study, we observed marginally stronger Finally, our study used data from the AP, which has very low error
associations with physical health outcomes for standardized in comparison with gold standard direct observation (Lyden et al.,
AG100cpm–measured breaks in sedentary time and alpha. 2012), but is not without error.
JMPB Vol. 4, No. 1, 2021
Unauthenticated | Downloaded 11/22/21 02:58 AM UTC86 Bellettiere et al.
Conclusion (ID101895). The funders had no role in the design, conduct, analysis,
and decision to publish results from this study.
This study showed that using AG100cpm led to an overestimation of
breaks in sedentary time and systematically more interrupted
sedentary behavior patterns than were observed using AP mea- References
sures. For example, mean bout duration as measured by AP was
66% longer, on average, than duration as measured by AG100cpm Aguilar-Farías, N., Brown, W.J., & Peeters, G.M.E.E.G. (2014). Acti-
and breaks in sedentary time measured by AG100cpm was nearly Graph GT3X+ cut-points for identifying sedentary behaviour in older
twice as large. As a result, caution should be used when inter- adults in free-living environments. Journal of Science and Medicine
preting estimates of sedentary behavior patterns from AG100cpm in Sport, 17(3), 293–299. PubMed ID: 23932934 doi:10.1016/j.
and any associations that rely on those pattern metric estimates. jsams.2013.07.002
When our metrics were first standardized based on their underlying Barreira, T.V., Zderic, T.W., Schuna, J.M., Hamilton, M.T., & Tudor-
distribution—we used the SD, but an interquartile range or com- Locke, C. (2015). Free-Living activity counts-derived breaks in
paring quartiles of the exposure are also distribution-based meth- sedentary time: Are they real transitions from sitting to standing?
ods that would work—associations with physical and cognitive Gait & Posture, 42(1), 70–72. PubMed ID: 25953504 doi:10.1016/j.
health using AG100cpm and AP were similar when the associations gaitpost.2015.04.008
were interpreted using the distribution-based unit of analysis but Bellettiere, J., LaMonte, M.J., Evenson, K.R., Rillamas-Sun, E., Kerr, J.,
not when the distribution-based units were converted back to the Lee, I.-M., : : : LaCroix, A.Z. (2019). Sedentary behavior and
absolute unit of analysis. For example, we strongly recommend cardiovascular disease in older women: The OPACH study. Circula-
reporting results for a 1 SD increment in mean bout duration tion, 139(8), 1036–1046. PubMed ID: 31031411 doi:10.1161/
instead of an x-minute increment in mean bout duration, where x is CIRCULATIONAHA.118.035312
the SD of the mean bout duration. Whenever estimates of associa- Bellettiere, J., Winkler, E.A.H., Chastin, S.F.M., Kerr, J., Owen, N.,
tions are presented using absolute units of sedentary behavior Dunstan, D.W., & Healy, G.N. (2017). Associations of sitting
pattern measures (e.g., minute, minute/day, n/day), the magnitude accumulation patterns with cardio-metabolic risk biomarkers in
of the association will differ according to which device is used Australian adults. PLoS One, 12(6), e0180119. PubMed ID:
in determining those pattern measures. Consequently, if physical 28662164 doi:10.1371/journal.pone.0180119
activity guidelines were developed using research conducted only Bland, J.M., & Altman, D.G. (2007). Agreement between methods of
by AG100cpm, the guidelines could be meaningfully different measurement with multiple observations per individual. Journal
than if the same research were conducted using only AP. Future of Biopharmaceutical Statistics, 17(4), 571–582. PubMed ID:
development of sedentary behavior guidelines will rely on accel- 17613642 doi:10.1080/10543400701329422
erometer data from longitudinal studies. As many studies have Brocklebank, L.A., Falconer, C.L., Page, A.S., Perry, R., & Cooper, A.R.
already collected hip-worn AG data and many new studies will (2015). Accelerometer-Measured sedentary time and cardiometabolic
likely continue to employ the AG, research is needed to develop biomarkers: A systematic review. Preventive Medicine, 76, 92–102.
accelerometer data processing techniques (Kerr et al., 2018; PubMed ID: 25913420 doi:10.1016/j.ypmed.2015.04.013
Nakandala et al., 2021) or measurement error correction models Carlson, J.A., Bellettiere, J., Kerr, J., Salmon, J., Timperio, A., Verswij-
(Sampson, Matthews, Freedman, Carroll, & Kipnis, 2016) to veren, S.J.J.M., & Ridgers, N.D. (2019). Day-level sedentary pattern
increase the accuracy of sedentary behavior pattern metrics estimates derived from hip-worn accelerometer cut-points in 8–12-
derived from hip-worn devices. Until then, for studies assessing year-olds: Do they reflect postural transitions? Journal of Sports
associations of sedentary behavior volumes and patterns with Sciences, 37(16), 1899–1909. PubMed ID: 31002287 doi:10.1080/
health using AG100cpm, we recommend presenting results for 02640414.2019.1605646
standardized and unstandardized point estimates in AG100cpm- Chastin, S.F.M., & Granat, M.H. (2010). Methods for objective measure,
based studies and interpreting associations using units of the quantification and analysis of sedentary behaviour and inactivity.
standardized metric rather than absolute units of sedentary behav- Gait and Posture, 31(1), 82–86. PubMed ID: 19854651 doi:10.1016/
ior measures (e.g., minute, minute/day, n/day). This will increase j.gaitpost.2009.09.002
accuracy of the relative magnitude of associations between sed- Chastin, S.F.M., Winkler, E.A.H., Eakin, E.G., Gardiner, P.A., Dunstan,
entary behavior and health and might help harmonize results from D.W., Owen, N., & Healy, G.N. (2015). Sensitivity to change of
prospective cohort studies that use different activity monitors. objectively-derived measures of sedentary behavior. Measurement in
Ultimately, such an approach will help to answer the 2018 Physical Physical Education and Exercise Science, 19(3), 138–147. doi:10.
Activity Guidelines Advisory Committee’s call to provide more 1080/1091367X.2015.1050592
data about associations of sedentary behavior patterns, including Chiu, E.C., Yip, P.K., Woo, P., & Lin, Y.Te. (2019). Test-retest reliability
bouts and breaks, with health outcomes (U.S. Department of and minimal detectable change of the Cognitive Abilities Screening
Health and Human Services, 2018). Instrument in patients with dementia. PLoS One, 14(5), e0216450.
PubMed ID: 31063491 doi:10.1371/journal.pone.0216450
Choi, L., Liu, Z., Matthews, C.E., & Buchowski, M.S. (2011). Validation
Acknowledgments
of accelerometer wear and nonwear time classification algorithm.
The authors have immense gratitude for the volunteers who took part in the Medicine & Science in Sports & Exercise, 43(2), 357–364. PubMed
Adult Changes in Thought (ACT) Study. This work was funded by the ID: 20581716 doi:10.1249/MSS.0b013e3181ed61a3
National Institute on Aging (U01 AG006781; DR and P01 AG052352; Choi, L., Ward, S.C., Schnelle, J.F., & Buchowski, M.S. (2012). Assessment
AZL) and the National Institute of Diabetes and Digestive and Kidney of wear/nonwear time classification algorithms for triaxial accelerome-
Diseases (R01 DK114945; LN). N.D. Ridgers is supported by a Future ter. Medicine & Science in Sports & Exercise, 44(10), 2009–2016.
Leader Fellowship from the National Heart Foundation of Australia PubMed ID: 22525772 doi:10.1249/MSS.0b013e318258cb36
JMPB Vol. 4, No. 1, 2021
Unauthenticated | Downloaded 11/22/21 02:58 AM UTCActivPAL and ActiGraph GT3X Accelerometer Agreement 87
De Oliveira, G.M., Yokomizo, J.E., E Silva, L.D.S.V., Saran, L.F., of Sitting Using Machine Learning Methods Medicine & Science
Bottino, C.M.C., & Yassuda, M.S. (2016). The applicability of the in Sports & Exercise, 50(7), 1518–1524. doi:10.1249/MSS.000000
cognitive abilities screening instrument-short (CASI-S) in primary 0000001578
care in Brazil. International Psychogeriatrics, 28(1), 93–99. PubMed Koster, A., Shiroma, E., Caserotti, P., Mathews, C., Chen, K., Glynn, N., &
ID: 25921381 doi:10.1017/S1041610215000642 Harris, T. (2016). Comparison of sedentary estimates between ac-
Diaz, K.M., Goldsmith, J., Greenlee, H., Strizich, G., Qi, Q., Mossavar- tivPAL and hip- and wrist-worn actiGraph. Medicine & Science in
Rahmani, Y., : : : Kaplan, R. (2017). Prolonged, uninterrupted Sports & Exercise, 48(8), 1514–1522. PubMed ID: 27031744 doi:10.
sedentary behavior and glycemic biomarkers among US Hispanic/ 1249/MSS.0000000000000924
Latino adults: The Hispanic Community Health Study/Study of Lee, I.-M., & Shiroma, E.J. (2014). Using accelerometers to measure
Latinos (HCHS/SOL). Circulation, 136(15), 1362–1373. PubMed physical activity in large-scale epidemiological studies: Issues and
ID: 28835368 doi:10.1161/CIRCULATIONAHA.116.026858 challenges. British Journal of Sports Medicine, 48(3), 197–201.
Diaz, K.M., Howard, V.J., Hutto, B., Colabianchi, N., Vena, J.E., Blair, PubMed ID: 24297837 doi:10.1136/bjsports-2013-093154
S.N., & Hooker, S.P. (2016). Patterns of sedentary behavior in US Lord, S., Chastin, S.F.M., McInnes, L., Little, L., Briggs, P., & Rochester,
middle-age and older adults: The REGARDS study. Medicine & L. (2011). Exploring patterns of daily physical activity and seden-
Science in Sports & Exercise, 48(3), 430–438. PubMed ID: 26460633 tary behaviour in community-dwelling older adults. Age and Age-
doi:10.1249/MSS.0000000000000792 ing, 40(2), 205–210. PubMed ID: 21239410 doi:10.1093/ageing/
Diaz, K.M., Howard, V.J., Hutto, B., Colabianchi, N., Vena, J.E., Safford, afq166
M.M., : : : Hooker, S.P. (2017). Patterns of sedentary behavior and Lyden, K., Kozey Keadle, S.L., Staudenmayer, J.W., & Freedson, P.S.
mortality in U.S. middle-aged and older adults a national cohort (2012). Validity of two wearable monitors to estimate breaks from
study. Annals of Internal Medicine, 167(7), 465–475. PubMed ID: sedentary time. Medicine & Science in Sports & Exercise, 44(11),
28892811 doi:10.7326/M17-0212 2243–2252. PubMed ID: 22648343 doi:10.1249/MSS.0b013e3
Du, Y., Liu, B., Sun, Y., Snetselaar, L.G., Wallace, R.B., & Bao, W. 18260c477
(2019). Trends in adherence to the physical activity guidelines for Matthews, C.E., George, S.M., Moore, S.C., Bowles, H.R., Blair, A., Park,
Americans for aerobic activity and time spent on sedentary behavior Y., : : : Schatzkin, A. (2012). Amount of time spent in sedentary
among US adults, 2007 to 2016. JAMA Network Open, 2(7), e197597. behaviors and cause-specific mortality in US adults. American Jour-
PubMed ID: 31348504 doi:10.1001/jamanetworkopen.2019.7597 nal of Clinical Nutrition, 95(2), 437–445. PubMed ID: 22218159
Edwardson, C.L., Winkler, E.A.H., Bodicoat, D.H., Yates, T., Davies, doi:10.3945/ajcn.111.019620
M.J., Dunstan, D.W., & Healy, G.N. (2016). Considerations when Migueles, J.H., Cadenas-Sanchez, C., Ekelund, U., Nyström, C.D., Mora-
using the activPAL monitor in field based research with adult Gonzalez, J., Löf, M., : : : Ortega, F.B. (2017). Accelerometer data
populations. Journal of Sport and Health Science, 6(2), 162–178. collection and processing criteria to assess physical activity and other
PubMed ID: 30356601 doi:10.1016/j.jshs.2016.02.002 outcomes: A systematic review and practical considerations. Sports
Glazer, N.L., Lyass, A., Esliger, D.W., Blease, S.J., Freedson, P.S., Medicine, 47(9), 1821–1845. PubMed ID: 28303543 doi:10.1007/
Massaro, J.M., : : : Vasan, R.S. (2013). Sustained and shorter bouts s40279-017-0716-0
of physical activity are related to cardiovascular health. Medicine & Miller, J. (2015). ActiGraph cross-generation accuracy confirmation.
Science in Sports & Exercise, 45(1), 109–115. PubMed ID: 22895372 Retrieved from https://s3.amazonaws.com/actigraphcorp.com/wp-
doi:10.1249/MSS.0b013e31826beae5 content/uploads/2018/03/11163743/cross-generation-accuracy.pdf
Horton, N.J., & Fitzmaurice, G.M. (2004). Regression analysis of multiple Nakandala, S., Jankowska, M., Tuz-Zahra, F., Bellettiere, J., Carlson, J.A.,
source and multiple informant data from complex survey samples. : : : Natarajan , L. (2021). Application of convolutional neural
Statistics in Medicine, 23(18), 2911–2933. PubMed ID: 15344194 network algorithms for advancing sedentary and activity bout classi-
doi:10.1002/sim.1879 fication. Journal for the Measurement of Physical Behaviour.
Jefferis, B.J., Parsons, T.J., Sartini, C., Ash, S., Lennon, L.T., Papacosta, Advance online publication. doi:10.1123/JMPB.2020-0016
O., : : : Whincup, P.H. (2019). Objectively measured physical activ- Purva, J., John, B., Nicole, G., Michael, J.L., Chongzhi, D., Robert, A.W.,
ity, sedentary behaviour and all-cause mortality in older men: Does : : : Andrea, Z.L. (2021). v. The Journals of Gerontology Series A,
volume of activity matter more than pattern of accumulation? British Biological Sciences and Medical Sciences, 76(1), 77–84. doi:10.
Journal of Sports Medicine, 53(16), 1013–1020. PubMed ID: 1093/gerona/glaa227
29440040 doi:10.1136/bjsports-2017-098733 Rosenberg, D., Walker, R., Greenwood-Hickman, M.A., Bellettiere, J.,
Jefferis, B.J., Sartini, C., Shiroma, E., Whincup, P.H., Wannamethee, S.G., Xiang, Y., Richmire, K., : : : Lacroix, A.Z. (2020). Device-assessed
& Lee, I.M. (2015). Duration and breaks in sedentary behaviour: physical activity and sedentary behavior in a community-based cohort
Accelerometer data from 1566 community-dwelling older men (Brit- of older adults. BMC Public Health, 20(1), 1256. PubMed ID:
ish Regional Heart Study). British Journal of Sports Medicine, 32811454 doi:10.1186/s12889-020-09330-z
49(24), 1591–1594. PubMed ID: 25232029 doi:10.1136/bjsports- Sampson, J.N., Matthews, C.E., Freedman, L.S., Carroll, R.J., & Kipnis,
2014-093514 V. (2016). Methods to assess measurement error in questionnaires of
Katzmarzyk, P.T. (2014). Standing and mortality in a prospective cohort of sedentary behavior. Journal of Applied Statistics, 43(9), 1706–1721.
Canadian adults. Medicine & Science in Sports & Exercise, 46(5), 940– doi:10.1080/02664763.2015.1117593
946. PubMed ID: 24152707 doi:10.1249/MSS.0000000000000198 Teng, E.L., Hasegawa, K., Homma, A., Imai, Y., Larson, E., Graves, A.,
Katzmarzyk, P.T., Powell, K.E., Jakicic, J.M., Troiano, R.P., Piercy, K., & : : : White, L.R. (1994). The Cognitive Abilities Screening Instru-
Tennant, B. (2019). Sedentary behavior and health: Update from the ment (CASI): A practical test for cross-cultural epidemiological
2018 physical activity guidelines advisory committee. Medicine & studies of dementia. International Psychogeriatrics, 6(1), 45–58.
Science in Sports & Exercise, 51(6), 1227–1241. PubMed ID: PubMed ID: 8054493 doi:10.1017/S1041610294001602
31095080 doi:10.1249/MSS.0000000000001935 Tremblay, M.S., Aubert, S., Barnes, J.D., Saunders, T.J., Carson, V.,
Kerr, J., Carlson, J., Godbole, S., Cadmus-Bertram, L., Bellettiere, J., & Latimer-Cheung, A.E., : : : Participants, on behalf of S. T. C. P.
Hartman, S. (2018). Improving Hip-Worn Accelerometer Estimates (2017). Sedentary Behavior Research Network (SBRN)—
JMPB Vol. 4, No. 1, 2021
Unauthenticated | Downloaded 11/22/21 02:58 AM UTC88 Bellettiere et al.
Terminology Consensus Project process and outcome. International Ware, J.E. (2000). SF-36 health survey update. Spine, 25(24), 3130–3139.
Journal of Behavioral Nutrition and Physical Activity, 14(1), 75. PubMed ID: 11124729 doi:10.1097/00007632-200012150-00008
PubMed ID: 28599680 doi:10.1186/s12966-017-0525-8 Winkler, E.A.H., Chastin, S., Eakin, E.G., Owen, N., Lamontagne, A.D.,
U.S. Department of Health and Human Services. (2018). Physical activity Moodie, M., : : : Healy, G.N. (2018). Cardiometabolic impact of
guidelines for Americans (2nd ed.). Retrieved from U.S. Department changing sitting, standing, and stepping in the workplace. Medicine &
of Health and Human Services website: https://health.gov/paguide Science in Sports & Exercise, 50(3), 516–524. PubMed ID: 29166319
lines/second-edition/report/ doi:10.1249/MSS.0000000000001453
Ware, C.J.E., & Sherbourn, D. (1992). The MOS 36-item short-form Yang, L., Cao, C., Kantor, E.D., Nguyen, L.H., Zheng, X., Park, Y., : : :
health survey (SF-36): I. Conceptual framework and item selection. Cao, Y. (2019). Trends in sedentary behavior among the US popula-
Medical Care, 30(6), 473–483. PubMed ID: 1593914 doi:10.1097/ tion, 2001–2016. JAMA, 321(16), 1587. PubMed ID: 31012934
00005650-199206000-00002 doi:10.1001/jama.2019.3636
JMPB Vol. 4, No. 1, 2021
Unauthenticated | Downloaded 11/22/21 02:58 AM UTCYou can also read