Physiological Responses During High-Intensity Interval Training in Young Swimmers
←
→
Page content transcription
If your browser does not render page correctly, please read the page content below
ORIGINAL RESEARCH
                                                                                                                                                    published: 01 July 2021
                                                                                                                                          doi: 10.3389/fphys.2021.662029

                                                Physiological Responses During
                                                High-Intensity Interval Training in
                                                Young Swimmers
                                                Tiago André Freire Almeida 1,2,3, Dalton Müller Pessôa Filho 3,4*, Mário Cunha Espada 5,6,
                                                Joana Filipa Reis 1,2, Andrei Sancassani 4, Danilo Alexandre Massini 4,
                                                Fernando Jorge Santos 2,5,6 and Francisco Besone Alves 1,2
                                                1
                                                 Interdisciplinary Center for the Study of Human Performance (CIPER), Faculdade de Motricidade Humana, Universidade de
                                                Lisboa, Lisbon, Portugal, 2 Faculdade de Motricidade Humana, Universidade de Lisboa, Lisbon, Portugal, 3 Department of
                                                Physical Education, São Paulo State University (UNESP), Bauru, Brazil, 4 Institute of Bioscience, Graduate Program in Human
                                                Development and Technology, São Paulo State University (UNESP), Rio Claro, Brazil, 5 Department of Science and
                                                Technology, Polytechnic Institute of Setúbal, Setúbal, Portugal, 6 Quality of Life Research Center, Santarém, Portugal

                                                This study analyzed whether 100- and 200-m interval training (IT) in swimming differed
                                                regarding temporal, perceptual, and physiological responses. The IT was performed at
                           Edited by:
                                                maximal aerobic velocity (MAV) until exhaustion and time spent near to maximalVO2 peak
                      François Billaut,
              Laval University, Canada          oxygen uptake (⩒O2peak), total time limit (tLim), peak blood lactate [La−] peak, ⩒O2 kinetics
                        Reviewed by:            (⩒O2K), and rate of perceived exertion (RPE) were compared between protocols. Twelve
                  Argyris G. Toubekis,          swimmers (seven males 16.1 ± 1.1 and five females 14.2 ± 1 years) completed a
 National and Kapodistrian University
                    of Athens, Greece           discontinuous incremental step test for the second ventilatory threshold (VT2), ⩒O2peak,
                    Hugo A. Kerhervé,           and MAV assessment. The swimmers subsequently completed two IT protocols at MAV
      University of Rennes 2 – Upper
                                                with 100- and 200-m bouts to determine the maximal ⩒O2 (peak-⩒O2) and time spent
                       Brittany, France
                                                ≥VT2, 90, and 95% of ⩒O2peak for the entire protocols (IT100 and IT200) and during the first
                 *Correspondence:
           Dalton Müller Pessôa Filho           800-m of each protocol (IT8x100 and IT4x200). A portable apparatus (K4b2) sampled gas
        dalton.pessoa-filho@unesp.br            exchange through a snorkel and an underwater led signal controlled the velocity. RPE
                                                was also recorded. The Peak-⩒O2 attained during IT8x100 and IT4x200 (57.3 ± 4.9 vs.
                   Specialty section:
         This article was submitted to          57.2 ± 4.6 ml·kg−1·min−1) were not different between protocols (p = 0.98) nor to ⩒O2peak
                   Exercise Physiology,         (59.2 ± 4.2 ml·kg−1·min−1, p = 0.37). The time constant of ⩒O2K (24.9 ± 8.4 vs. 25.1 ± 6.3-s,
               a section of the journal
               Frontiers in Physiology          p = 0.67) and [La−] peak (7.9 ± 3.4 and 8.7 ± 1.5 mmol·L−1, p = 0.15) also did not differ
         Received: 31 January 2021              between IT100 and IT200. The time spent ≥VT2, 90, and 95%⩒O2peak were also not different
           Accepted: 07 June 2021               between IT8x100 and IT4x200 (p = 0.93, 0.63, and 1.00, respectively). The RPE for IT8x100 was
           Published: 01 July 2021
                                                lower than that for IT4x200 (7.62 ± 2 vs. 9.5 ± 0.7, p = 0.01). Both protocols are considered
                              Citation:
                                                suitable for aerobic power enhancement, since ⩒O2peak was attained with similar ⩒O2K
       Almeida TAF, Pessôa Filho DM,
  Espada MC, Reis JF, Sancassani A,             and sustained with no differences in tLim. However, the fact that only the RPE differed
            Massini DA, Santos FJ and           between the IT protocols suggested that coaches should consider that nx100-m/15-s is
         Alves FB (2021) Physiological
     Responses During High-Intensity            perceived as less difficult to perform compared with nx200-m/30-s for the first 800-m
 Interval Training in Young Swimmers.           when managing the best strategy to be implemented for aerobic power training.
            Front. Physiol. 12:662029.
     doi: 10.3389/fphys.2021.662029             Keywords: interval training, oxygen uptake kinetics, work-interval, performance, swimming

Frontiers in Physiology | www.frontiersin.org                                          1                                              July 2021 | Volume 12 | Article 662029
Almeida et al.                                                                                              High-Intensity Interval Training in Swimming

INTRODUCTION                                                               endurance in high swimming intensity (Dalamitros et al., 2016;
                                                                           Sousa et al., 2017).
Interval training (IT) has been considered an effective exercise              However, there are still doubts on how to define the IT to
plan to improve endurance performance and maximal aerobic                  provide the best combination of aerobic and anaerobic responses
velocity (MAV, i.e., the velocity corresponding to the peak                in swimming, especially considering the requirements for
oxygen uptake, ⩒O2peak; Billat and Koralsztein, 1996; Billat               successful performance in middle-distance events, as proposed
et al., 2000; Dalamitros et al., 2016), and, therefore, has been           for running and cycling (Billat, 2001; Spencer and Gastin,
proposed as a successful way to enhance cardiovascular and                 2001; Buchheit and Laursen, 2013b). In swimming, performing
muscle adjustments needed to optimize performance during                   IT at MAV with 1:1 or 1:1/2 ratios for work:rest elicits only
middle-distance racing in different sports, e.g., running and              moderate blood lactate accumulation, clearly lower values than
swimming (Billat, 2001; Libicz et al., 2005; Reis et al., 2012a,b;         those reported for running and cycling (Billat et al., 2000;
Espada et al., 2015, 2021). The time sustained with ⩒O2 responses          Zuniga et al., 2011), which is probably attributed to the clearance
closer to the maximal rates (90–100% of ⩒O2peak) is considered             mechanism during long rest periods (Bentley et al., 2005; Libicz
an important factor to maximize aerobic training benefits                  et al., 2005). Therefore, we could expect that longer work
(⩒O2peak, O2 transport, and mitochondrial density) and avoid               intervals or decreases in the rest periods would lead to higher
high oxygen deficits and fast metabolite accumulation, which               anaerobic glycolic energy release (Buchheit and Laursen, 2013b).
can contribute to an increase in endurance capacity and tolerance          However, this has not been studied in swimming.
at severe and maximal intensities (Billat and Koralsztein, 1996;              ⩒O2 kinetics (⩒O2K) has been associated with endurance
Millet et al., 2003a,b; Bentley et al., 2005; Sousa et al., 2017).         performance (Jones and Burnley, 2009; Reis et al., 2012b; Espada
   The IT planning requires the organization of several parameters,        et al., 2015; Almeida et al., 2020) and time spent at ⩒O2max
such as work intensity, distance and duration, rest mode (active           (Millet et al., 2003a,b; Sousa et al., 2018), since faster kinetics
or passive) and duration, number of bouts to be performed                  can represent an accelerated oxidative rate. It has been reported
(n repetitions), number of sets, and the duration of recovery              that athletes with faster ⩒O2K can reach ⩒O2peak faster and
between sets (Buchheit and Laursen, 2013a,b). When IT is                   present lower oxygen deficits (Millet et al., 2003b). However,
planned to increase the time limit at MAV or/and to ensure                 Bentley et al. (2005) did not find any influence of faster kinetics
an increase in time exercising closer to ⩒O2peak response,                 with the time spent near ⩒O2 maximal values on swimmers when
workouts have been designed with repeated bouts lasting 2–4 min,           performing IT with 400-m bouts. Furthermore, Sousa et al. (2015)
which is characterized as long-term work intervals (Buchheit               reported that swimmers seem to have slower ⩒O2K than runners
and Laursen, 2013b; Wen et al., 2019). However, performing                 and cyclists, which can indicate that IT in swimming could require
short-duration work intervals (3 mmol·L−1) and oxygen deficit (>~5 ml·kg−1) when using                     We hypothesize that both ITs will elicit the achievement
the latter (Billat, 2001; Zuniga et al., 2011; Buchheit and Laursen,       of ⩒O2peak; however, IT100 will present longer times to exhaustion
2013b). In swimming, short-distance work intervals (n × 100-m)             and consequently longer times spent near swimmers ⩒O2
performed at submaximal or maximal velocities (≤95 or 100%                 maximal values, and swimmers with faster ⩒O2K will also
MAV) have been shown to induce higher (absolute) time limit                present longer times to exhaustion and times spent near ⩒O2peak.
and time spent at submaximal or maximal ⩒O2 (>90 or 100%
⩒O2peak) than a single trial performed at same velocities
(Bentley et al., 2005; Libicz et al., 2005; Sousa et al., 2017).           MATERIALS AND METHODS
Although the literature is not extensive, the temporal and ⩒O2
responses during IT in swimming, seems to point out that                   Experimental Design
using 60–120-s work intervals at velocities ≥95% of MAV is                 To analyze the physiological and temporal responses during
recommended to stimulate improvements in aerobic power and                 two different intermittent swimming (IT) protocols, the peak

Frontiers in Physiology | www.frontiersin.org                          2                                        July 2021 | Volume 12 | Article 662029
Almeida et al.                                                                                                         High-Intensity Interval Training in Swimming

oxygen uptake (⩒O2peak), second ventilatory threshold (VT₂),                          maximal performance, which was performed 48 h before the
and MAV were assessed by a discontinuous incremental step                             execution of the incremental step test and ensured the similar
test performed until a maximal 200-m pace or to volitional                            swimming mode (in water starting, open turns and no underwater
exhaustion. In a randomized order, the swimmers performed                             gliding). The following steps were incremented at 55, 60, 70,
two different IT protocols until exhaustion at MAV, consisting                        80, 90, and 100% rates of v200-m, aiming to ensure a narrow
of 100 or 200-m repetitions, to compare the ventilatory and                           rest-to-work transition for the three initial steps and therefore
physiological responses between the two IT formats. All the                           enabling ideal warming with no metabolism compromise
swimmers performed the three testing protocols in front crawl                         (premature acidosis and glycogen depletion) for the remaining
swimming with in-water starts and open turns without                                  steps (Espada et al., 2015; Almeida et al., 2020).
underwater gliding (in a 25-m swimming pool), with gas                                   In a randomized order, the swimmers performed two different
exchange analysis recorded by a portable gas analyzer (K4b2,                          IT swimming protocols at MAV 48 h after the incremental
Cosmed®, Rome, Italy) connected to the swimmers by a respiratory                      test and 48 h apart from each other. The IT was performed
snorkel and a valve system (new-AquaTrainer®, Cosmed, Rome,                           until voluntary exhaustion, following the protocols: (1) n
Italy). The transportation of this system along the swimming pool                     repetitions of 100-m interspersed by 15-s of rest (IT100), and
can be watching in the Supplementary Material.                                        (2) n repetitions of 200-m interspersed by 30-s of rest (IT200).
    The participants were instructed to report to the swimming                        The comparison between each IT protocol considered the first
pool well hydrated, fed, and to abstain from caffeine, alcohol,                       800 m (IT8x100 and IT4x200, respectively for the IT100 and IT200),
and strenuous exercise in the 24 h preceding the testing protocols.                   as well as the entire IT100 and IT200 protocols, analyzing temporal,
The same environmental conditions (time of day ± 2 h, water                           perceptual, and physiological responses.
temperature ~28°C, and relative humidity ~50%) and same                                  For the control of swimming velocity during each step of
pre-test warm up protocol were ensured for all tests in order                         the incremental test and during each n repetition of IT100 and
to minimize the effects of circadian rhythms and differences in                       IT200, an underwater visual pacer was employed, which was
prior exercise. The sessions were performed in the beginning                          designed with 26 led lights that subsequently signaled the
of the preparatory period of the second macrocycle of competitive                     pacing (Pacer2Swim®, KulzerTEC, Santa Maria da Feira,
season of the swimmers, after a period of 2 weeks for training                        Portugal), and was used to provide the swimmers an accurate
adaptation and were separated by at least 48 h.                                       notion of the correct velocity for each test. Figure 1 depicts
                                                                                      an overall view of the IT protocols.
Participants
Twelve well-trained young swimmers (seven males and five                              Measurements and ⩒O2 Kinetics
females) were informed about the procedures and experimental                          For the gas exchange analysis, a telemetric portable gas analyzer
risks of the study and signed a written informed consent (and                         (K4b2, Cosmed®, Rome, Italy) was connected to the swimmers
their legal guardians when under 18 years old). All the swimmers                      by a respiratory snorkel and a valve system (new-AquaTrainer®,
were fully familiarized with the equipment and procedures                             Cosmed, Rome, Italy), allowing breath-by-breath pulmonary
before the beginning of the tests. The recruited swimmers had                         gas collection (Reis et al., 2010; Baldari et al., 2013). The
to be regularly competing in state or national championships                          system was moved alongside the swimmers by a member of
for a minimum of 3 years prior to the beginning of the study,                         the research team. Before the start (10 min of resting), during,
as a criterion to participate in this study. This study was                           and after each protocol (at 1, 3, 5, and 7-min in the recovery
approved by the local University Ethical Committee (CEFMH:                            phase) capillary blood samples (25 μl) were collected from
39/2015) and was conducted in accordance with the 1964                                the earlobe (carefully dried before each sampling) for blood
Declaration of Helsinki (Harriss et al., 2017). The descriptive                       lactate [La−] analysis (YSI, 2300 STAT®, Yellow Springs, Ohio).
characteristics of the swimmers are presented in Table 1.                             Exceptionally during the IT protocols, the blood samples were
                                                                                      collected before (at rest) and after (at recovery) only. The peak
                                                                                      of [La−] concentration ([La−]peak) was measured in the recovery
Incremental Step Test and Interval Training                                           phase after the incremental step test and each IT protocol.
Protocol                                                                              The RPE was recorded through the CR-10 scale of Borg (1990).
The discontinuous incremental step test was structured with                               During the incremental step test, the ⩒O2peak was measured
6 × 250 and 1 × 200-m steps performed with 30-s rest for                              as the highest 30-s (moving) averaged ⩒O2 in each step, and
blood lactate sampling (Espada et al., 2015; Almeida et al., 2020).                   MAV was considered as the velocity corresponding to the
The velocity started at 50% of the velocity at 200-m (v200-m)                         step where ⩒O2peak occurred (Billat and Koralsztein, 1996).
                                                                                      VT₂ was determined by gas analysis in the incremental test
                                                                                      according to the recommendations of Filho et al. (2012), and
TABLE 1 | Anthropometric (mean ± SD) characteristics of the participants.             was examined visually using the responses from the V̇E/V̇CO2,
                                                                                      V̇E/⩒O2, PETCO2, and PETO2 parameters. The criterion was the
Variables                  Male (N = 7)         Female (N = 5)   Group (N = 12)       continuous increase in V̇E/⩒O2 and V̇E/V̇CO2 ratio curves
Age (yrs)                   16.1 ± 1.1            14.2 ± 1.0       15.3 ± 1.4
                                                                                      related to the reduction in PETCO2. The point of VT2 localization
Height (m)                  1.76 ± 0.1            1.58 ± 0.1       1.69 ± 0.1         was observed by two independent experts. Swimming velocity
Total body mass (kg)        64.8 ± 7.8            50.6 ± 5.1       58.9 ± 9.8         at VT2 corresponded to the incremental testing step at which

Frontiers in Physiology | www.frontiersin.org                                     3                                        July 2021 | Volume 12 | Article 662029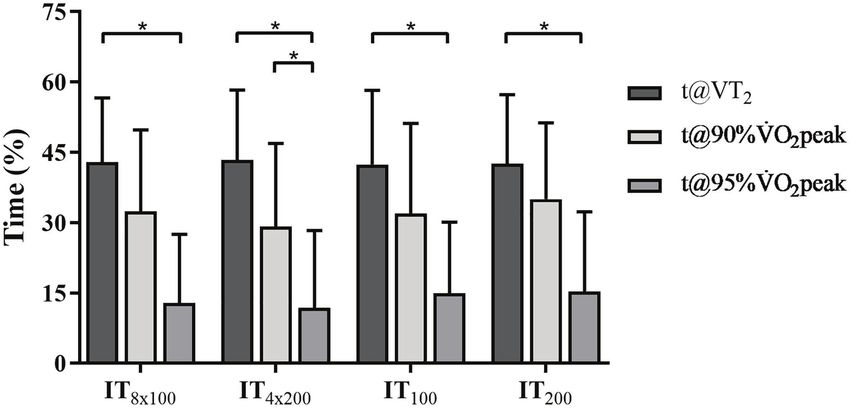
Almeida et al.                                                                                                                   High-Intensity Interval Training in Swimming

                                            A

                                            B

                                            C

                                            D

  FIGURE 1 | Overview of experimental design for 200-m performance (A), discontinuous incremental step test (B), IT8x100 (C), and IT4x200 (D). The total time limit (tLim)
  indicates n repetitions until exhaustion during IT100 and IT200, respectively (A,B).

VT2 occurred. Maximal exertion during the incremental step                                  The time spent (in seconds) with ⩒O2 above the VT₂(t@
test was ensured by analyzing secondary criteria, as [La−]peak                           VT2), 90% (t@90%), and 95% (t@95%) of ⩒O2peak and the
(≥8 mmol·l−1) and respiratory exchange ratio (RER > 1; Baldari                           corresponding percentage (%) for the total duration of each
et al., 2013). The maximal 30-s (moving) averaged ⩒O2 attained                           IT were determined, as well as the time to exhaustion (tLim)
during each IT protocol was considered the Peak-⩒O2, and                                 and distance performed by each swimmer.
the MPeak-⩒O2 was the average of the maximal ⩒O2 (30-s                                      For the ⩒O2K analysis, the outliers (exclusion of values lying
moving average) attained during each bout of the IT protocols.                           over three SDs from the local mean) were previously excluded
Both Peak-⩒O2 and MPeak-⩒O2 were calculated in IT8x100 and                               from the analysis, and the breath-by-breath data were interpolated
IT4x200, as well as for the entire IT100 and IT200.                                      into 1-s values. Only the first bout of each IT protocol

Frontiers in Physiology | www.frontiersin.org                                        4                                                July 2021 | Volume 12 | Article 662029
Almeida et al. High-Intensity Interval Training in Swimming
(100 and 200-m) was used for the determination of the ⩒O2K TABLE 2 | Measurements (mean ± SD) during the incremental step test for the
entire groups of participants (N = 12).
parameters [time delay (TD), time constant (τ), and amplitude
(A)]. The cardiodynamic phase of the ⩒O2 response at the onset Variables Mean ± SD IC95% SEM
of the exercise was discharged by removing the first 20 s of the
⩒O2 response (Filho et al., 2012). As described by Reis et al. ⩒O2peak (ml·kg−1·min−1) 59.2 ± 4.2 56.5–61.8 1.20
(2010), an individual “snorkel delay” (ISD) that corresponded to MAV (m·s−1) 1.27 ± 0.09 1.21–1.32 0.03
VT2 (ml·kg−1·min−1) 52.0 ± 3.9 49.5–54.4 1.14
the difference between the onset of exercise and the time when
VT2 (%⩒O2peak) 87.9 ± 3.2 85.8–89.9 0.93
the following breaths summed up a tidal volume superior to vVT2 (m·s−1) 1.20 ± 0.10 1.14–1.26 0.03
the outlet tube volume was calculated for each test. The ISD vVT2 (%MAV) 94.0 ± 3.9 91.5–96.4 1.11
was adapted to the specific characteristic of the snorkel device [La-]peak (mmol·L−1) 10.3 ± 2.6 8.6–11.9 0.74
used in this study and then integrated into the time delay of RER 1.05 ± 0.15 0.96–1.15 0.04
the ⩒O2 response. The ⩒O2 vs. time mono-exponential adjustments IC95%, confidence interval; SEM, standard error of mean; MAV, maximal aerobic
were analyzed through an iterative procedure by minimizing the power; and RER, respiratory exchange ratio.
sum of the mean squares of the differences between the modeled
and the measured ⩒O2 values, according to the following equation: and RER reached values corresponding to the maximal exertion,
and the entire sample of participants (male and female) exhibited
VO
2( t ) = VO 2base + A i 1 − e (
−( t −TD)/t
) no large variance for maximal and submaximal indexes of
aerobic conditioning level [coefficient of variation (CV) < 10%
where ⩒O2(t) represents the relative ⩒O2 at a given time; for ⩒O2peak and VT2]. An individual response of ⩒O2 increasing
⩒O2base represents the ⩒O2 at rest, which was calculated as the during the incremental step test and the profile of gas-exchange
average of the first 30-s of the last minute before the start of variable (⩒E, ⩒CO2, ⩒E/VO2, and ⩒E/⩒CO2) matching VT2 criteria
the exercise (after 10-min of passive rest); TD, τ, and A represent are illustrated in Figure 2.
the time delay, time constant, and amplitude of the primary The physiological and perceptual responses during the IT
phase of the ⩒O2response, respectively (Rodríguez et al., 2003; protocols and ⩒O2K analysis are shown in Table 3. Typical
Sousa et al., 2013; Almeida et al., 2020). The oxygen deficit responses of ⩒O2 in IT8x100 and IT4x200 are illustrated in Figure 3
(O2Def ) at the onset of the first 100 and 200-m of each IT for the male (panels A and B) and female (panels C and D)
protocol was measured as the product between mean response swimmers. The velocities while performing IT100 and IT200 did
time (MRT) and A, where the MRT is TD × τ (Whipp et al., 2005). not differ from MAV (p = 0.89 and p = 0.39, respectively)
or between each other (p = 0.44). When comparing ⩒O2peak
Statistical Analysis vs. Peak-⩒O2 (IT8x100) vs. Peak-⩒O2 (IT4x200), no significant
Initially, normality and homogeneity of data were accessed by differences were observed (p = 0.37). However, differences
the Shapiro–Wilk and Levene tests. The comparison of the were observed for the comparison of ⩒O2peak vs. MPeak-⩒O2
temporal, perceptual, and physiological responses between the (IT8x100) vs. MPeak-⩒O2 (IT4x200; p = 0.01). Similar results were
two IT protocols was performed considering all the samples observed when comparing the IT100 and IT200 protocols.
with the t-test for unpaired samples, or with the Mann–Whitney Therefore, there were no significant differences for ⩒O2peak
test when the assumptions for parametric tests were not met. vs. Peak-⩒O2 (IT100) vs. Peak-⩒O2 (IT200; p = 0.32), but significant
The Kruskal–Wallis test compared ⩒O2peak and [La−]peak differences were observed for ⩒O2peak vs. MPeak-⩒O2 (IT100)
responses during the incremental step test vs. Peak-⩒O2 during vs. MPeak-⩒O2 (IT200; p < 0.01). Additionally, no significant
IT8x100 and IT4x200, and vs. Peak-⩒O2 during the entire IT100 differences were observed for [La−]peak responses after the
and IT200 protocols. The Spearman coefficient (ro) tested the incremental step test vs. IT100 vs. IT200 (p = 0.15). Regarding
rank-order correlation between physiological, perceptual, and the RPE, differences were observed when comparing IT8x100
temporal responses during the IT protocols. The effect sizes vs. IT4x200 (p = 0.012; δ = 0.36) but no differences for IT100
(ES) were calculated by Cliff ’s δ, considering the n and p vs. IT200 (p = 0.55). The measurements of A1 (p = 0.38),
values for the differences analyzed by the Mann–Whitney test, TD (p = 0.89), τ (p = 0.67), and O2Def (p = 0.98) did not
which was interpreted as 0.2 weak, 0.36 medium, 0.52 strong, differ between IT100 and IT200.
and 0.76 very strong (Sheskin, 2011). The ro was interpreted The values of distance, time limit, and time spent above
as 0.8 VT₂, 90, and 95% of ⩒O2peak during the IT protocols are
(large; Ferguson, 2009). All statistical analyses were performed shown in Table 4. The comparison between the percentage
with the Statistical Package for the Social Sciences (version of t@VT₂, t@90%, and t@95% of ⩒O2peak during each IT
25.0; SPSS®, Chicago, IL, United States), and statistical significance protocol are illustrated in Figure 4. There were no significant
was accepted at p ≤ 0.05. differences in distance (p = 0.09) and tLim (p = 0.16) between
IT100 and IT200. No significant differences were observed when
comparing IT8x100 vs. IT4x200 with regard to t@VT₂ (p = 0.72),
RESULTS t@90% (p = 0.63), and t@95% (p = 1). Similarly, IT100 vs.
IT200 did not differ regarding t@VT₂ (p = 0.22), t@90% (p = 0.29),
The physiological responses of the swimmers during the and t@95% (p = 0.16). However, t@VT2 was higher than t@95%
incremental step test are shown in Table 2. The [La−]peak during IT8x100 (p < 0.01) and IT4x200 (p < 0.01).
Frontiers in Physiology | www.frontiersin.org 5 July 2021 | Volume 12 | Article 662029Almeida et al. High-Intensity Interval Training in Swimming
TABLE 3 | Mean ± SD of the physiological and perceptual responses during the IT protocols, and ⩒O2 kinetics (⩒O2K) during the first bout of IT100 and IT200 (N = 12).
Variable IT8x100 IT4x200 IT100 IT200
Peak-⩒O2 (ml·kg−1·min−1) 57.3 ± 4.9 57.2 ± 4.6 57.5 ± 5.0 57.3 ± 4.4
Peak-⩒O2 (%⩒O2peak) 96.8 ± 5.8 96.7 ± 4.4 97.1 ± 5.9 96.8 ± 3.8
MPeak-⩒O2 (ml·kg−1·min−1) 54.5 ± 4.2 55.2 ± 4.0 54.3 ± 4.1 55.1 ± 4.1
MPeak-⩒O2 (%⩒O2peak) 92.1 ± 4.6 93.3 ± 4.5 91.8 ± 4.6 93.3 ± 4.8
[La−]peak (mmol·L−1) - - 7.9 ± 3.4 8.7 ± 1.5
RPE (0–10 units) 7.62 ± 2.0* 9.5 ± 0.7* 9.4 ± 0.9 9.7 ± 0.9
A (ml·kg−1·min−1) - - 44.9 ± 6.1 43.0 ± 4.6
TD (s) 11.7 ± 4.2 11.1 ± 3.0
τ(s) - - 24.2 ± 8.9 24.6 ± 6.6
O2Def (ml·kg−1·min−1) - - 28.8 ± 14.3 27.0 ± 8.5
Velocity (m/s) - - 1.26 ± 0.09 1.23 ± 0.09
Velocity (%MAV) - - 99.7 ± 2.6 96.8 ± 2.4
Peak-⩒O2 and %Peak-⩒O2: maximal ⩒O2 achieved in the test and corresponding percentage of ⩒O2peak; MPeak-⩒O2 and %MPeak-⩒O2: average value and corresponding
percentage of the Peak-⩒O2 achieved during the performance of each bout of IT protocols; [La−]peak: peak blood lactate concentration after each IT protocol performance; velocity:
the actual velocity while performing each IT protocol.
*
Statistical difference between IT protocols (IT8x100 vs. IT4x200 or IT100 vs. IT200) at p ≤ 0.05.
The correlation between the IT protocols with regard to Therefore, both training protocols showed to elicit physiological
the temporal, physiological, and perceptual responses is shown responses that were typical of middle-distance swimming
in Table 5. The total distance and tLim attained during IT100 performance. Moreover, the analysis of the first 800 m allowed
and IT200 did not associate the protocols with each other the comparison between both training protocols (IT8x100 vs.
(p = 0.11 and p = 0.27) regarding performance. However, the IT4x200), highlighting that the perception of exertion level differed,
[La−]peaks after IT100 and IT200 are positively correlated while performing each IT, with a significantly higher RPE
(p < 0.01), as well as τ and O2Def for ⩒O2K during the first at IT4x200.
bout of IT100 and IT200 (p = 0.03 and p = 0.05), despite Peak- Other important findings to be highlighted are (i) the Peak-
⩒O2 not being associated when analyzing IT100 vs. IT200 (p = 0.53) ⩒O2 attained during both IT protocols did not differ from
and IT8x100 vs. IT4x200 (p = 0.6). Therefore, the IT protocols the ⩒O2peak attained during the incremental step test, which
are associated with each other only with regard to some features suggests that independently of the IT protocol (nx100-m/15-s
of anaerobic contribution and initial ⩒O2 response. The tLim and nx200-m/30-s) a maximal demand upon aerobic contribution
at IT100 and IT200 correlated with RPE at the strong (p < 0.01) was imposed; and (ii) the features of the stimulus upon [La−]
and poor (p = 0.08) levels, respectively, but the distance swam peak and O2Def denoted a moderate to high reliance on anaerobic
at IT100 and IT200 correlated both with RPE (p < 0.01 and contribution, which was similar between the IT protocols and
p = 0.04). The [La−]peak after IT100 showed no correlation therefore reproduce the energetics required in middle-distance
with tLim in IT100 (p = 0.09), and negative correlation with events. In perceptual terms, these IT protocols differed regarding
total distance in IT100 (p = 0.03). Additionally, the [La−]peak the sensation of exertion, with IT8x100 perceived as a less
after IT200 positively correlated with t@90%, t@95%, and O2Def exhaustive exercise, despite no physiological difference between
during IT4x200 (p = 0.03; p = 0.05; p < 0.01). ⩒O2peak and the IT protocols.
MAV correlated negatively with [La−]peak after IT100 [ro = −0.8, To the best of the knowledge of the authors, only two
p < 0.01, (medium); ro = −0.71, p = 0.01, (medium)]. MAV studies analyzed the ⩒O2 response in swimming during IT
correlated negatively with t@95% during IT200 (ro = −0.59, protocols. Libicz et al. (2005) reported that well-trained triathletes
p = 0.04), while ⩒O2peak had a positive correlation with total spent double the time above 95% of ⩒O2max (~145 vs. ~69-s)
distance in IT100 (ro = 0.55, p = 0.07), as well as ⩒O2peak in 8 × 100-m/30-s than in 16 × 50-m/15-s repetitions, despite
correlating significantly only with Peak-⩒O2 during IT4x200 the large variability observed in the ⩒O2 data constraining the
[ro = 0.64, p = 0.02, (medium)] but showed a tendency with level of statistical significance between each IT. Another study
Peak-⩒O2 during IT8x100 (ro = 0.52, p = 0.09). measured time sustained closer to ⩒O2max (>90% ⩒O2max)
during two different IT protocols (16 × 100 vs. 4 × 400 m)
performed at submaximal intensity (Δ25%LT-⩒O2max; Bentley
DISCUSSION et al., 2005). Similar to this study, the authors reported no
influence of the work interval duration on time sustained above
This study analyzed the ⩒O2 response, as well as the blood 90% of ⩒O2max (~564 vs. 341-s) nor on the maximal ⩒O2
lactate concentration and oxygen deficit induced by different (~93 vs. 92%) reached during each IT, as well as reporting
intermittent training protocols. The findings support that the no correlation between faster ⩒O2K (τ ~17-s during 400-m)
two IT formats studied (100-m/15-s and 200-m/30-s performed and longer times spent closer to ⩒O2max. The lack of significance
at MAV) were able to stimulate the exertion level close to for the differences was attributed to the large variability, which
maximal ⩒O2, as well as moderate to high anaerobic stimulation is therefore corroborated to the current data for either total
when considering blood lactate accumulation and oxygen deficit. time-limit or time spent at a high ⩒O2 in swimming, which
Frontiers in Physiology | www.frontiersin.org 6 July 2021 | Volume 12 | Article 662029Almeida et al. High-Intensity Interval Training in Swimming FIGURE 2 | Pulmonary ⩒O2 and other gas-exchange responses during the incremental step test for a male participant. The vertical dashed line indicates VT2 occurrence and the inclined dashed line illustrates isocapnic disturbance and ventilatory compensation. The progression for this male swimmer ranged from 67 to 100%⩒O2peak, and time performance range was 265–161-s, respectively, from the first to the seventh step. was higher than 30% and even larger at higher exercise intensity ability of the muscle system to attenuate the reliance on anaerobic (90 and 95% ⩒O2peak) for both IT. sources at the onset of exercise, as well as the accumulation Notwithstanding, the variability in time-limit performance of metabolites, which are processes often analyzed through sounds not to be a matter of sex-related differences in the oxygen deficit, blood lactate accumulation, and ⩒O2 on-kinetics sample, since other studies including only males or combining (Murgatroyd et al., 2011), with responses to specific exercise male and female participants also reported large temporal but not constrained to sex differences (Billat et al., 1996b; variability (Billat et al., 1999; Zuniga et al., 2011), despite sex Carter et al., 2006; Reis et al., 2017). differences regarding the time limit in intermittent swimming Therefore, the decrease or increase in anaerobic reliance performance remaining to be investigated. For continuous during intermittent exercise relies on the modification of the performance in swimming at paces demanding high ⩒O2, there ratio of work and rest intervals (Billat, 2001; Buchheit and are no differences in time limit between male and female Laursen, 2013b). Interval training has been proposed to increase swimmers, regardless of conditioning level (Fernandes et al., the time exercising with high ⩒O2 demand, which is not 2006). Indeed, the exercise tolerance (the endurance performance) attained without a high stimulus on anaerobic glycolysis during ⩒O2 sustained closer to ⩒O2peak is determined by the metabolism (Billat et al., 2000). However, according to Frontiers in Physiology | www.frontiersin.org 7 July 2021 | Volume 12 | Article 662029
Almeida et al.                                                                                                                High-Intensity Interval Training in Swimming

TABLE 4 | Mean ± SD of the distance and time performance during the IT protocols (N = 12).

Variable                                           IT8x100                      IT4x200                            IT100                              IT200

Distance (m)                                        800                          800                         1308.3 ± 611.7                     1016.7 ± 403.8
tLim (s)                                              -                            -                         1034.8 ± 462.8                      826.1 ± 302.7
t@VT2 (s)                                       274.7 ± 89.9†                290.1 ± 104.9†                   412.8 ± 202.6                      325.2 ± 109.5
t@90%⩒O2peak (s)                                208.0 ± 123.5                218.4 ± 122.1                    306.9 ± 216.4                      234.4 ± 119.9
t@95%⩒O2peak (s)                                 97.3 ± 100.1†                86.2 ± 109.1†                   147.5 ± 143.1                      103.8 ± 120.5

t@VT2, t@90%⩒O2peak, and t@95%⩒O2peak: time spent with the rate of ⩒O2 response at or above VT2, 90, and 95% of ⩒O2peak.
†
  Statistical difference between IT protocols (IT8x100 vs. IT4x200 or IT100 vs. IT200) at p ≤ 0.05.

Zuniga et al. (2011) and Rønnestad and Hansen (2016), short                            Therefore, both the protocols are suitable to match middle-
work intervals (30-s) compared with longer ones (3-min) may                            distance specificity regarding energetic contribution, which
allow athletes to complete longer IT exercise sessions with                            approaches ~25–26 ml·kg−1 and ~12 mmol·L−1 for swimming
greater metabolic demands and lower [La−]. Despite the study                           (200- and 400-m; Campos et al., 2017). Indeed, the values
of Libicz et al. (2005), which argued that short work interval                         observed for O2Def and [La−]peak in this study are also quite
IT in swimming fails to induce longer time spent near ⩒O2max,                          similar to the values reported for IT performed at 100%v⩒O2max
while inducing an excessive muscular fatigue or acidosis for                           in running and cycling (~20–31 ml·kg−1; ~5–7 mmol·L−1;
an effective improvement in endurance and middle-distance                              Billat, 2001; Scott, 2006; Panissa et al., 2018).
performance, this study was the first to evidence                                          However, the IT protocols showed particular correlations
this combination.                                                                      with anaerobic variables as follows: (i) negative coefficients
   With regard to the ability of the IT protocols to elicit                            between [La−]peak vs. ⩒O2peak, MAV, tLim, and total distance
maximal ⩒O2, this study observed that t@VT2 (exercise in a                             for IT100; and (ii) positive coefficients between [La−]peak vs.
severe domain, encompassing time spent at or above VT2) is                             t@90%, t@95%, and O2Def for IT200. These results suggest that
higher than 80% of tLim to perform either the first 800-m or                           swimmers with the highest ⩒O2peak and MAV had the tendency
the entire IT100 and IT200 protocols, while t@90% comprised                            to perform IT100 with low [La−]peak and, hence, tolerate more
40–50% of time for the first 800-m or tLim for the entire                              distance at MAV, which seems to account for the influence
protocols. Despite that the VT2 was attained ~88%⩒O2peak in                            of lower perceived exertion reported (less uncomfortable) by
this study, swimming at or above VT2 leads to an appreciable                           those swimmers. In contrast, swimmers with higher MAV
increase in VO2 (Pessôa Filho, 2012). Hence, the protocols                             had spent less time at or above 90%⩒O2peak during IT200,
studied enabled the increase in the time spent closer to ⩒O2peak,                      suggesting that the improvements of the time at high rates
when compared with the findings reported by Sousa et al.                               of ⩒O2 are related to high ⩒O2peak (wide range to ⩒O2
(2017) for continuous swimming performance at or above                                 adjustments) and anaerobic capacity (enable to support high
90%⩒O2peak at 90 and 100% of MAV (~78 and ~72%). Moreover,                             O2Def and [La−]peak), and, therefore, perceived as harder to
even considering time at or above 90% ⩒O2peak for this study                           perform. Hence, the performance during IT200 exhibits a typical
in absolute terms (~300–450-s), it was longer than those reported                      inverse relationship between MAV and tLim at rates closer to
by Sousa et al. (2017; ~268-s). However, in the study of Libicz                        ⩒O2max (Billat et al., 1996a). Additionally, the combination
et al. (2005), the time spent above 95% of maximal ⩒O2 was                             of long exercise bouts (>2 min), high intensity (100% MAV),
~22% of total time during IT planned with 8 × 100-m/30-s,                              and short rest intervals (≤30 s), as designed for IT200, are
which percentage is higher than the ~12–15% of total time                              difficult to manage with no acidosis because of the reduction
observed for t@95% during both IT8x100 and IT4x200 in the                              in phosphocreatine stores replacement and the increasing
present study. It is likely that the mode of performance                               reliance on the anaerobic glycolytic contribution (Billat, 2001;
(continuous vs. intermittent) and rest interval between 100-m                          Buchheit and Laursen, 2013b).
bouts (30 vs. 15-s) accounts for the differences between these                             These dynamics between phosphocreatine nadir and greater
studies and this study. In spite of the fact that this study only                      glycogen utilization can be more relevant to explain tLim than
analyzed the effect of velocity at 100% of MAV on ⩒O2 demand,                          microvascular blood flow and muscle oxygen extraction (temporal
the ⩒O2 elicited during IT100 and IT200 has satisfactory high                          parameters of ⩒O2K). The assumption that tLim is related to
similarity to those reported for continuous or intermittent                            ⩒O2K considers that fast VO2 response until the targeted muscle
efforts in swimming (Libicz et al., 2005) and other sports                             O2 requirements would reduce O2 deficit and metabolite
modalities (Billat, 2001; Buchheit and Laursen, 2013b).                                accumulation and, therefore, attenuate phosphocreatine and
   Nevertheless, total distance swam and tLim are not correlated                       glycogen stores depletion (Millet et al., 2003b; Bailey et al.,
between IT protocols, as well as t@VT2, t@90%, and t@95%,                              2009). For example, the increase in O2 availability induced by
which means that the IT protocols are independent in those                             prior heavy exercise could be higher for subjects with a slower
measures. Also, the protocols did not correlate regarding the                          time constant, improving the time spent above 90%⩒O2max when
peak of ⩒O2 reached during the performance of each IT protocol,                        performing at 100 or 105% of MAV (Millet et al., 2003b).
although temporal ⩒O2K and anaerobiosis stimulus (O2Def and                            For Bailey et al. (2009), the analysis of ⩒O2K has the potential
[La−]peak) correlated with each other between protocols.                               to demonstrate the enhancement of exercise tolerance after

Frontiers in Physiology | www.frontiersin.org                                      8                                              July 2021 | Volume 12 | Article 662029
Almeida et al.                                                                                                             High-Intensity Interval Training in Swimming

                                         A

                                         B

                                         C

                                         D

  FIGURE 3 | ⩒O2 response during IT8x100 (A,C) and IT4x200 (B,D) for male (A,B) and female (C,D) swimmers. The yellow, orange, and red shadow areas highlight the
  t@VT2, t@90%, and t@95% of ⩒O2peak, respectively.

interval training through a substantial increase in oxidative                           Additionally, the better explanation for the tLim in IT200 is that
energy contribution and a reduced reliance on anaerobiosis                           superior performance was obtained by swimmers with high
stimulus. Despite these authors not finding a correlation between                    ⩒O2peak, which would delay the attainment of maximal ⩒O2
the magnitude of changes in tolerance with time constant of                          and thus a tendency to reduce the accumulation of metabolites,
⩒O2K and aerobic conditioning indexes, this could be further                         whereas during IT100 the short exercise interval attenuates anaerobic
explored in future studies trying to gather information on                           stimulus with no impairment on ⩒O2 response. This is in agreement
what adjustments in ⩒O2K ensure aerobic capacity enhancement,                        with Zuniga et al. (2011) who reported that short work intervals
while training with the protocols proposed in this study.                            (30-s) compared with longer ones (3-min) may allow athletes

Frontiers in Physiology | www.frontiersin.org                                    9                                             July 2021 | Volume 12 | Article 662029
Almeida et al. High-Intensity Interval Training in Swimming
TABLE 5 | Spearman rank-order coefficients for the responses of temporal, physiological, and perceptual variables between the IT protocols.
Variables Protocol RPE [La−]peak
IT100 vs. IT200 IT8x100 vs. IT4x200 IT100 IT200 IT100 IT200
Distance 0.49 na −0.86** [large] 0.60* [medium] −0.63* [medium] −0.38
tLim 0.35 na −0.85** [large] −0.53 −0.52 −0.16
t@VT2 −0.04 −0.02 −0.34 0.08 −0.20 0.48
t@90% 0.16 0.23 −0.38 −0.18 0.08 0.64* [medium]
t@95% 0.22 0.30 −0.30 −0.11 0.22 0.59* [medium]
τ 0.62* [medium] na 0.21 0.32 0.32 0.46
O2Def 0.59* [medium] na −0.21 −0.10 0.23 0.72** [medium]
Peak-⩒O2 0.20 0.17 0.23 −0.52 −0.29 0.15
[La-]peak 0.74** [medium] na 0.61* [medium] 0.38 na na
RPE 0.00 0.67* [medium] na na na na
Obs.: distance (swam at the end of each protocol) in meters; tLim (time limit); t@VT2, t@90%, t@95% (time spent at a given rate) and time constant (τ) all in seconds; O2Def (oxygen
deficit at the onset of each IT protocol) in ml/kg; Peak-⩒O2 (peak ⩒O2 attained during each IT protocol) in ml/kg/min, [La−]peak (peak blood lactate accumulation during each IT
protocol) in mmol/L; and rate of perceived exertion (RPE; Borg grade of exertion). The acronym “na” refers to the “not analyzed” correlation.
Significant correlation at *p ≤ 0.05; **p ≤ 0.01.
FIGURE 4 | The percentage of t@VT2, t@90%⩒O2peak, and t@95%⩒O2peak at IT8x100, IT4x200, IT100, and IT200. *Statistical difference intra interval training (IT)
protocols (t@VT2 vs. t@90%⩒O2peak vs. t@95%⩒O2peak) at p ≤ 0.05. No differences were observed between the IT protocols (IT8x100 vs. IT4x200 or IT100 vs. IT200).
to complete a longer IT session with greater metabolic demands the exertion level close to maximal ⩒O2, as well as moderate
and lower [La−] accumulations. The findings of this study might to high blood lactate concentrations and oxygen deficit, which
be useful for coaches to decide on the work interval (100- or is the finding to be highlighted for IT in swimming, as first
200-m bouts) that match the needs for aerobic power of the demonstrated in this study. The fact that only the perceived
team. In this study, the inclusion of male and female swimmers exertion level differed between the IT protocols suggested that
is a limitation when considering differences in muscle mass and coaches should consider that nx100-m/15-s is perceived as less
blood perfusion in the upper limbs (Koons et al., 2019), but difficult to perform than nx200-m/30-s for the first 800-m when
how sex differed with regard to ⩒O2 increase and tolerance during managing the best strategy to be implemented for aerobic power
different work:rest ratio interval training still remains to enhancement. Finally, the ⩒O2K parameters (time constant and
be answered. Furthermore, swimming with a snorkel and open amplitude) were not associated to tolerance in each IT protocol,
turns may be a constraint to free swimming training. suggesting that tLim during IT is not related to the parameters
of ⩒O2K that characterize oxidative contribution and anaerobiosis
reliance, but this analysis should be considered to evaluate the
CONCLUSION potential of aerobic power enhancement with IT.
This study concluded that both the IT protocols performed at
MAV showed similar physiological and temporal responses DATA AVAILABILITY STATEMENT
whatever the distance (100 or 200-m) utilized for exercise bouts.
Additionally, the protocols can be considered suitable to improve The raw data supporting the conclusions of this article are
middle-distance swimming performance, since both stimulated fully available without restriction when required to the authors.
Frontiers in Physiology | www.frontiersin.org 10 July 2021 | Volume 12 | Article 662029Almeida et al. High-Intensity Interval Training in Swimming
ETHICS STATEMENT 001), participated with a fellowship award. The São Paulo
Research Foundation (FAPESP, PROCESS 2016/04544-3)
This study was approved by the local University Ethical participated with partial financial support for the study
Committee of the Faculdade de Motricidade Humana development. The Foundation for Science and Technology,
(UL-CEFMH: 39/2015). Written informed consent to participate I.P., (Grant/Award Number UIDB/04748/2020) participated
in this study was provided by the participants’ legal guardian/ with partial financial support for the study development.
next of kin.
ACKNOWLEDGMENTS
AUTHOR CONTRIBUTIONS
The authors would like to express their gratitude to the
TA, DP, and FA conceived and designed the study. TA, DP, swimmers for their time and effort, and to the swimming
ME, JR, AS, DM, and FS conducted the experiments and teams for making both their infrastructures and staff available
analyzed the data. TA, DP, ME, JR, and FA wrote the manuscript. for the study.
All authors contributed to the article and approved the
submitted version.
SUPPLEMENTARY MATERIAL
The Supplementary Material for this article can be found online
FUNDING at: https://www.frontiersin.org/articles/10.3389/fphys.2021.662029/
full#supplementary-material
The Foundation for Science and Technology (Portugal, SFRH/
BD/73022/2010), and Coordenação de Aperfeiçoamento de Supplementary Material | Transportation of gas analyzer system and sampling
Pessoal de Nível Superior – Brazil (CAPES – Finance Code unit at the side of the pool.
REFERENCES longer time than intense but submaximal runs. Eur. J. Appl. Physiol. 81,
188–196. doi: 10.1007/s004210050029
Almeida, T. A. F., Pessôa Filho, D. M., Espada, M. A. C., Reis, J. F., Simionato, A. R., Borg, G. (1990). Psychophysical scaling with applications in physical work and
Siqueira, L. O. C., et al. (2020). ⩒O2 kinetics and energy contribution in the perception of exertion. Scand. J. Work Environ. Health 16, 55–58. doi:
simulated maximal performance during short and middle distance-trials in 10.5271/sjweh.1815
swimming. Eur. J. Appl. Physiol. 120, 1097–1109. doi: 10.1007/s00421-020-04348-y Buchheit, M., and Laursen, P. B. (2013a). High-intensity interval training,
Bailey, S. J., Wilkerson, D. P., DiMenna, F. J., and Jones, A. M. (2009). Influence solutions to the programming puzzle part I: cardiopulmonary emphasis.
of repeated sprint training on pulmonary O2 uptake and muscle deoxygenation Sports Med. 43, 313–338. doi: 10.1007/s40279-013-0029-x
kinetics in humans. J. Appl. Physiol. 106, 1875–1887. doi: 10.1152/ Buchheit, M., and Laursen, P. B. (2013b). High-intensity interval training, solutions
japplphysiol.00144.2009 to the programming puzzle part II: anaerobic energy, neuromuscular load and
Baldari, C., Fernandes, R. J., Meucci, M., Ribeiro, J., Vilas-Boas, J. P., and practical applications. Sports Med. 43, 927–954. doi: 10.1007/s40279-013-0066-5
®
Guidetti, L. (2013). Is the new aquatrainer snorkel valid for ⩒O2
assessment in swimming? Int. J. Sports Med. 34, 336–344. doi: 10.1055/
Campos, E. Z., Kalva-Filho, C. A., Gobbi, R. B., Barbieri, R. A., Almeida, N. P.,
and Papoti, M. (2017). Anaerobic contribution determined in swimming distances:
s-0032-1321804 relation with performance. Front. Physiol. 8:755. doi: 10.3389/fphys.2017.00755
Bentley, D. J., Roels, B., Hellard, P., Fauquet, C., Libicz, S., and Millet, G. P. Carter, H., Pringle, J. S. M., Barstow, T. J., and Doust, J. H. (2006). Oxygen
(2005). Physiological responses during submaximal interval swimming training: uptake kinetics during supra VO2max treadmill running in humans. Int. J.
effects of interval duration. J. Sci. Med. Sport 8, 392–402. doi: 10.1016/ Sports Med. 27, 149–157. doi: 10.1055/s-2005-873076
S1440-2440(05)80054-4 Dalamitros, A. A., Zafeiridis, A. S., Toubekis, A. G., Tsalis, G. A., Pelarigo, J. G.,
Billat, L. V. (2001). Interval training for performance: a scientific and empirical Manou, V., et al. (2016). Effects of short-interval and long-interval swimming
practice. Special recommendations for middle- and long-distance running. protocols on performance, aerobic adaptations, and technical parameters. J.
Part I: aerobic interval training. Sports Med. 31, 13–31. doi: Strength Cond. Res. 30, 2871–2879. doi: 10.1519/JSC.0000000000001369
10.2165/00007256-200131010-00002 Espada, M. C., Alves, F. B., Curto, D., Ferreira, C. C., Santos, F. J., Pessôa
Billat, V., Faina, M., Sardella, F., Marini, C., Fanton, F., Lupo, S., et al. (1996a). Filho, D. M., et al. (2021). Can an incremental step test be used for maximal
A comparison of time to exhaustion at ⩒O2max in elite cyclists, kayak paddlers, lactate steady state determination in swimming? Clues for practice. Int. J.
swimmers and runners. Ergonomics 39, 267–277. doi: 10.1080/00140139608964457 Environ. Res. Public Health 18:477. doi: 10.3390/ijerph18020477
Billat, V., Beillot, J., Jan, J., Rochcongar, P., and Carre, F. (1996b). Gender Espada, M. C., Reis, J. F., Almeida, T. F., Bruno, P. M., Vleck, V. E., and
effect on the relationship of time limit at 100% ⩒O2max with other bioenergetic Alves, F. B. (2015). Ventilatory and physiological responses in swimmers
characteristics. Med. Sci. Sports Exerc. 28, 1049–1055. doi: below and above their maximal lactate steady state. J. Strength Cond. Res.
10.1097/00005768-199608000-00016 29, 2836–2843. doi: 10.1519/JSC.0000000000000504
Billat, L. V., Blondel, N., and Berthoin, S. (1999). Determination of the velocity Ferguson, C. J. (2009). An effect size primer: a guide for clinicians and researchers.
associated with the longest time to exhaustion at maximal oxygen uptake. Prof. Psychol. Res. Pract. 40, 532–538. doi: 10.1037/a0015808
Eur. J. Appl. Physiol. Occup. Physiol. 80, 159–161. doi: 10.1007/s004210050573 Fernandes, R. J., Billat, V. L., Cruz, A. C., Colaço, P. J., Cardoso, C. S., and
Billat, L. V., and Koralsztein, J. P. (1996). Significance of the velocity at ⩒O2max Vilas-Boas, J. P. (2006). Does net energy cost of swimming affect time to
and time to exhaustion at this velocity. Sports Med. 22, 90–108. doi: exhaustion at the individual’s maximal oxygen consumption velocity? J. Sports
10.2165/00007256-199622020-00004 Med. Phys. Fitness 46, 373–380.
Billat, V. L., Slawinski, J., Bocquet, V., Demarle, A., Lafitte, L., Chassaing, P., Harriss, D. J., Macsween, A., and Atkinson, G. (2017). Standards for ethics in
et al. (2000). Intermittent runs at the velocity associated with maximal sport and exercise science research: 2018 update. Int. J. Sports Med. 38,
oxygen uptake enables subjects to remain at maximal oxygen uptake for a 1126–1131. doi: 10.1055/s-0043-124001
Frontiers in Physiology | www.frontiersin.org 11 July 2021 | Volume 12 | Article 662029Almeida et al. High-Intensity Interval Training in Swimming Jones, A. M., and Burnley, M. (2009). Oxygen uptake kinetics: an underappreciated Scott, C. B. (2006). Estimating energy expenditure for brief bouts of exercise with determinant of exercise performance. Int. J. Sports Physiol. Perform. 4, acute recovery. Appl. Physiol. Nutr. Metab. 31, 144–149. doi: 10.1139/h05-013 524–532. doi: 10.1123/ijspp.4.4.524 Sheskin, D. J. (2011). Handbook of Parametric and Nonparametric Statistical Koons, N. J., Suresh, M. R., Schlotman, T. E., and Convertino, V. A. (2019). Procedures. Boca Raton: Chapman and Hall/CRC, 1886. Interrelationship between sex, age, blood volume, and ⩒O2max. Aerosp. Med. Sousa, A., de Jesus, K., Figueiredo, P., Vilas-Boas, J. P., and Fernandes, R. J. Hum. Perform. 90, 362–368. doi: 10.3357/AMHP.5255.2019 (2013). Oxygen uptake kinetics at moderate and extreme swimming Libicz, S., Roels, B., and Millet, G. P. (2005). ⩒O2 responses to intermittent intensities. Rev. Bras. Med. Esporte 19, 186–190. doi: 10.1590/S1517- swimming sets at velocity associated with ⩒O2max. Can. J. Appl. Physiol. 30, 86922013000300008 543–553. doi: 10.1139/h05-140 Sousa, A. C., Fernandes, R. J., Vilas-Boas, J. P., and Figueiredo, P. (2018). Millet, G. P., Candau, R., Fattori, P., Bignet, F., and Varray, A. (2003a). ⩒O2 High-intensity interval training in different exercise modes: lessons responses to different intermittent runs at velocity associated with ⩒O2max. from time to exhaustion. Int. J. Sports Med. 39, 668–673. doi: 10.1055/ Can. J. Appl. Physiol. 28, 410–423. doi: 10.1139/h03-030 a-0631-2682 Millet, G. P., Libicz, S., Borrani, F., Fattori, P., Bignet, F., and Candau, R. (2003b). Sousa, A., Figueiredo, P., Zamparo, P., Pyne, D. B., Vilas-Boas, J. P., and Effects of increased intensity of intermittent training in runners with differing Fernandes, R. J. (2015). Exercise modality effect on bioenergetical performance ⩒O2 kinetics. Eur. J. Appl. Physiol. 90, 50–57. doi: 10.1007/s00421-003-0844-0 at ⩒O2max intensity. Med. Sci. Sports Exerc. 47, 1705–1713. doi: 10.1249/ Murgatroyd, S. R., Ferguson, C., Ward, S. A., Whipp, B. J., and Rossiter, H. B. MSS.0000000000000580 (2011). Pulmonary O2 uptake kinetics as a determinant of high-intensity Sousa, A., Vilas-Boas, J. P., Fernandes, R. J., and Figueiredo, P. (2017). ⩒O2 at exercise tolerance in humans. J. Appl. Physiol. 110, 1598–1606. doi: 10.1152/ maximal and supramaximal intensities: lessons to high-intensity interval training japplphysiol.01092.2010 in swimming. Int. J. Sports Physiol. Perform. 12, 872–877. doi: 10.1123/ Panissa, V. L., Fukuda, D. H., Caldeira, R. S., Gerosa-Neto, J., Lira, F. S., ijspp.2016-0475 Zagatto, A. M., et al. (2018). Is oxygen uptake measurement enough to Spencer, M. R., and Gastin, P. B. (2001). Energy system contribution during estimate energy expenditure during high-intensity intermittent exercise? 200- to 1500-m running in highly trained athletes. Med. Sci. Sports Exerc. Quantification of anaerobic contribution by different methods. Front. Physiol. 33, 157–162. doi: 10.1097/00005768-200101000-00024 9:868. doi: 10.3389/fphys.2018.00868 Wen, D., Utesch, T., Wu, J., Robertson, S., Liu, J., and Hu, G. (2019). Effects Pessôa Filho, D. M., Alves, F. B., Reis, J. F., Greco, C. C., and Denadai, B. S. of different protocols of high intensity interval training for ⩒O2max improvements (2012). ⩒O2 kinetics during heavy and severe exercise in swimming. Int. J. in adults: a meta-analysis of randomised controlled trials. J. Sci. Med. Sport Sports Med. 33, 744–748. doi: 10.1055/s-0031-1299753 22, 941–947. doi: 10.1016/j.jsams.2019.01.013 Reis, J. F., Alves, F. B., Bruno, P. M., Vleck, V., and Millet, G. P. (2012a). Whipp, B. J., Ward, S. A., and Rossiter, H. B. (2005). Pulmonary O2 uptake Effects of aerobic fitness on oxygen uptake kinetics in heavy intensity during exercise: conflating muscular and cardiovascular responses. Med. Sci. swimming. Eur. J. Appl. Physiol. 112, 1689–1697. doi: 10.1007/s00421-011-2126-6 Sports Exerc. 37, 1574–1585. doi: 10.1249/01.mss.0000177476.63356.22 Reis, J. F., Alves, F. B., Bruno, P. M., Vleck, V., and Millet, G. P. (2012b). Zuniga, J. M., Berg, K., Noble, J., Harder, J., Chaffin, M. E., and Hanumanthu, V. S. Oxygen uptake kinetics and middle distance swimming performance. J. Sci. (2011). Physiological responses during interval training with different intensities Med. Sport 15, 58–63. doi: 10.1016/j.jsams.2011.05.012 and duration of exercise. J. Strength Cond. Res. 25, 1279–1284. doi: 10.1519/ Reis, J. F., Millet, G. P., Bruno, P. M., Vleck, V., and Alves, F. B. (2017). Sex JSC.0b013e3181d681b6 and Exercise Intensity Do Not Influence Oxygen Uptake Kinetics in Submaximal Swimming. Front. Physiol. 8. doi: 10.3389/fphys.2017.00072 Conflict of Interest: The authors declare that the research was conducted in Reis, J. F., Millet, G. P., Malatesta, D., Roles, B., Borrani, F., Vleck, V. E., et al. the absence of any commercial or financial relationships that could be construed (2010). Are oxygen uptake kinetics modified when using a respiratory as a potential conflict of interest. snorkel? Int. J. Sports Physiol. Perform. 5, 292–300. doi: 10.1123/ijspp.5.3.292 Rodríguez, F. A., Keskinen, K. L., Malvela, M. T., and Keskinen, O. P. (2003). Copyright © 2021 Almeida, Pessôa Filho, Espada, Reis, Sancassani, Massini, Santos “Oxygen uptake kinetics during free swimming: A pilot study,” in Biomechanics and Alves. This is an open-access article distributed under the terms of the Creative and Medicine in Swimming IX. ed. J. C. Chatard (Saint-Étienne: Publications Commons Attribution License (CC BY). The use, distribution or reproduction in de l’Université de Saint-Étienne), 379–384. other forums is permitted, provided the original author(s) and the copyright owner(s) Rønnestad, B. R., and Hansen, J. (2016). Optimizing interval training at power are credited and that the original publication in this journal is cited, in accordance output associated with peak oxygen uptake in well-trained cyclists. J. Strength with accepted academic practice. No use, distribution or reproduction is permitted Cond. Res. 30, 999–1006. doi: 10.1519/JSC.0b013e3182a73e8a which does not comply with these terms. Frontiers in Physiology | www.frontiersin.org 12 July 2021 | Volume 12 | Article 662029
You can also read